4215 Lanark Dr · Weatherford, TX
Flood risk 1/10 · Minimal
- FEMA flood zone
- X (unshaded)
- Chance of flooding over 30 yrs
- 0.0%
- Est. flood insurance / yr
- $507 – $1,088
Fire risk 7/10 · Major
- Est. fire insurance / yr
- $1,222 – $2,270
Heat risk 7/10 · Major
- Hot days now (above 107°F)
- 7 days/yr
- Hot days in 30 yrs
- 23 days/yr
Wind risk 6/10 · Moderate
- Chance of severe wind over 30 yrs
- 27.0%
Air-quality risk 2/10 · Minimal
- Unhealthy air days now
- 1 days/yr
- Unhealthy air days in 30 yrs
- 2 days/yr
Risk factors via First Street. Map © Google.
Why this score? — see what drove the C grade
The composite is a weighted blend of 9 inputs, each scored 0–100. Each bar is that input's sub-score; the figure is the points it added to the 100-point composite (weight × sub-score).
- Cash flow +21.6/30.0
- ARV discount +7.5/15.0
- DSCR +6.9/10.0
- 1% rule +4.8/10.0
- Appreciation +4.1/10.0
- Schools +4.0/10.0
- Livability +3.6/5.0
- Rent growth +2.5/5.0
- Condition / age +2.5/5.0
$149,000
🖨 Deal sheet 📄 Offer letter ✓ Due diligence
Listing remarks
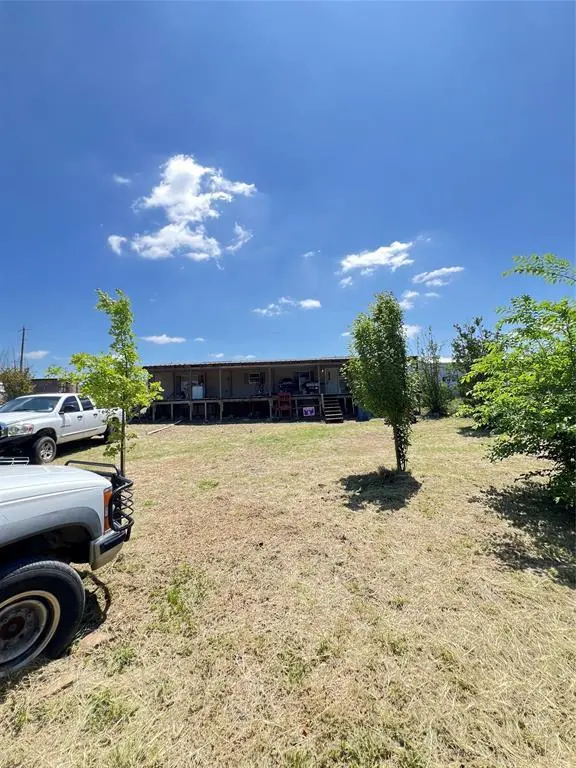
Looking for something to call you own? Something you can make yours with your own style and charm? This listing has all the room you need to do the things you want to do. Come bring your personal touch and turn this two bedroom 2 bathroom house into you home. Sitting on . 17 of an acres, youll have the room for gardening, flowers, and all the outdoor activities you can have with the family. Come check it out.
Key facts
- 7,405 sq ft lot
- Built 2013
- Listed 53 days
Property features AI
Finance
- Other: Easements for electric, telephone and utilities; Lot is less than 0.5 acre (approx. 0.17 acre); Subdivision: Highland Lakes; Directions: Use GPS — house is on the corner; County: Hood
- Financial info: Listing terms: Cash or Conventional; Treat as clear loan type; No second mortgage
- HOA & community: No homeowners association
Exterior
- Parking: Driveway (no garage or covered/carport spaces)
- Utilities: Co-op electric; Co-op water; Electricity connected; Private sewer / Septic
- Home design: Manufactured home (residential); One story; Preowned (built in 2013); Property is attached
- Construction: Siding exterior; Composition roof; Built in 2013; No other structures on lot
- Exterior features: Chain link fenced yard with gate; Fenced front yard; Deck
Interior
- Kitchen: Disposal; Electric cooktop; Electric water heater
- Bedrooms: 2 bedrooms (both on main level)
- Flooring: Laminate flooring
- Bathrooms: 2 full bathrooms
- Heating & cooling: Central air; Ceiling fan(s); Electric heating
- Interior features: Cable TV available; High-speed internet available; One living area; One dining area; Total of 4 rooms
- Laundry & utility: Full-size washer/dryer area; Washer hookup; Electric dryer hookup; Utility room
Neighborhood map
What this means for you Summary
Snapshot
- This is a 2-bed/2.0-bath manufactured listed at $149k.
Deal economics
- At list price, monthly cash flow is $226 ($3k/yr) — positive.
- The deal already cash-flows at list — no discount required.
- To meet the 1% rule (rent ≥ 1% of price), the offer needs to be $146k (1.8% below list).
- Recommended offer: $145k (3.0% below list) — sets the bar for market timing.
- Cap rate 8.1% vs local median 2.7% in Weatherford — top-decile yield for the area; either an underpriced asset or a hidden risk that comps aren't pricing in. Stress-test before assuming the spread holds.
Location & tenants
- Location reads 71/100 on livability (#289 in TX) — a middle-class / working-renter tenant base. Strengths: cost of living A+, housing A+, crime B+; Watch: health & safety D+, amenities F, commute F.
- Granbury ISD (town): math 46% / reading 46% proficiency, ranked #237 of 826 in TX (top 29%) — families likely to look elsewhere, expect single-tenant / working-renter base with shorter leases.
- Zoned schools: Acton El (math 52% / reading 46%, grade D, #926 of 4,322 statewide, top 22%, 814 students, 48% FRL).
- Market conditions: 97 active listings in the ZIP; 125 units permitted in Hood County in 2024 (0 in 5+ unit buildings).
Forward outlook
- Local home prices are declining (-1.9%/yr); year-one equity from $1k of loan paydown is wiped out by about $3k of value loss. Plan a longer hold.
- Hood County population projected at +29% by 2050 — long-run rental-demand tailwind backs the buy-and-hold thesis.
Negotiation context
- It's been on market 53 days — a 3% lower offer ($145k) is reasonable based on typical stale-listing flexibility.
- Current owner paid $10k; list at $149k implies a 1468% gain — meaningful room to come down on a strong offer.
Risks & watch-outs
- Climate carrying-cost: major wind risk, 27% chance of damaging wind over 30y; major wildfire risk; extreme-heat days projected 7→23/yr by 2055 (HVAC capex compounding) — expect insurance premiums to compound above CPI over the hold.
Questions for the listing agent
- It's been on market 53 days. Have you received any prior offers? Is the seller open to a 3% concession, seller financing, or rate buy-down credit?
- Is there a deadline driving the sale (1031 exchange, divorce, estate, relocation)? That informs how much negotiation room exists.
- Schools are D-rated, which usually means shorter tenancies and higher turnover. Who's the typical renter profile here, and what's been the actual vacancy rate?
- What's the average days-on-market for RENTAL listings here right now (not sales)? A rising rental-DOM trend means longer vacancies and softer asking-rent achievability than the comps imply.
- What's the recent tenant-quality profile in this submarket — average credit score on applications, eviction rate, late-payment / NSF rate, and stable-employment percentage? A property-management company in the area should have these aggregated.
- How much new for-sale + rental construction is in the pipeline within 1–3 miles? Heavy new supply typically softens prices + rents 12–24 months out; constrained supply supports both.
Investment metrics
- 1% rule
- 0.98% ✗
- Cap rate
- 8.11%
- Cash-on-cash
- 6.50%
- DSCR
- 1.29
- GRM
- 8.5
CMA / ARV
- ARV (on-the-fly)
- $91,200
- Comps found
- 1
Show comp detail 1 sale within ~0.75 mi
| Address | Dist | Beds/Ba | Sqft | Sold | Price | $/sf | Match |
|---|---|---|---|---|---|---|---|
| 4901 Lanark Ct | 0.08mi | 3/1.0 (+1) | 840 (-12%) | 14mo | $80,000 | $95 | 54 |
Match score weights: distance 35% · size 25% · config 20% · recency 20%. Top-matched comps best support the ARV.
Projected returns pro-forma
-1.87% appreciation · 3.0% rent growth · sell at horizon
- IRR
- -1.5%
- Equity multiple
- 0.94×
- Total profit
- $-2,603
- Equity at exit
- $29,855
- IRR
- 6.3%
- Equity multiple
- 1.54×
- Total profit
- $22,565
- Equity at exit
- $26,393
Cash invested: $41,720 (down + closing). Projections, not guarantees.
Landlord ↔ Tenant lean methodology
- Overall (STATE)
- 87 Strongly Landlord-Friendly
- State Texas
- 87 Strongly Landlord-Friendly · R+5
- County
- — inherits STATE
- City
- — inherits STATE
ZIP-level market 76035
- Home prices YoY
- -1.0%
- Active inventory
- 97
- Price-to-rent
- 8.5×
Monthly cashflow live
- Estimated rent
- $1,463 medium interval (Pro) →
- Mortgage (P&I)
- −$781
- Tax from tax record
- −$87 /mo · $1,039/yr
- Insurance
- −$62
- HOA
- −$0
- Vacancy / Maint / Mgmt
- −$307
- Net cashflow
- $226
Break-even live
UW: 25.0% down · 7.5% · 30yr · 1.5% tax · 5.0% vac · 8.0% maint · 8.0% mgmt
Financing live
Cash to close
- Down payment
- $37,250
- Closing costs
- $4,470
- Reserves months
- —
- Total cash needed
- —
Loan-product check · same deal, 3 products live
Conventional
25% down · 7.5% · 30yr
- Down + closing
- —
- Monthly P&I
- —
- Monthly cashflow
- —
- DSCR
- —
- Eligible?
- —
Personal DTI + credit; lowest rate.
DSCR
20% down · 8.5% · 30yr
- Down + closing
- —
- Monthly P&I
- —
- Monthly cashflow
- —
- DSCR
- —
- Eligible?
- —
No personal income docs; deal must DSCR.
Hard money
10% down · 12.0% · 12mo
- Down + closing
- —
- Monthly P&I
- —
- Monthly cashflow
- —
- DSCR
- —
- Eligible?
- —
Short-term bridge; refi at stabilization.
Listing history 15 events
-
2026-06-18days on market $149,000 Active 53 DOM
-
2026-06-17days on market $149,000 Active 52 DOM
-
2026-06-16days on market $149,000 Active 51 DOM
-
2026-06-15days on market $149,000 Active 50 DOM
-
2026-06-13pricedays on market $149,000 Active 48 DOM
-
2026-06-09days on market $175,000 Active 44 DOM
-
2026-06-08days on market $175,000 Active 43 DOM
-
2026-06-07days on market $175,000 Active 42 DOM
-
2026-06-04days on market $175,000 Active 39 DOM
-
2026-06-03days on market $175,000 Active 38 DOM
-
2026-06-02days on market $175,000 Active 37 DOM
-
2026-06-02days on market $175,000 Active 36 DOM
-
2026-05-31days on market $175,000 Active 35 DOM
-
2026-04-24$175,000 Active 411-char remark
-
2015-06-18soldstatus $9,500
ⓘ Source: listings_history table (triggers on properties + properties_extension) + one-shot
backfill from property_details.listing_events for pre-trigger history.
Tax reassessment forecast TX · Resets to sale price
- Current annual tax
- $1,039 · $87/mo
- Projected year-2 tax
- $2,727 · $227/mo
- Expected delta
- +$1,688/yr (+$141/mo · 162.5%)
ⓘ Screening estimate from a state-policy table — verify with the county assessor before closing.
Climate risk First Street
- Flood 1/10 Low FEMA zone X (unshaded) · 0% chance over 30 yrs
- Wildfire 7/10 Severe
- Heat 7/10 Severe 7 d/yr ≥107°F today · 23 d/yr by 30 yrs out
- Wind 6/10 Major 27% chance of damaging wind over 30 yrs
- Air quality 2/10 Low 1 unhealthy d/yr today · 2 by 30 yrs out
Nearby sold comps map
Loading sold comps map…
Walkable amenities ~0.75 mi
Loading nearby amenities…
Taxation est. · year 1
- Rental income
- $17,561
- − Mortgage interest
- −$8,346
- − Property taxes
- −$1,039
- − Insurance
- −$745
- − Repairs & maintenance
- −$1,405
- − Management
- −$1,405
- − Depreciation
- −$4,335
- Taxable income
- $287
- Est. tax owed @ 24.0%
- −$69
- After-tax cash flow
- $2,644/yr
For passive investors: Depreciation is non-cash, so a rental often shows a tax loss while cash-flowing — sheltering income. Rental losses are passive: they offset passive income freely, and up to $25,000/yr can offset ordinary (W-2) income if you actively participate and your MAGI is under $100k (phasing out to $0 by $150k); unused losses carry forward. On sale, claimed depreciation is recaptured at up to 25%, and gains may owe capital-gains tax (a 1031 exchange can defer both). Figures are a year-1 estimate at your 24.0% rate — not tax advice; consult a CPA.
Schools (NCES district)
- District
- Granbury ISD
- NCES district ID
- 4821390
- Math proficiency
- 46% ▬ 0.00%
- Reading proficiency
- 46% ▲ 4.00%
- Median HH income
- $55,856
- Composite
- 40.04/100
- National rank
- #3820
- State rank
- #237 of 826 in TX
Livability — Weatherford
- Score
- 71/100
- State rank
- #289
- US rank
- #6648
Category grades
Schools grade is shown separately in the Schools card above.
Census & demographics
- City population
- 60,150
- Population (ZIP)
- 3,247
Population outlook (Hood County) Hauer SSP2
- Today (2025)
- 63,502 people
- By 2030
- 67,459 · +6.2%
- By 2040
- 74,958 · +18.0%
- By 2050
- 81,922 · +29.0%
- By 2075
- 98,872 · +55.7%
- By 2100
- 107,796 · +69.8%
Race, ethnicity, and origin ACS 2023
- Neighborhood character
- Predominantly White (72%)
- Race & ethnicity
- White 72% Hispanic / Latino 12% Two or more races 12% Black 11%
- Hispanic origin (detail)
- Mexican 11%
- Common ancestry
- Slovak 6% Lithuanian 6% Iranian 2%
- Foreign-born
- 3% · Canada
- Languages at home
- 93% English-only · Spanish 6%
Political lean MEDSL · Hood
- 2024 margin
- Solid R (+66.0) · D 16.6% · R 82.6%
- 2008→2024 swing
- -11.9pp toward R · 2008: -54.0pp · 2024: -66.0pp
- All cycles
- 2024: R+66.0 2020: R+64.1 2016: R+66.5 2012: R+64.7 2008: R+54.0
Not yet ingested
- Civics
- —
Market trends
- HPI YoY
- ▼ -1.87%
- Current HPI
- 187.0174
- Rent YoY
- —
- Metro
- —
- State GDP YoY
- ▲ 3.95%
- F500 in state
- 110
Industry mix (Fortune 500 HQ in TX)
| Industry | F500 HQs | Revenue |
|---|---|---|
| Energy | 16 | $1,198B |
|
||
| Technology | 5 | $198B |
|
||
| Engineering / Construction | 4 | $72B |
|
||
| Energy Services | 3 | $60B |
|
||
| Utilities | 3 | $41B |
|
||
| Healthcare | 2 | $330B |
|
||
Price history
+1468.4% since first listed3 events — show timeline
- 2026-06-13 Price Changed $149,000 NTREIS
- 2026-04-24 Listed $175,000 NTREIS
- 2015-06-18 Sold (Public Records) $9,500 Public Records
Property tax history
+24.9%/yrLatest (2025): $1,039 · +18.9% YoY. Source: county tax records.
Cash-flow waterfall
monthlySold comps — $/sqft
last 12 mo · ≤1 miLoading sold comps…