12505 Royal #62 · Winter Gardens, CA
Flood risk 1/10 · Minimal
- FEMA flood zone
- X (unshaded)
- Chance of flooding over 30 yrs
- 0.0%
- Est. flood insurance / yr
- $507 – $1,088
Fire risk 5/10 · Moderate
- Est. fire insurance / yr
- $659 – $1,223
Heat risk 5/10 · Moderate
- Hot days now (above 98°F)
- 6 days/yr
- Hot days in 30 yrs
- 16 days/yr
Wind risk 1/10 · Minimal
- Chance of severe wind over 30 yrs
- —
Air-quality risk 4/10 · Minor
- Unhealthy air days now
- 6 days/yr
- Unhealthy air days in 30 yrs
- 7 days/yr
Risk factors via First Street. Map © Google.
Why this score? — see what drove the B+ grade
The composite is a weighted blend of 9 inputs, each scored 0–100. Each bar is that input's sub-score; the figure is the points it added to the 100-point composite (weight × sub-score).
- Cash flow +30.0/30.0
- ARV discount +15.0/15.0
- 1% rule +10.0/10.0
- DSCR +10.0/10.0
- Schools +4.0/10.0
- Livability +3.1/5.0
- Rent growth +2.3/5.0
- Condition / age +2.2/5.0
- Appreciation +0.0/10.0
$149,000
🖨 Deal sheet 📄 Offer letter ✓ Due diligence
Listing remarks
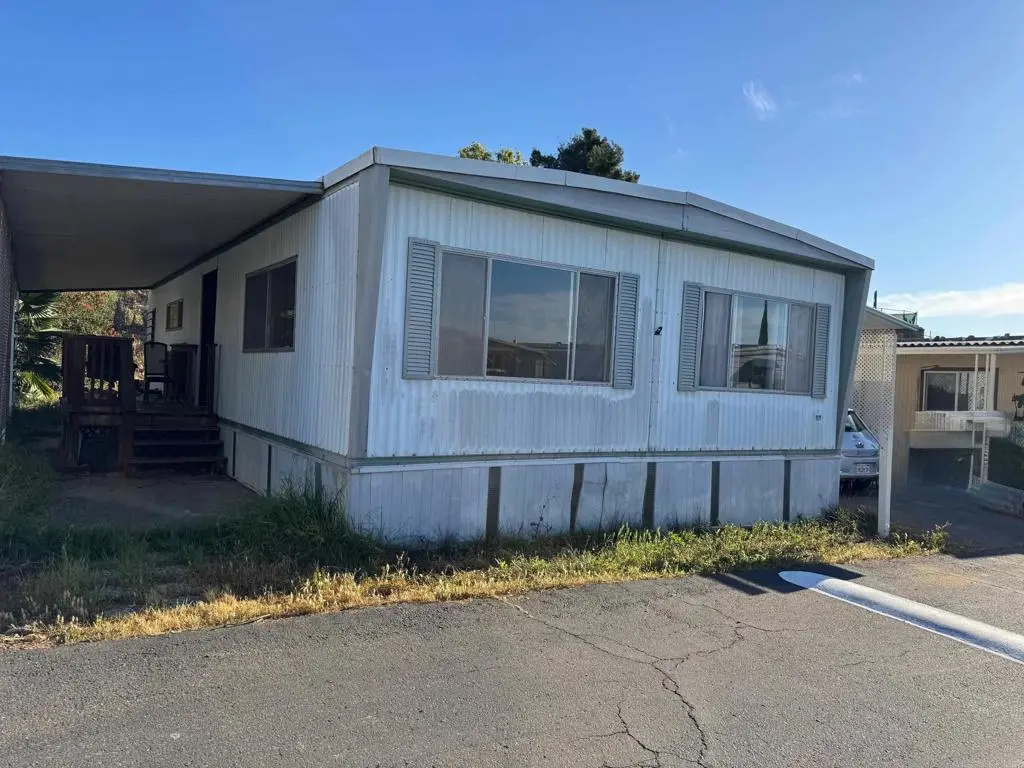
ALL AGE COMMUNITY. Opportunity to create your own vision and customization with this 2-bedroom, 2-bath 1152 esf home built in 1969. The functional layout provides a great starting point for updates and improvements to suit your style. A welcoming front porch leads to the entry, and the home sits on a reasonably sized lot with a private backyard and no rear neighbors, offering added privacy. Elevated and situated toward the back of the community, the location provides a peaceful setting. Royal Estates is an All-age community offering a variety of amenities for comfortable living. Residents enjoy access to a clubhouse, swimming pool, and recreational facilities. The neighborhood features pave
Key facts
- Elevated street
- Private backyard
- Porch entry
Tags
Property features AI
Finance
- Other: Double body type (multi-unit/mobile home classification); Directions: Enter from Royal Road, make right and follow signs to Spc 62 at the top of the park
- Financial info: Assessments: Unknown
- HOA & community: Suburban community; Land lease in place ($1,100 monthly); manager approval required; Park name: Royal Estates; Pets allowed with size and number limits
Exterior
- Parking: 2 parking spaces; 2 carport spaces; Located in Royal Estates park
- Utilities: Public sewer
- Home design: Mobile home (48 ft by 24 ft) — mobile home remains; Single-story
- Construction: Fixer condition
- Exterior features: Porch; Deck; Patio; In-ground pool (fenced, community pool); Back yard; Yard; Level with street; Has view; One shed on property
Interior
- Kitchen: Kitchen
- Bedrooms: Primary bedroom on main level
- Bathrooms: 2 full bathrooms
- Interior features: One level home; Living room entry; Primary bedroom
- Laundry & utility: Inside laundry; Washer hookup; Electric dryer hookup; Gas and electric dryer hookup
Neighborhood map
What this means for you Summary
Snapshot
- This is a 2-bed/2.0-bath manufactured listed at $149k. Condition is rated fair.
Deal economics
- At list price, monthly cash flow is $1k ($13k/yr) — positive.
- The deal already cash-flows at list — no discount required.
- Meets the 1% rule at list price ($3k rent vs $149k).
- Recommended offer: $140k (6.0% below list) — sets the bar for market timing.
- Cap rate 15.1% vs local median 2.7% in Winter Gardens — top-decile yield for the area; either an underpriced asset or a hidden risk that comps aren't pricing in. Stress-test before assuming the spread holds.
Location & tenants
- Location reads 61/100 on livability (#515 in CA) — a middle-class / working-renter tenant base. Strengths: commute A+, employment A-, housing A-; Watch: schools C-, crime D-, amenities F.
- Grossmont Union High (suburban): math 31% / reading 60% proficiency, ranked #173 of 517 in CA (top 34%) — families likely to look elsewhere, expect single-tenant / working-renter base with shorter leases; only 17% free/reduced lunch — higher-income household profile.
- Market conditions: Rents soft (-0.8%/yr); 238 active listings in the ZIP; 20 comparable units currently listed for rent nearby; rentals leasing fast (median 2d on market — plan ~1-2 weeks tenant-placement turnaround); 11,759 units permitted in San Diego County in 2024 (7,244 in 5+ unit buildings).
- This rent runs 44% of the median local income ($74k/yr) — at the standard rent-burdened threshold; future hikes will face affordability resistance.
Forward outlook
- Local home prices are declining (-3.0%/yr); year-one equity from $1k of loan paydown is wiped out by about $4k of value loss. Plan a longer hold.
- San Diego County population projected at +20% by 2050 — long-run rental-demand tailwind backs the buy-and-hold thesis.
- At projected returns (-3.0% appreciation + 0.0% rent growth), your $42k cash investment doubles in ~5 years — after that, you're playing with house money.
Negotiation context
- It's been on market 69 days — a 6% lower offer ($140k) is reasonable based on typical stale-listing flexibility.
Risks & watch-outs
- Climate carrying-cost: moderate wildfire risk; extreme-heat days projected 6→16/yr by 2055 (HVAC capex compounding) — expect insurance premiums to compound above CPI over the hold.
Questions for the listing agent
- It's been on market 69 days. Have you received any prior offers? Is the seller open to a 6% concession, seller financing, or rate buy-down credit?
- Have any recent inspections been done? Can we get a copy of the seller's disclosures and any deferred-maintenance estimates?
- Built in 1969 — when were the roof, HVAC, electrical panel, plumbing, and water heater last replaced?
- Why hasn't it sold? Are there any deal-killer items the seller is aware of (foundation, flood, title, zoning, code violations)?
- Is there a deadline driving the sale (1031 exchange, divorce, estate, relocation)? That informs how much negotiation room exists.
- Crime grade is D in this area — have there been break-ins, vandalism, or insurance claims at this property in the last 3 years? What carrier currently insures it and at what premium?
- What's the average days-on-market for RENTAL listings here right now (not sales)? A rising rental-DOM trend means longer vacancies and softer asking-rent achievability than the comps imply.
- What's the recent tenant-quality profile in this submarket — average credit score on applications, eviction rate, late-payment / NSF rate, and stable-employment percentage? A property-management company in the area should have these aggregated.
- How much new for-sale + rental construction is in the pipeline within 1–3 miles? Heavy new supply typically softens prices + rents 12–24 months out; constrained supply supports both.
Investment metrics
- 1% rule
- 1.80% ✓
- Cap rate
- 15.10%
- Cash-on-cash
- 31.47%
- DSCR
- 2.40
- GRM
- 4.6
CMA / ARV
- ARV (on-the-fly)
- $185,472
- Comps found
- 12
Show comp detail 12 sales within ~0.75 mi
| Address | Dist | Beds/Ba | Sqft | Sold | Price | $/sf | Match |
|---|---|---|---|---|---|---|---|
| 1351 Pepper Dr #18 | 0.45mi | 2/2.0 | 1,140 (-1%) | 3mo | $184,000 | $161 | 75 |
| 1351 Pepper Dr #26 | 0.45mi | 2/2.0 | 1,200 (+4%) | 10mo | $160,000 | $133 | 64 |
| 1351 Pepper Dr Spc 62 | 0.45mi | 2/2.0 | 1,056 (-8%) | 2mo | $226,900 | $215 | 63 |
| 12250 Vista Del Cajon Rd Spc 25 | 0.43mi | 2/2.0 | 1,275 (+11%) | 1mo | $235,000 | $184 | 62 |
| 1315 Pepper Dr #72 | 0.51mi | 2/2.0 | 1,220 (+6%) | 10mo | $194,000 | $159 | 58 |
| 12250 Vista Del Cajon Rd #17 | 0.39mi | 3/2.0 (+1) | 1,248 (+8%) | 14mo | $275,000 | $220 | 51 |
| 12970 Highway 8 Business #104 | 0.63mi | 3/2.0 (+1) | 1,190 (+3%) | 13mo | $150,000 | $126 | 50 |
| 12250 Vista Del Cajon Rd Spc 45 | 0.43mi | 3/2.0 (+1) | 1,248 (+8%) | 14mo | $183,000 | $147 | 49 |
| 1351 Pepper Dr Spc 40 | 0.45mi | 2/2.0 | 1,056 (-8%) | 20mo | $171,000 | $162 | 49 |
| 12044 Royal Rd #63 | 0.45mi | 3/2.0 (+1) | 1,000 (-13%) | 5mo | $257,321 | $257 | 48 |
| 12970 Highway 8 Business #35 | 0.56mi | 2/2.0 | 1,040 (-10%) | 16mo | $125,000 | $120 | 44 |
| 1315 Pepper Dr #47 | 0.51mi | 2/2.0 | 1,248 (+8%) | 22mo | $175,000 | $140 | 44 |
Match score weights: distance 35% · size 25% · config 20% · recency 20%. Top-matched comps best support the ARV.
Projected returns pro-forma
-3.0% appreciation · 0.0% rent growth · sell at horizon
- IRR
- 22.9%
- Equity multiple
- 1.90×
- Total profit
- $37,696
- Equity at exit
- $22,216
- IRR
- 28.9%
- Equity multiple
- 3.21×
- Total profit
- $92,266
- Equity at exit
- $12,883
Cash invested: $41,720 (down + closing). Projections, not guarantees.
Landlord ↔ Tenant lean methodology
- Overall (STATE)
- 18 Strongly Tenant-Friendly
- State California
- 18 Strongly Tenant-Friendly · D+13
- County
- — inherits STATE
- City
- — inherits STATE
ZIP-level market 92021
- Rents YoY
- -0.8%
- Active inventory
- 238
- Price-to-rent
- 4.6×
Monthly cashflow live
- Estimated rent
- $2,688 high interval (Pro) →
- Mortgage (P&I)
- −$781
- Tax est. 1.5%
- −$186 /mo · $2,235/yr
- Insurance
- −$62
- HOA
- −$0
- Vacancy / Maint / Mgmt
- −$565
- Net cashflow
- $1,094
Break-even live
UW: 25.0% down · 7.5% · 30yr · 1.5% tax · 5.0% vac · 8.0% maint · 8.0% mgmt
Financing live
Cash to close
- Down payment
- $37,250
- Closing costs
- $4,470
- Reserves months
- —
- Total cash needed
- —
Loan-product check · same deal, 3 products live
Conventional
25% down · 7.5% · 30yr
- Down + closing
- —
- Monthly P&I
- —
- Monthly cashflow
- —
- DSCR
- —
- Eligible?
- —
Personal DTI + credit; lowest rate.
DSCR
20% down · 8.5% · 30yr
- Down + closing
- —
- Monthly P&I
- —
- Monthly cashflow
- —
- DSCR
- —
- Eligible?
- —
No personal income docs; deal must DSCR.
Hard money
10% down · 12.0% · 12mo
- Down + closing
- —
- Monthly P&I
- —
- Monthly cashflow
- —
- DSCR
- —
- Eligible?
- —
Short-term bridge; refi at stabilization.
Rent comps 20 comps
| Address | Beds | Baths | Sqft | Rent | $/sqft | DOM | Units | Dist |
|---|---|---|---|---|---|---|---|---|
| 8031 Winter Gardens Blvd El Cajon, CA | 3.0 | 2.0 | 1124 | $2,995 | $2.66 | 1d | 1 | 0.48mi |
| 1651 Braddon Way Unit B El Cajon, CA | 1.0 | 2.0 | 800 | $2,000 | $2.50 | 1d | 1 | 0.55mi |
| 2000 E Main St El Cajon, CA | 3.0 | 1.5–2.5 | 1165 | $3,300 | $2.83 | 1d | 1 | 0.62mi |
| 12171 Winter Gardens Dr Lakeside, CA | 2.0 | 1.0 | 862 | $2,500 | $2.90 | 1d | 1 | 0.64mi |
| 8424 Pueblo Rd Unit 8424 Lakeside, CA | 3.0 | 1.0 | 1000 | $2,750 | $2.75 | 1d | 1 | 0.68mi |
| 1365 Broadway El Cajon, CA | 3.0 | 2.0 | 1000 | $3,478 | $3.48 | 1d | 1 | 1.05mi |
| 1221 Oro St El Cajon, CA | 2.0 | 1.5 | 1020 | $2,575 | $2.52 | 1d | 1 | 1.07mi |
| 1520 Oakdale Ave Apt 3 El Cajon, CA | 2.0 | 1.0 | 840 | $2,125 | $2.53 | 7d | 1 | 1.28mi |
| 8410 Los Coches Rd El Cajon, CA | 2.0 | 2.0 | 900 | $2,239 | $2.49 | 1d | 1 | 1.28mi |
| 1512 Oakdale Ave Unit 1512-2 El Cajon, CA | 2.0 | 1.0 | 805 | $1,925 | $2.39 | 1d | 1 | 1.28mi |
| 1430 Diamond Ln El Cajon, CA | 2.0 | 1.0 | 863 | $2,695 | $3.12 | 2d | 1 | 1.35mi |
| 1314 5 D Dr Unit 1318 El Cajon, CA | 3.0 | 1.0 | 960 | $2,600 | $2.71 | 23d | 1 | 1.35mi |
| 1696 Buckeye Dr El Cajon, CA | 3.0 | 1.0 | 942 | $2,900 | $3.08 | 2d | 1 | 1.38mi |
| 816 Oro St El Cajon, CA | 3.0 | 1.0 | 1235 | $3,400 | $2.75 | 2d | 1 | 1.38mi |
| 1377 Oakdale Ave Unit 03 El Cajon, CA | 2.0 | 2.0 | 900 | $2,425 | $2.69 | 1d | 1 | 1.39mi |
| 1343 Oakdale Ave El Cajon, CA | 1.0–2.0 | 1.0–2.0 | 800 | $2,195 | $2.74 | 1d | 1 | 1.42mi |
| 1171 Marline Ave Unit 1171-A El Cajon, CA | 3.0 | 1.5 | 1141 | $3,100 | $2.72 | 1d | 1 | 1.46mi |
| 500 Grape St El Cajon, CA | 2.0 | 1.0 | 900 | $2,150 | $2.39 | 1d | 1 | 1.47mi |
| 9092 Los Coches Rd Lakeside, CA | 3.0 | 2.5 | 1300 | $4,000 | $3.08 | 2d | 1 | 1.49mi |
| 9094 Los Coches Rd Lakeside, CA | 3.0 | 2.5 | 1200 | $4,000 | $3.33 | 1d | 1 | 1.49mi |
Listing history 16 events
-
2026-06-18days on market $149,000 Active 69 DOM
-
2026-06-17days on market $149,000 Active 68 DOM
-
2026-06-16days on market $149,000 Active 67 DOM
-
2026-06-15days on market $149,000 Active 66 DOM
-
2026-06-13days on market $149,000 Active 64 DOM
-
2026-06-13days on market $149,000 Active 63 DOM
-
2026-06-09days on market $149,000 Active 60 DOM
-
2026-06-08days on market $149,000 Active 59 DOM
-
2026-06-07days on market $149,000 Active 58 DOM
-
2026-06-04days on market $149,000 Active 55 DOM
-
2026-06-03days on market $149,000 Active 54 DOM
-
2026-06-02days on market $149,000 Active 53 DOM
-
2026-06-01days on market $149,000 Active 52 DOM
-
2026-05-31days on market $149,000 Active 51 DOM
-
2026-05-16price $149,000
-
2026-04-08$199,000 Active
ⓘ Source: listings_history table (triggers on properties + properties_extension) + one-shot
backfill from property_details.listing_events for pre-trigger history.
Climate risk First Street
- Flood 1/10 Low FEMA zone X (unshaded) · 0% chance over 30 yrs
- Wildfire 5/10 Major
- Heat 5/10 Major 6 d/yr ≥98°F today · 16 d/yr by 30 yrs out
- Wind 1/10 Low
- Air quality 4/10 Moderate 6 unhealthy d/yr today · 7 by 30 yrs out
Nearby sold comps map
Loading sold comps map…
Walkable amenities ~0.75 mi
Loading nearby amenities…
Taxation est. · year 1
- Rental income
- $32,259
- − Mortgage interest
- −$8,346
- − Property taxes
- −$2,235
- − Insurance
- −$745
- − Repairs & maintenance
- −$2,581
- − Management
- −$2,581
- − Depreciation
- −$4,335
- Taxable income
- $11,437
- Est. tax owed @ 24.0%
- −$2,745
- After-tax cash flow
- $10,383/yr
For passive investors: Depreciation is non-cash, so a rental often shows a tax loss while cash-flowing — sheltering income. Rental losses are passive: they offset passive income freely, and up to $25,000/yr can offset ordinary (W-2) income if you actively participate and your MAGI is under $100k (phasing out to $0 by $150k); unused losses carry forward. On sale, claimed depreciation is recaptured at up to 25%, and gains may owe capital-gains tax (a 1031 exchange can defer both). Figures are a year-1 estimate at your 24.0% rate — not tax advice; consult a CPA.
Condition & rehab AI · 4 photos
This manufactured home requires moderate rehabilitation, focusing on exterior siding, roof, flooring, and interior paint. Landscaping and maintenance are also needed. Updates such as painting, new flooring, and roof replacement would significantly increase its resale and rental value.
Repairs flagged
- Major exterior siding — Significant wear and tear
- Moderate roof — Aged metal roof
- Major flooring — Worn carpet
- Major interior walls/paint — Painted walls show wear
Value-add opportunities
- Both Painting and repainting — Enhances curb appeal and interior aesthetics
- Both Landscaping — Improves curb appeal and adds value
- Both New flooring — Enhances interior aesthetics and adds value
- Both Roof replacement — Improves structural integrity and adds value
Renovation cost estimate screening
| Repair item | Severity | Est. cost |
|---|---|---|
| exterior siding · Significant wear and tear | Major | $15,000–50,000 |
| roof · Aged metal roof | Moderate | $3,000–15,000 |
| flooring · Worn carpet | Major | $15,000–50,000 |
| interior walls/paint · Painted walls show wear | Major | $15,000–50,000 |
| Total estimated repair cost · 4 items | $48,000–165,000 |
Value-add ROI direction
- Both Painting and repainting — Enhances curb appeal and interior aesthetics ↑
- Both Landscaping — Improves curb appeal and adds value ↑
- Both New flooring — Enhances interior aesthetics and adds value ↑
- Both Roof replacement — Improves structural integrity and adds value ↑
ⓘ Cost ranges are severity-bucket heuristics (US national rule-of-thumb). Get contractor quotes + a written scope before underwriting a rehab budget.
Schools (NCES district)
- District
- Grossmont Union High
- NCES district ID
- 0616230
- Math proficiency
- 31% ▼ -1.00%
- Reading proficiency
- 60% ▲ 5.00%
- Median HH income
- $61,801
- Composite
- 40.07/100
- National rank
- #3810
- State rank
- #173 of 517 in CA
Livability — Winter Gardens
- Score
- 61/100
- State rank
- #515
- US rank
- #17448
Category grades
Schools grade is shown separately in the Schools card above.
Census & demographics
- Census place
- Winter Gardens, CA
- County
- San Diego County · 3,178,799 people
- Metro
- San Diego-Chula Vista-Carlsbad, CA
- Population (ZIP)
- 70,501
- Household income
- $74,013
- Rent vs Own
- Severe rent burden
- 4178.0
Population outlook (San Diego County) Hauer SSP2
- Today (2025)
- 3,678,185 people
- By 2030
- 3,856,546 · +4.8%
- By 2040
- 4,171,407 · +13.4%
- By 2050
- 4,421,607 · +20.2%
- By 2075
- 4,831,599 · +31.4%
- By 2100
- 4,832,502 · +31.4%
Race, ethnicity, and origin ACS 2023
- Neighborhood character
- Diverse neighborhood (Simpson 0.62)
- Race & ethnicity
- White 54% Hispanic / Latino 28% Two or more races 14% Black 6% Asian 5% Native American 2%
- Hispanic origin (detail)
- Mexican 24%
- Common ancestry
- Arab 6% Italian 2% Lithuanian 2%
- Foreign-born
- 22% · Canada
- Languages at home
- 65% English-only · Spanish 18% Arabic 7% Other Indo-European 3%
Political lean MEDSL · San Diego
- 2024 margin
- D (+16.8) · D 56.9% · R 40.1% · Other 2.9%
- 2008→2024 swing
- +6.6pp toward D · 2008: 10.2pp · 2024: 16.8pp
- All cycles
- 2024: D+16.8 2020: D+22.8 2016: D+17.8 2012: D+5.1 2008: D+10.2
Not yet ingested
- Civics
- —
Market trends
- HPI YoY
- ▼ -654.88%
- Current HPI
- 335.0617
- Rent YoY
- ▼ -0.83%
- Metro
- San Diego-Chula Vista-Carlsbad, CA
- State GDP YoY
- ▲ 3.21%
- F500 in state
- 116
Industry mix (Fortune 500 HQ in CA)
| Industry | F500 HQs | Revenue |
|---|---|---|
| Technology | 27 | $1,492B |
|
||
| Financial Services | 3 | $174B |
|
||
| Retail | 3 | $44B |
|
||
| Insurance | 3 | $26B |
|
||
| Media / Entertainment | 2 | $115B |
|
||
| Pharmaceuticals / Biotech | 2 | $62B |
|
||
Price history
-25.1% since first listed2 events — show timeline
- 2026-05-16 Price Changed $149,000 CRMLS
- 2026-04-08 Listed $199,000 CRMLS
Cash-flow waterfall
monthlySold comps — $/sqft
last 12 mo · ≤1 miLoading sold comps…