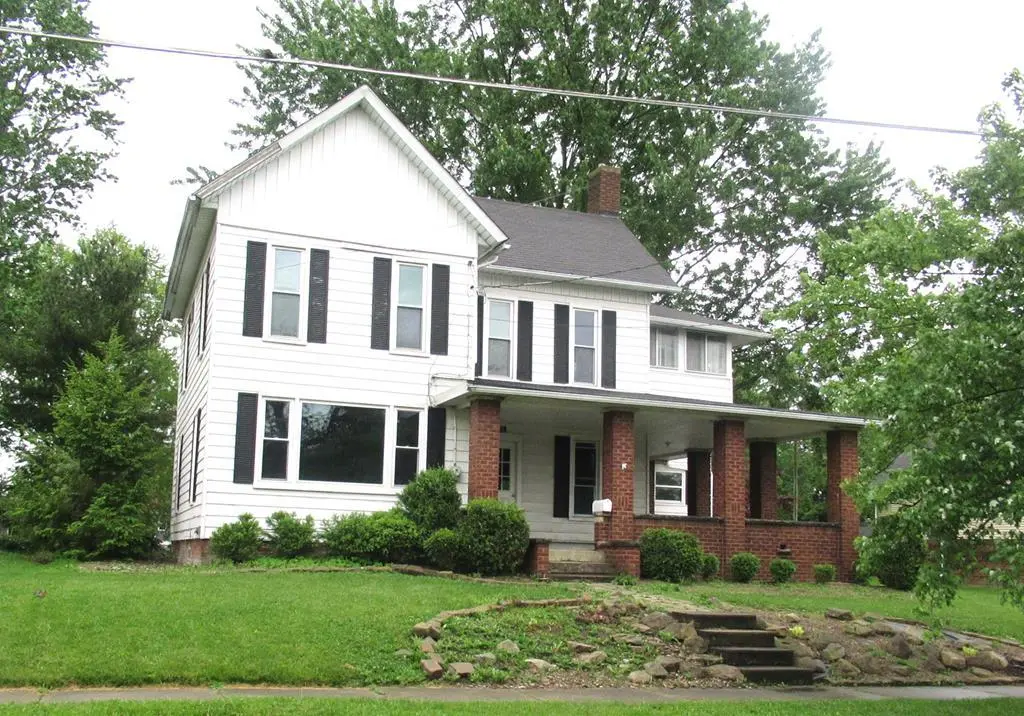
83 N Main St · West Salem, OH
Flood risk 1/10 · Minimal
- FEMA flood zone
- X (unshaded)
- Chance of flooding over 30 yrs
- 0.0%
- Est. flood insurance / yr
- $473 – $860
Fire risk 1/10 · Minimal
- Est. fire insurance / yr
- $713 – $1,323
Heat risk 3/10 · Minor
- Hot days now (above 98°F)
- 7 days/yr
- Hot days in 30 yrs
- 16 days/yr
Wind risk 2/10 · Minimal
- Chance of severe wind over 30 yrs
- —
Air-quality risk 2/10 · Minimal
- Unhealthy air days now
- 1 days/yr
- Unhealthy air days in 30 yrs
- 1 days/yr
Risk factors via First Street. Map © Google.
Why this score? — see what drove the B- grade
The composite is a weighted blend of 9 inputs, each scored 0–100. Each bar is that input's sub-score; the figure is the points it added to the 100-point composite (weight × sub-score).
- Cash flow +23.0/30.0
- Appreciation +10.0/10.0
- ARV discount +7.5/15.0
- DSCR +7.4/10.0
- 1% rule +6.3/10.0
- Schools +5.6/10.0
- Livability +3.4/5.0
- Rent growth +2.5/5.0
- Condition / age +2.5/5.0
$102,500
🖨 Deal sheet 📄 Offer letter ✓ Due diligence
Listing remarks MLS
The perfect balance of modern updates and classic 18th century character. Located in the heart of West Salem. Make this 4 bedroom (potential 3 bedroom, 1 office), 2 full bath house with almost 10 foot ceilings and a wrap around porch, yours! Don't miss out.
Key facts
- Built 1884
- Listed 17 days
Property features AI
Exterior
- Parking: Gravel parking
- Utilities: Public water; Public sewer
- Home design: Single family residence; Residential property
- Construction: Aluminum siding; Brick exterior; Vinyl siding
- Exterior features: Composition roof
Interior
- Kitchen: Refrigerator; Range
- Bathrooms: 2 full bathrooms
- Heating & cooling: Forced air heating; Gravity heating; Natural gas heating
- Interior features: Refrigerator; Range; Full basement
Neighborhood map
What this means for you Summary
Snapshot
- This is a 3-bed/1.5-bath single-family listed at $102k.
Deal economics
- At list price, monthly cash flow is $183 ($2k/yr) — positive.
- The deal already cash-flows at list — no discount required.
- Meets the 1% rule at list price ($1k rent vs $102k).
- Recommended offer: $101k (1.5% below list) — sets the bar for market timing.
Location & tenants
- Location reads 67/100 on livability (#611 in OH) — a middle-class / working-renter tenant base. Strengths: crime A+, cost of living A+, housing A+; Watch: amenities F, commute F, health & safety F.
- Northwestern Local (rural): math 60% / reading 70% proficiency, ranked #206 of 656 in OH (top 31%) — acceptable for families but not a draw, mixed tenant base, ~2y average lease.
- Market conditions: 59 active listings in the ZIP; 284 units permitted in Wayne County in 2024 (42 in 5+ unit buildings).
Forward outlook
- In year one you build about $11k of equity ($709 loan paydown + $10k appreciation (10.0% local appreciation)).
- Wayne County population projected to shrink 6% by 2050 — rents likely to lag national; underwrite the cash flow, not the appreciation.
- At projected returns (10.0% appreciation + 3.0% rent growth), your $29k cash investment doubles in ~3 years — after that, you're playing with house money.
- By year 4, paydown + projected appreciation supports a ~$39k cash-out refi (75% LTV) — recoverable capital for the next deal without selling this one.
Negotiation context
- It's been on market 17 days — a 2% lower offer ($101k) is reasonable based on typical stale-listing flexibility.
- 6 sale attempts since 9y ago with the ask held roughly flat each time — persistent listings suggest the price (not the market) is what's stuck; bring a comps-based counter.
Risks & watch-outs
- Watch-outs: built in 1884 — expect roof / HVAC / electrical / plumbing capex.
Questions for the listing agent
- Built in 1884 — when were the roof, HVAC, electrical panel, plumbing, and water heater last replaced?
- Is there a deadline driving the sale (1031 exchange, divorce, estate, relocation)? That informs how much negotiation room exists.
- What's the average days-on-market for RENTAL listings here right now (not sales)? A rising rental-DOM trend means longer vacancies and softer asking-rent achievability than the comps imply.
- What's the recent tenant-quality profile in this submarket — average credit score on applications, eviction rate, late-payment / NSF rate, and stable-employment percentage? A property-management company in the area should have these aggregated.
- How much new for-sale + rental construction is in the pipeline within 1–3 miles? Heavy new supply typically softens prices + rents 12–24 months out; constrained supply supports both.
Investment metrics
- 1% rule
- 1.13% ✓
- Cap rate
- 8.43%
- Cash-on-cash
- 7.63%
- DSCR
- 1.34
- GRM
- 7.4
CMA / ARV
No comps found within radius.
Projected returns pro-forma
10.0% appreciation · 3.0% rent growth · sell at horizon
- IRR
- 29.8%
- Equity multiple
- 3.35×
- Total profit
- $67,482
- Equity at exit
- $92,340
- IRR
- 25.9%
- Equity multiple
- 7.61×
- Total profit
- $189,651
- Equity at exit
- $199,135
Cash invested: $28,700 (down + closing). Projections, not guarantees.
Landlord ↔ Tenant lean methodology
- Overall (STATE)
- 73 Landlord-Friendly
- State Ohio
- 73 Landlord-Friendly · R+6
- County
- — inherits STATE
- City
- — inherits STATE
ZIP-level market 44287
- Home prices YoY
- 6.5%
- Active inventory
- 59
- Price-to-rent
- 7.4×
Monthly cashflow live
- Estimated rent
- $1,161 medium interval (Pro) →
- Mortgage (P&I)
- −$538
- Tax from tax record
- −$155 /mo · $1,858/yr
- Insurance
- −$43
- HOA
- −$0
- Vacancy / Maint / Mgmt
- −$244
- Net cashflow
- $183
Break-even live
UW: 25.0% down · 7.5% · 30yr · 1.5% tax · 5.0% vac · 8.0% maint · 8.0% mgmt
Financing live
Cash to close
- Down payment
- $25,625
- Closing costs
- $3,075
- Reserves months
- —
- Total cash needed
- —
Loan-product check · same deal, 3 products live
Conventional
25% down · 7.5% · 30yr
- Down + closing
- —
- Monthly P&I
- —
- Monthly cashflow
- —
- DSCR
- —
- Eligible?
- —
Personal DTI + credit; lowest rate.
DSCR
20% down · 8.5% · 30yr
- Down + closing
- —
- Monthly P&I
- —
- Monthly cashflow
- —
- DSCR
- —
- Eligible?
- —
No personal income docs; deal must DSCR.
Hard money
10% down · 12.0% · 12mo
- Down + closing
- —
- Monthly P&I
- —
- Monthly cashflow
- —
- DSCR
- —
- Eligible?
- —
Short-term bridge; refi at stabilization.
Listing history 14 events
-
2026-06-17status $102,500 Pending 17 DOM
-
2026-06-16days on market $102,500 Active 17 DOM
-
2026-06-15days on market $102,500 Active 16 DOM
-
2026-06-13days on market $102,500 Active 14 DOM
-
2026-06-12statusdays on market $102,500 Active 13 DOM
-
2026-06-09days on market $102,500 Active Under Contract 10 DOM
-
2026-06-08days on market $102,500 Active Under Contract 9 DOM
-
2026-06-08days on market $102,500 Active Under Contract 8 DOM
-
2026-06-05days on market $102,500 Active Under Contract 6 DOM
-
2026-06-04statusdays on market $102,500 Active Under Contract 4 DOM
-
2026-06-02days on market $102,500 Active 3 DOM
-
2026-06-01days on market $102,500 Active 2 DOM
-
2026-05-31remarks 293-char remark
-
2026-05-31$102,500 Active 1 DOM
ⓘ Source: listings_history table (triggers on properties + properties_extension) + one-shot
backfill from property_details.listing_events for pre-trigger history.
Tax reassessment forecast OH · Partial reset (capped growth)
- Current annual tax
- $1,858 · $155/mo
- Projected year-2 tax
- $1,858 · $155/mo
- Expected delta
- $0/yr ($0/mo · 0.0%)
ⓘ Screening estimate from a state-policy table — verify with the county assessor before closing.
Climate risk First Street
- Flood 1/10 Low FEMA zone X (unshaded) · 0% chance over 30 yrs
- Wildfire 1/10 Low
- Heat 3/10 Moderate 7 d/yr ≥98°F today · 16 d/yr by 30 yrs out
- Wind 2/10 Low
- Air quality 2/10 Low 1 unhealthy d/yr today · 1 by 30 yrs out
Nearby sold comps map
Loading sold comps map…
Walkable amenities ~0.75 mi
Loading nearby amenities…
Taxation est. · year 1
- Rental income
- $13,938
- − Mortgage interest
- −$5,742
- − Property taxes
- −$1,858
- − Insurance
- −$512
- − Repairs & maintenance
- −$1,115
- − Management
- −$1,115
- − Depreciation
- −$2,982
- Taxable income
- $614
- Est. tax owed @ 24.0%
- −$147
- After-tax cash flow
- $2,043/yr
For passive investors: Depreciation is non-cash, so a rental often shows a tax loss while cash-flowing — sheltering income. Rental losses are passive: they offset passive income freely, and up to $25,000/yr can offset ordinary (W-2) income if you actively participate and your MAGI is under $100k (phasing out to $0 by $150k); unused losses carry forward. On sale, claimed depreciation is recaptured at up to 25%, and gains may owe capital-gains tax (a 1031 exchange can defer both). Figures are a year-1 estimate at your 24.0% rate — not tax advice; consult a CPA.
Schools (NCES district)
- District
- Northwestern Local
- NCES district ID
- 3910033
- Math proficiency
- 60% ▼ -8.00%
- Reading proficiency
- 70% ▬ 0.00%
- Median HH income
- $54,164
- Composite
- 55.58/100
- National rank
- #1236
- State rank
- #206 of 656 in OH
Livability — West Salem
- Score
- 67/100
- State rank
- #611
- US rank
- #10537
Category grades
Schools grade is shown separately in the Schools card above.
Census & demographics
- Census place
- West Salem, OH
- County
- Wayne · 117,095 people
- Population (ZIP)
- 7,892
- Household income
- $71,146
- Rent vs Own
- Severe rent burden
- 6.1
Population outlook (Wayne County) Hauer SSP2
- Today (2025)
- 116,616 people
- By 2030
- 116,214 · -0.3%
- By 2040
- 113,891 · -2.3%
- By 2050
- 109,009 · -6.5%
- By 2075
- 94,622 · -18.9%
- By 2100
- 70,577 · -39.5%
Race, ethnicity, and origin ACS 2023
- Neighborhood character
- Predominantly White (97%)
- Race & ethnicity
- White 97% Two or more races 2% Hispanic / Latino 2%
- Common ancestry
- Iranian 7% Romanian 5% Subsaharan African 3%
- Foreign-born
- 4% · Canada
- Languages at home
- 89% English-only · German/W. Germanic 9% Other Indo-European 2%
Political lean MEDSL · Wayne
- 2024 margin
- Solid R (+39.3) · D 29.9% · R 69.2%
- 2008→2024 swing
- -24.6pp toward R · 2008: -14.6pp · 2024: -39.3pp
- All cycles
- 2024: R+39.3 2020: R+37.0 2016: R+34.9 2012: R+21.3 2008: R+14.6
Not yet ingested
- Civics
- —
Market trends
- HPI YoY
- ▲ 25.98%
- Current HPI
- 426.21
- Rent YoY
- —
- Metro
- —
- State GDP YoY
- ▲ 1.98%
- F500 in state
- 48
Industry mix (Fortune 500 HQ in OH)
| Industry | F500 HQs | Revenue |
|---|---|---|
| Insurance | 3 | $145B |
|
||
| Industrial Machinery | 3 | $49B |
|
||
| Financial Services | 3 | $24B |
|
||
| Consumer Goods | 2 | $93B |
|
||
| Aerospace / Defense | 2 | $47B |
|
||
| Utilities | 2 | $33B |
|
||
Price history
+83.0% since first listed21 events — show timeline
- 2026-05-30 Listed $102,500 MARMLS
- 2018-01-31 Sold (Public Records) $117,000 Public Records
- 2018-01-30 Sold (MLS) $117,000 MLSNOW
- 2018-01-05 Pending — MLSNOW
- 2018-01-05 Listing Removed — MLSNOW
- 2018-01-02 Contingent — MLSNOW
- 2018-01-02 Relisted — MLSNOW
- 2018-01-01 Listing Removed — MLSNOW
- 2017-12-08 Contingent — MLSNOW
- 2017-11-15 Price Changed $119,900 MLSNOW
- 2017-09-22 Listed $125,000 MLSNOW
- 2017-07-17 Sold (MLS) $24,900 ABOR
- 2017-07-17 Sold (MLS) $24,900 MARMLS
- 2017-07-17 Sold (MLS) $29,400 MLSNOW
- 2017-06-01 Pending — MLSNOW
- 2017-05-04 Listed $32,500 MARMLS
- 2017-05-03 Listed $32,500 MLSNOW
- 2017-05-01 Listed $32,500 ABOR
- 1998-10-14 Sold (Public Records) $72,000 Public Records
- 1994-03-09 Sold (Public Records) $56,900 Public Records
- 1992-05-22 Sold (Public Records) $56,000 Public Records
Property tax history
+4.2%/yrLatest (2025): $1,858 · -1.6% YoY. Source: county tax records.
Cash-flow waterfall
monthlySold comps — $/sqft
last 12 mo · ≤1 miLoading sold comps…