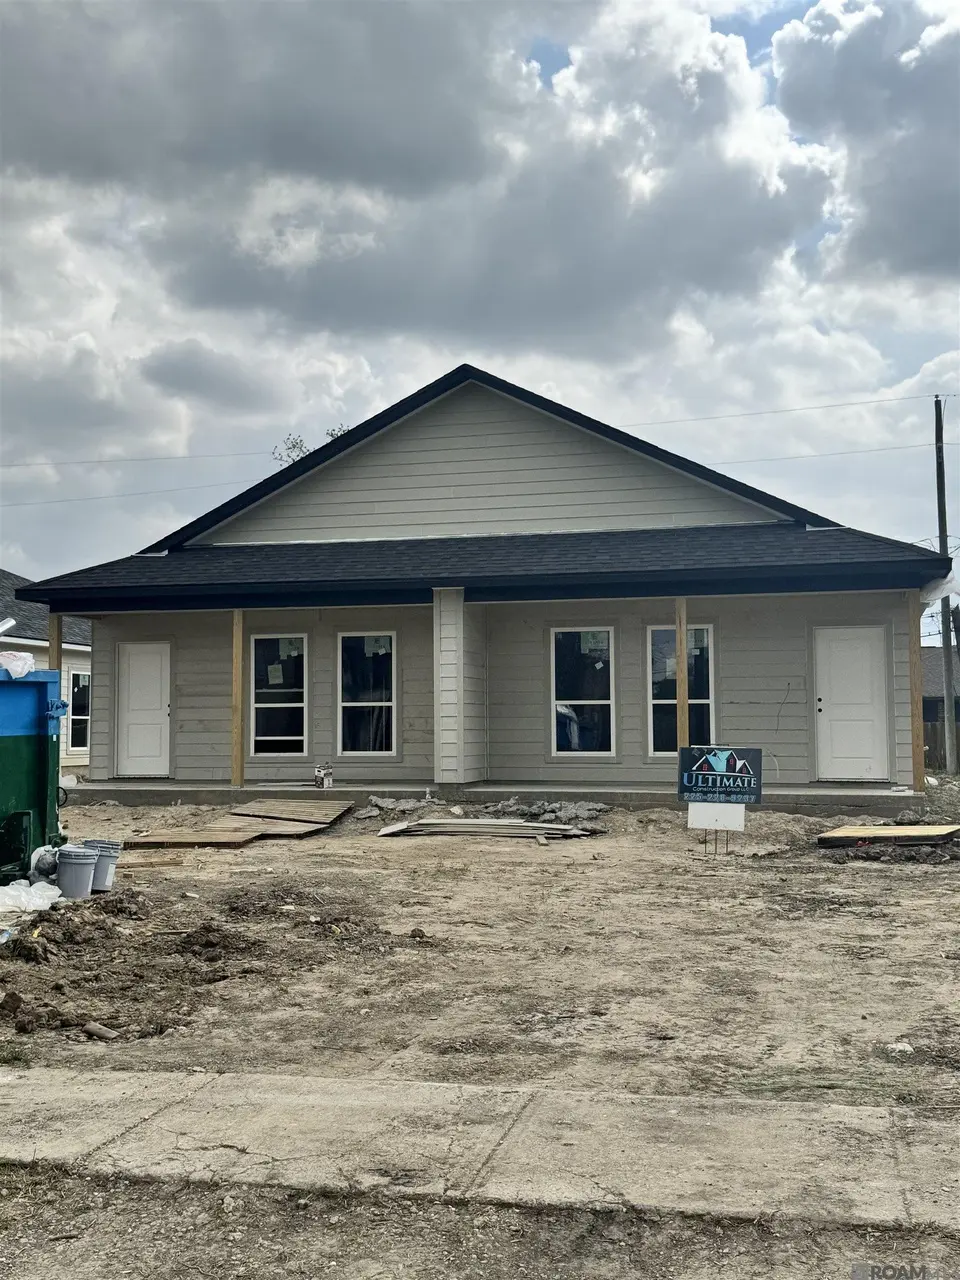
8030-8032 Ned Ave · Gardere, LA
Flood risk 6/10 · Moderate
- FEMA flood zone
- X
- Chance of flooding over 30 yrs
- 0.68%
- Est. flood insurance / yr
- $507 – $1,088
Fire risk 1/10 · Minimal
- Est. fire insurance / yr
- $1,269 – $2,357
Heat risk 8/10 · Major
- Hot days now (above 108°F)
- 7 days/yr
- Hot days in 30 yrs
- 21 days/yr
Wind risk 9/10 · Severe
- Chance of severe wind over 30 yrs
- 99.0%
Air-quality risk 3/10 · Minor
- Unhealthy air days now
- 3 days/yr
- Unhealthy air days in 30 yrs
- 3 days/yr
Risk factors via First Street. Map © Google.
Why this score? — see what drove the D- grade
The composite is a weighted blend of 9 inputs, each scored 0–100. Each bar is that input's sub-score; the figure is the points it added to the 100-point composite (weight × sub-score).
- Cash flow +11.5/30.0
- ARV discount +7.5/15.0
- DSCR +3.4/10.0
- 1% rule +3.3/10.0
- Rent growth +3.2/5.0
- Livability +3.2/5.0
- Condition / age +2.5/5.0
- Schools +2.4/10.0
- Appreciation +0.0/10.0
$299,900
🖨 Deal sheet (PDF) 📄 Offer letter ✓ Due diligence
Listing remarks MLS
New construction duplex featuring 3 bedrooms and 2 bathrooms per unit, offering an excellent opportunity for owner-occupants or investors. Property qualifies for FHA, VA, or Conventional financing when owner occupies one side, making it ideal for a house-hack strategy—live in one unit and rent the other. Projected completion date April 30 with anticipated closing May 1. This is 1 of 3 duplex units currently available, each offering spacious layouts, modern finishes, and strong rental appeal. Contact listing agent for floor plans, rental projections, and availability details.
Key facts
- 8,276 sq ft lot
- 4 parking spots
- Listed 98 days
Neighborhood map
What this means for you Summary
Snapshot
- This is a land listed at $300k.
Deal economics
- At list price, monthly cash flow is $-99 ($-1k/yr) — negative.
- To cash-flow at today's rent, offer at most $286k (4.8% below list).
- To meet the 1% rule (rent ≥ 1% of price), the offer needs to be $250k (16.7% below list).
- Recommended offer: $250k (16.7% below list) — sets the bar for 1% rule.
- Cap rate 5.9% vs local median 4.2% in Gardere — top-decile yield for the area; either an underpriced asset or a hidden risk that comps aren't pricing in. Stress-test before assuming the spread holds.
Location & tenants
- Location reads 64/100 on livability (#167 in LA) — a middle-class / working-renter tenant base. Strengths: cost of living A, housing A; Watch: crime D, employment D, amenities F.
- East Baton Rouge Parish (urban): math 22% / reading 34% proficiency, ranked #47 of 98 in LA (top 48%) — low school quality limits family demand, transient renter base, plan for 1-2y turnover; 77% free/reduced lunch — lower-income household profile, screen leases tightly.
- Zoned schools: Highland Elementary School (math 22% / reading 32%, grade F, #359 of 646 statewide, top 57%, 322 students, 62% FRL); Glasgow Middle School (math 29% / reading 40%, grade F, #93 of 218 statewide, top 43%, 550 students, 60% FRL); Liberty High School (math 50% / reading 74%, grade B-, #15 of 265 statewide, top 6%, 1,208 students, 60% FRL) — zoned schools average 60% FRL vs 77% district-wide (17 pts lower); this property's tenant base skews higher-income than the district average.
- Zoned-school proficiency averages 41% at this address vs 28% district-wide (+13 pts) — the actual schools serving this property are materially stronger than the East Baton Rouge Parish average implies; a family-tenant draw the district grade alone would hide.
- Market conditions: Rents rising (+2.8%/yr); 320 active listings in the ZIP; 11 comparable units currently listed for rent nearby; rentals at typical pace (median 25d on market — plan ~3-4 weeks tenant-placement turnaround); 2,252 units permitted in East Baton Rouge Parish in 2024 (440 in 5+ unit buildings).
- At $2,498/mo this rent would consume 63% of the median local household income ($47k/yr) (locally 1879% of renters already pay >50% of income on rent) — very limited rent-growth headroom before tenants either downsize or default.
Forward outlook
- Local home prices are declining (-3.0%/yr); year-one equity from $2k of loan paydown is wiped out by about $9k of value loss. Plan a longer hold.
- East Baton Rouge County population projected at +4% by 2050 — modest demand growth; plan on rents tracking national, not racing it.
Negotiation context
- It's been on market 98 days — a 9% lower offer ($273k) is reasonable based on typical stale-listing flexibility.
- 9 sale attempts since 6y ago; this cycle's ask is 3% above the opening price — seller raised mid-cycle; expect resistance to lowballs.
- Current owner paid $38k; list at $300k implies a 689% gain — meaningful room to come down on a strong offer.
Risks & watch-outs
- Climate carrying-cost: major flood risk; severe wind risk, 99% chance of damaging wind over 30y; extreme-heat days projected 7→21/yr by 2055 (HVAC capex compounding) — expect insurance premiums to compound above CPI over the hold.
Questions for the listing agent
- What do current leases actually rent for vs. the listed asking? Can we see a recent rent roll and the last 12 months of T-12 income?
- It's been on market 98 days. Have you received any prior offers? Is the seller open to a 17% concession, seller financing, or rate buy-down credit?
- Why hasn't it sold? Are there any deal-killer items the seller is aware of (foundation, flood, title, zoning, code violations)?
- Is there a deadline driving the sale (1031 exchange, divorce, estate, relocation)? That informs how much negotiation room exists.
- Crime grade is D in this area — have there been break-ins, vandalism, or insurance claims at this property in the last 3 years? What carrier currently insures it and at what premium?
- The area grade is low — what's the realistic commute time and amenity access for the typical tenant pool here? Any planned neighborhood developments (good or bad) we should know about?
- What's the average days-on-market for RENTAL listings here right now (not sales)? A rising rental-DOM trend means longer vacancies and softer asking-rent achievability than the comps imply.
- What's the recent tenant-quality profile in this submarket — average credit score on applications, eviction rate, late-payment / NSF rate, and stable-employment percentage? A property-management company in the area should have these aggregated.
- How much new for-sale + rental construction is in the pipeline within 1–3 miles? Heavy new supply typically softens prices + rents 12–24 months out; constrained supply supports both.
Investment metrics
- 1% rule
- 0.83% ✗
- Cap rate
- 5.90%
- Cash-on-cash
- -1.42%
- DSCR
- 0.94
- GRM
- 10.0
CMA / ARV
- ARV (median comp)
- $173,474
- List price
- $299,900
- Delta
- 72.88%
- Verdict
- OVERPRICED
- Comps
- 12 within 1.0 mi
Projected returns pro-forma
-3.0% appreciation · 2.79% rent growth · sell at horizon
- IRR
- -18.9%
- Equity multiple
- 0.34×
- Total profit
- $-55,397
- Equity at exit
- $44,716
- IRR
- -11.8%
- Equity multiple
- 0.30×
- Total profit
- $-58,365
- Equity at exit
- $25,930
Cash invested: $83,972 (down + closing). Projections, not guarantees.
Landlord ↔ Tenant lean methodology
- Overall (STATE)
- 90 Strongly Landlord-Friendly
- State Louisiana
- 90 Strongly Landlord-Friendly · R+12
- County
- — inherits STATE
- City
- — inherits STATE
ZIP-level market 70820
- Home prices YoY
- -29.9%
- Rents YoY
- 2.8%
- Active inventory
- 320
- Price-to-rent
- 10.0×
Monthly cashflow live
- Estimated rent
- $2,498 high interval (Pro) →
- Mortgage (P&I)
- −$1,573
- Tax est. 1.5%
- −$375 /mo · $4,498/yr
- Insurance
- −$125
- HOA
- −$0
- Vacancy / Maint / Mgmt
- −$525
- Net cashflow
- $-99
Break-even live
Sensitivity live
| Price | -10% $108 | -5% $5 | +0% $-99 | +5% $-203 | +10% $-306 |
|---|---|---|---|---|---|
| Rent | -10% $-296 | -5% $-198 | +0% $-99 | +5% $0 | +10% $98 |
| Rate | -1.0pp $52 | -0.5pp $-23 | base $-99 | +0.5pp $-177 | +1.0pp $-256 |
UW: 25.0% down · 7.5% · 30yr · 1.5% tax · 5.0% vac · 8.0% maint · 8.0% mgmt
Financing live
Cash to close
- Down payment
- $74,975
- Closing costs
- $8,997
- Reserves months
- —
- Total cash needed
- —
Loan-product check · same deal, 3 products live
Conventional
25% down · 7.5% · 30yr
- Down + closing
- —
- Monthly P&I
- —
- Monthly cashflow
- —
- DSCR
- —
- Eligible?
- —
Personal DTI + credit; lowest rate.
DSCR
20% down · 8.5% · 30yr
- Down + closing
- —
- Monthly P&I
- —
- Monthly cashflow
- —
- DSCR
- —
- Eligible?
- —
No personal income docs; deal must DSCR.
Hard money
10% down · 12.0% · 12mo
- Down + closing
- —
- Monthly P&I
- —
- Monthly cashflow
- —
- DSCR
- —
- Eligible?
- —
Short-term bridge; refi at stabilization.
Rent comps 11 comps
| Address | Beds | Baths | Sqft | Rent | $/sqft | DOM | Units | Dist |
|---|---|---|---|---|---|---|---|---|
| 1418 Gardenia Ln Baton Rouge, LA | 3.0 | 2.0 | 1812 | $2,350 | $1.30 | 16d | 1 | 0.51mi |
| 7642 W Pelican Lakes Ave Baton Rouge, LA | 3.0 | 2.0 | 1631 | $2,500 | $1.53 | 23d | 1 | 0.52mi |
| 1219 Drago Dr Baton Rouge, LA | 1.0 | 1.0 | 1609 | $825 | $0.51 | 25d | 1 | 0.55mi |
| 7623 Waterview Dr Baton Rouge, LA | 3.0 | 2.0 | 1933 | $2,650 | $1.37 | 25d | 1 | 0.61mi |
| 954 Deer Pass Dr Baton Rouge, LA | 3.0 | 2.0 | 1612 | $2,400 | $1.49 | 45d | 1 | 0.77mi |
| 641 Greenwich Dr Baton Rouge, LA | 3.0 | 2.0 | 1973 | $2,400 | $1.22 | 25d | 1 | 0.92mi |
| 3317 Pointe Marie Dr Baton Rouge, LA | 3.0 | 2.5 | 2110 | $4,300 | $2.04 | 45d | 1 | 1.15mi |
| 8017 Seville Ct Baton Rouge, LA | 3.0 | 2.5 | 1786 | $2,700 | $1.51 | 45d | 1 | 1.16mi |
| 717 Summer Breeze Dr Baton Rouge, LA | 3.0 | 2.0 | 1750 | $2,000 | $1.14 | 25d | 1 | 1.26mi |
| 7306 Kenilworth Crossing Ave Baton Rouge, LA | 3.0 | 2.0 | 1613 | $2,700 | $1.67 | 16d | 1 | 1.34mi |
| 10157 Bonnet Cove Ave Baton Rouge, LA | 3.0 | 3.0 | 1785 | $1,900 | $1.06 | 45d | 1 | 1.44mi |
Listing history 37 events
-
2026-06-17status $299,900 Pending 98 DOM
-
2026-06-16days on market $299,900 Active 98 DOM
-
2026-06-15days on market $299,900 Active 97 DOM
-
2026-06-14days on market $299,900 Active 95 DOM
-
2026-06-10days on market $299,900 Active 92 DOM
-
2026-06-09days on market $299,900 Active 91 DOM
-
2026-06-08days on market $299,900 Active 90 DOM
-
2026-06-07days on market $299,900 Active 89 DOM
-
2026-06-05days on market $299,900 Active 86 DOM
-
2026-06-03days on market $299,900 Active 85 DOM
-
2026-06-02days on market $299,900 Active 84 DOM
-
2026-06-01days on market $299,900 Active 83 DOM
-
2026-05-31days on market $299,900 Active 82 DOM
-
2026-05-31days on market $299,900 Active 81 DOM
-
2026-03-10price $299,900 587-char remark
Show marketing remark (582 chars)
New construction duplex featuring 3 bedrooms and 2 bathrooms per unit, offering an excellent opportunity for owner-occupants or investors. Property qualifies for FHA, VA, or Conventional financing when owner occupies one side, making it ideal for a house-hack strategy--live in one unit and rent the other. Projected completion date April 30 with anticipated closing May 1. This is 1 of 3 duplex units currently available, each offering spacious layouts, modern finishes, and strong rental appeal. Contact listing agent for floor plans, rental projections, and availability details.
-
2026-03-10$289,900 Active 587-char remark
Show marketing remark (582 chars)
New construction duplex featuring 3 bedrooms and 2 bathrooms per unit, offering an excellent opportunity for owner-occupants or investors. Property qualifies for FHA, VA, or Conventional financing when owner occupies one side, making it ideal for a house-hack strategy--live in one unit and rent the other. Projected completion date April 30 with anticipated closing May 1. This is 1 of 3 duplex units currently available, each offering spacious layouts, modern finishes, and strong rental appeal. Contact listing agent for floor plans, rental projections, and availability details.
-
2026-03-10$299,900 Active 582-char remark
Show marketing remark (582 chars)
New construction duplex featuring 3 bedrooms and 2 bathrooms per unit, offering an excellent opportunity for owner-occupants or investors. Property qualifies for FHA, VA, or Conventional financing when owner occupies one side, making it ideal for a house-hack strategy--live in one unit and rent the other. Projected completion date April 30 with anticipated closing May 1. This is 1 of 3 duplex units currently available, each offering spacious layouts, modern finishes, and strong rental appeal. Contact listing agent for floor plans, rental projections, and availability details.
-
2025-04-24soldstatus $38,000
-
2025-04-04soldstatus Closed
-
2025-03-10status Pending
-
2025-01-07status Active
-
2024-12-27status Active
-
2024-12-11status Pending
-
2024-12-11historical
-
2024-11-18status Pending
-
2024-11-01$75,000 Active
-
2024-11-01$75,000 Active
-
2021-04-29soldstatus $25,000
-
2021-04-20soldstatus Sold
-
2021-03-06status Pending
-
2021-02-02price $29,900
-
2021-02-01status Active
-
2021-01-01status Pending
-
2020-04-23price $40,000
-
2020-01-08$50,000 Active
-
2020-01-08$29,900
-
1988-12-30soldstatus
ⓘ Source: listings_history table (triggers on properties + properties_extension) + one-shot
backfill from property_details.listing_events for pre-trigger history.
Climate risk First Street
- Flood 6/10 Major FEMA zone X · 68% chance over 30 yrs
- Wildfire 1/10 Low
- Heat 8/10 Severe 7 d/yr ≥108°F today · 21 d/yr by 30 yrs out
- Wind 9/10 Extreme 99% chance of damaging wind over 30 yrs
- Air quality 3/10 Moderate 3 unhealthy d/yr today · 3 by 30 yrs out
Nearby sold comps map
Loading sold comps map…
Walkable amenities ~0.75 mi
Loading nearby amenities…
Taxation est. · year 1
- Rental income
- $29,976
- − Mortgage interest
- −$16,799
- − Property taxes
- −$4,498
- − Insurance
- −$1,500
- − Repairs & maintenance
- −$2,398
- − Management
- −$2,398
- − Depreciation
- −$8,724
- Taxable loss
- −$6,341
- Est. tax savings @ 24.0%
- +$1,522
- After-tax cash flow
- $333/yr
For passive investors: Depreciation is non-cash, so a rental often shows a tax loss while cash-flowing — sheltering income. Rental losses are passive: they offset passive income freely, and up to $25,000/yr can offset ordinary (W-2) income if you actively participate and your MAGI is under $100k (phasing out to $0 by $150k); unused losses carry forward. On sale, claimed depreciation is recaptured at up to 25%, and gains may owe capital-gains tax (a 1031 exchange can defer both). Figures are a year-1 estimate at your 24.0% rate — not tax advice; consult a CPA.
Schools (NCES district)
- District
- East Baton Rouge Parish
- NCES district ID
- 2200540
- Math proficiency
- 22% ▼ -36.00%
- Reading proficiency
- 34% ▼ -31.00%
- Median HH income
- $46,263
- Composite
- 24.14/100
- National rank
- #7745
- State rank
- #47 of 98 in LA
Livability — Gardere
- Score
- 64/100
- State rank
- #167
- US rank
- #14008
Category grades
Schools grade is shown separately in the Schools card above.
Census & demographics
- Census place
- Gardere, LA
- County
- East Baton Rouge Parish · 399,686 people
- Metro
- Baton Rouge, LA
- Population (ZIP)
- 23,377
- Household income
- $47,429
- Rent vs Own
- Severe rent burden
- 1879.0
Population outlook (East Baton Rouge County) Hauer SSP2
- Today (2025)
- 464,810 people
- By 2030
- 472,137 · +1.6%
- By 2040
- 480,243 · +3.3%
- By 2050
- 484,422 · +4.2%
- By 2075
- 492,069 · +5.9%
- By 2100
- 476,347 · +2.5%
Race, ethnicity, and origin ACS 2023
- Neighborhood character
- Diverse neighborhood (Simpson 0.63)
- Race & ethnicity
- White 56% Black 21% Hispanic / Latino 13% Asian 7% Two or more races 5% Native American 2%
- Hispanic origin (detail)
- Mexican 3%
- Common ancestry
- Lithuanian 7% Italian 2% Scotch-Irish 1%
- Foreign-born
- 13% · Canada, China, South Korea
- Languages at home
- 84% English-only · Spanish 9% Other Indo-European 3% Chinese 1%
Political lean MEDSL · East Baton Rouge
- 2024 margin
- D (+11.1) · D 54.5% · R 43.4% · Other 2.1%
- 2008→2024 swing
- +8.9pp toward D · 2008: 2.2pp · 2024: 11.1pp
- All cycles
- 2024: D+11.1 2020: D+13.1 2016: D+9.2 2012: D+5.2 2008: D+2.2
Not yet ingested
- Civics
- —
Market trends
- HPI YoY
- ▼ -56.10%
- Current HPI
- 131.5382
- Rent YoY
- ▲ 2.79%
- Metro
- Baton Rouge, LA
- State GDP YoY
- ▲ 3.29%
- F500 in state
- 10
Industry mix (Fortune 500 HQ in LA)
| Industry | F500 HQs | Revenue |
|---|---|---|
| Telecommunications | 2 | $23B |
|
||
| Utilities | 1 | $12B |
|
||
| Wholesale / Distribution | 1 | $5B |
|
||
| Advertising | 1 | $2B |
|
||
Price history
+499.8% since first listed23 events — show timeline
- 2026-03-10 Price Changed $299,900 GBRMLS
- 2026-03-10 Listed $289,900 GBRMLS
- 2026-03-10 Listed $299,900 AcadianaMLS
- 2025-04-24 Sold (Public Records) $38,000 Public Records
- 2025-04-04 Sold (MLS) — GBRMLS
- 2025-03-10 Pending — GBRMLS
- 2025-01-07 Relisted — GBRMLS
- 2024-12-27 Relisted — GBRMLS
- 2024-12-11 Pending — GBRMLS
- 2024-12-11 Delisted — GBRMLS
- 2024-11-18 Pending — GBRMLS
- 2024-11-01 Listed $75,000 AcadianaMLS
- 2024-11-01 Listed $75,000 GBRMLS
- 2021-04-29 Sold (Public Records) $25,000 Public Records
- 2021-04-20 Sold (MLS) — GBRMLS
- 2021-03-06 Pending — GBRMLS
- 2021-02-02 Price Changed $29,900 GBRMLS
- 2021-02-01 Relisted — GBRMLS
- 2021-01-01 Pending — GBRMLS
- 2020-04-23 Price Changed $40,000 GBRMLS
- 2020-01-08 Listed $29,900 AcadianaMLS
- 2020-01-08 Listed $50,000 GBRMLS
- 1988-12-30 Sold (Public Records) — Public Records
Property tax history
+1.4%/yrLatest (2025): $116 · -0.4% YoY. Source: county tax records.
Cash-flow waterfall
monthlySold comps — $/sqft
last 12 mo · ≤1 miLoading sold comps…