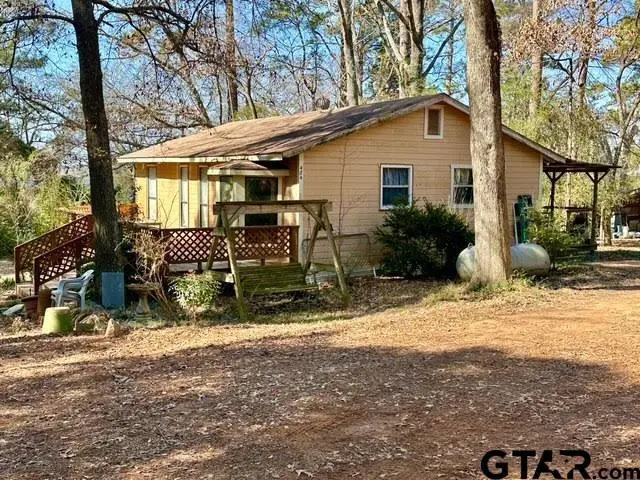
484 Cr 3504 · Shadybrook, TX
Flood risk 1/10 · Minimal
- FEMA flood zone
- X (unshaded)
- Chance of flooding over 30 yrs
- 0.0%
- Est. flood insurance / yr
- $507 – $1,088
Fire risk 5/10 · Moderate
- Est. fire insurance / yr
- $1,222 – $2,270
Heat risk 6/10 · Moderate
- Hot days now (above 109°F)
- 7 days/yr
- Hot days in 30 yrs
- 24 days/yr
Wind risk 6/10 · Moderate
- Chance of severe wind over 30 yrs
- 68.0%
Air-quality risk 1/10 · Minimal
- Unhealthy air days now
- 0 days/yr
- Unhealthy air days in 30 yrs
- 0 days/yr
Risk factors via First Street. Map © Google.
Why this score? — see what drove the D+ grade
The composite is a weighted blend of 9 inputs, each scored 0–100. Each bar is that input's sub-score; the figure is the points it added to the 100-point composite (weight × sub-score).
- Cash flow +22.0/30.0
- DSCR +7.0/10.0
- Schools +5.4/10.0
- 1% rule +5.3/10.0
- Livability +3.0/5.0
- Rent growth +2.5/5.0
- Condition / age +2.5/5.0
- ARV discount +0.0/15.0
- Appreciation +0.0/10.0
$142,000
🖨 Deal sheet 📄 Offer letter ✓ Due diligence
Listing remarks MLS
ATTN: INVESTORS! Rental property! Property has a 3/1 house and enough land where mobile homes could be added. Property has a tenant, who is on a month to month basis and income is $1000 per month. House can be shown by appt. See attached map for details.
Key facts
- Enough land
- Built 1967
- Listed 87 days
Tags
Neighborhood map
What this means for you Summary
Snapshot
- This is a 2-bed/1.0-bath single-family listed at $142k.
Deal economics
- At list price, monthly cash flow is $225 ($3k/yr) — positive.
- The deal already cash-flows at list — no discount required.
- Meets the 1% rule at list price ($1k rent vs $142k).
- Recommended offer: $133k (6.0% below list) — sets the bar for market timing.
- Cap rate 8.2% vs local median 4.0% in Shadybrook — top-decile yield for the area; either an underpriced asset or a hidden risk that comps aren't pricing in. Stress-test before assuming the spread holds.
Location & tenants
- Location reads 60/100 on livability (#1,042 in TX) — a middle-class / working-renter tenant base. Strengths: cost of living A+, crime A-; Watch: schools F, amenities F, commute F.
- Bullard ISD (rural): math 65% / reading 60% proficiency, ranked #48 of 826 in TX (top 6%) — acceptable for families but not a draw, mixed tenant base, ~2y average lease.
- Market conditions: 581 active listings in the ZIP; 39 units permitted in Cherokee County in 2024 (0 in 5+ unit buildings).
Forward outlook
- Local home prices are declining (-3.0%/yr); year-one equity from $982 of loan paydown is wiped out by about $4k of value loss. Plan a longer hold.
Negotiation context
- It's been on market 88 days — a 6% lower offer ($133k) is reasonable based on typical stale-listing flexibility.
- 2 sale attempts with the ask held roughly flat each time — persistent listings suggest the price (not the market) is what's stuck; bring a comps-based counter.
Risks & watch-outs
- Climate carrying-cost: major wind risk, 68% chance of damaging wind over 30y; moderate wildfire risk; extreme-heat days projected 7→24/yr by 2055 (HVAC capex compounding) — expect insurance premiums to compound above CPI over the hold.
Questions for the listing agent
- It's been on market 88 days. Have you received any prior offers? Is the seller open to a 6% concession, seller financing, or rate buy-down credit?
- Built in 1967 — when were the roof, HVAC, electrical panel, plumbing, and water heater last replaced?
- Why hasn't it sold? Are there any deal-killer items the seller is aware of (foundation, flood, title, zoning, code violations)?
- Is there a deadline driving the sale (1031 exchange, divorce, estate, relocation)? That informs how much negotiation room exists.
- Schools are F-rated, which usually means shorter tenancies and higher turnover. Who's the typical renter profile here, and what's been the actual vacancy rate?
- The area grade is low — what's the realistic commute time and amenity access for the typical tenant pool here? Any planned neighborhood developments (good or bad) we should know about?
- What's the average days-on-market for RENTAL listings here right now (not sales)? A rising rental-DOM trend means longer vacancies and softer asking-rent achievability than the comps imply.
- What's the recent tenant-quality profile in this submarket — average credit score on applications, eviction rate, late-payment / NSF rate, and stable-employment percentage? A property-management company in the area should have these aggregated.
- How much new for-sale + rental construction is in the pipeline within 1–3 miles? Heavy new supply typically softens prices + rents 12–24 months out; constrained supply supports both.
Investment metrics
- 1% rule
- 1.03% ✓
- Cap rate
- 8.19%
- Cash-on-cash
- 6.79%
- DSCR
- 1.30
- GRM
- 8.1
CMA / ARV
- ARV (median comp)
- $119,164
- List price
- $142,000
- Delta
- 19.16%
- Verdict
- OVERPRICED
- Comps
- 1 within 2.0 mi
Projected returns pro-forma
-3.0% appreciation · 3.0% rent growth · sell at horizon
- IRR
- -5.9%
- Equity multiple
- 0.78×
- Total profit
- $-8,698
- Equity at exit
- $21,173
- IRR
- 3.7%
- Equity multiple
- 1.27×
- Total profit
- $10,828
- Equity at exit
- $12,278
Cash invested: $39,760 (down + closing). Projections, not guarantees.
Landlord ↔ Tenant lean methodology
- Overall (STATE)
- 87 Strongly Landlord-Friendly
- State Texas
- 87 Strongly Landlord-Friendly · R+5
- County
- — inherits STATE
- City
- — inherits STATE
ZIP-level market 75757
- Home prices YoY
- -23.6%
- Active inventory
- 581
- Price-to-rent
- 8.1×
Monthly cashflow live
- Estimated rent
- $1,462 medium interval (Pro) →
- Mortgage (P&I)
- −$745
- Tax from tax record
- −$126 /mo · $1,511/yr
- Insurance
- −$59
- HOA
- −$0
- Vacancy / Maint / Mgmt
- −$307
- Net cashflow
- $225
Break-even live
UW: 25.0% down · 7.5% · 30yr · 1.5% tax · 5.0% vac · 8.0% maint · 8.0% mgmt
Financing live
Cash to close
- Down payment
- $35,500
- Closing costs
- $4,260
- Reserves months
- —
- Total cash needed
- —
Loan-product check · same deal, 3 products live
Conventional
25% down · 7.5% · 30yr
- Down + closing
- —
- Monthly P&I
- —
- Monthly cashflow
- —
- DSCR
- —
- Eligible?
- —
Personal DTI + credit; lowest rate.
DSCR
20% down · 8.5% · 30yr
- Down + closing
- —
- Monthly P&I
- —
- Monthly cashflow
- —
- DSCR
- —
- Eligible?
- —
No personal income docs; deal must DSCR.
Hard money
10% down · 12.0% · 12mo
- Down + closing
- —
- Monthly P&I
- —
- Monthly cashflow
- —
- DSCR
- —
- Eligible?
- —
Short-term bridge; refi at stabilization.
Listing history 20 events
-
2026-06-19days on market $142,000 Active 88 DOM
-
2026-06-18days on market $142,000 Active 87 DOM
-
2026-06-17days on market $142,000 Active 86 DOM
-
2026-06-16days on market $142,000 Active 85 DOM
-
2026-06-15days on market $142,000 Active 84 DOM
-
2026-06-14days on market $142,000 Active 82 DOM
-
2026-06-13days on market $142,000 Active 81 DOM
-
2026-06-10days on market $142,000 Active 79 DOM
-
2026-06-09days on market $142,000 Active 78 DOM
-
2026-06-08days on market $142,000 Active 77 DOM
-
2026-06-07days on market $142,000 Active 76 DOM
-
2026-06-03days on market $142,000 Active 72 DOM
-
2026-06-02days on market $142,000 Active 71 DOM
-
2026-06-01days on market $142,000 Active 70 DOM
-
2026-05-31days on market $142,000 Active 69 DOM
-
2026-05-30days on market $142,000 Active 68 DOM
-
2026-03-23$142,000 Active 254-char remark
Show marketing remark (531 chars)
ATTN: INVESTORS! 3 rental properties! Property consists of 1.92 acres/ 3 parcels of land: 1 with a 3/1 house, 1 with 2 mobile homes each have 2/2 and an adjoining parcel of land where additional mobile homes could be added. All three properties have tenants, combined income is $3000 per month. They are all on a month to month basis. House can be shown by appt. The mobile homes cannot be shown until under contract. The 3 parcels of land are marked with pink survey stakes on left side of dirt road. See attached map for details.
-
2026-03-23price $320,000 531-char remark
Show marketing remark (531 chars)
ATTN: INVESTORS! 3 rental properties! Property consists of 1.92 acres/ 3 parcels of land: 1 with a 3/1 house, 1 with 2 mobile homes each have 2/2 and an adjoining parcel of land where additional mobile homes could be added. All three properties have tenants, combined income is $3000 per month. They are all on a month to month basis. House can be shown by appt. The mobile homes cannot be shown until under contract. The 3 parcels of land are marked with pink survey stakes on left side of dirt road. See attached map for details.
-
2026-02-05$349,000 Active 531-char remark
Show marketing remark (531 chars)
ATTN: INVESTORS! 3 rental properties! Property consists of 1.92 acres/ 3 parcels of land: 1 with a 3/1 house, 1 with 2 mobile homes each have 2/2 and an adjoining parcel of land where additional mobile homes could be added. All three properties have tenants, combined income is $3000 per month. They are all on a month to month basis. House can be shown by appt. The mobile homes cannot be shown until under contract. The 3 parcels of land are marked with pink survey stakes on left side of dirt road. See attached map for details.
-
2025-02-04soldstatus
ⓘ Source: listings_history table (triggers on properties + properties_extension) + one-shot
backfill from property_details.listing_events for pre-trigger history.
Tax reassessment forecast TX · Resets to sale price
- Current annual tax
- $1,511 · $126/mo
- Projected year-2 tax
- $2,599 · $217/mo
- Expected delta
- +$1,088/yr (+$91/mo · 72.0%)
ⓘ Screening estimate from a state-policy table — verify with the county assessor before closing.
Climate risk First Street
- Flood 1/10 Low FEMA zone X (unshaded) · 0% chance over 30 yrs
- Wildfire 5/10 Major
- Heat 6/10 Major 7 d/yr ≥109°F today · 24 d/yr by 30 yrs out
- Wind 6/10 Major 68% chance of damaging wind over 30 yrs
- Air quality 1/10 Low 0 unhealthy d/yr today · 0 by 30 yrs out
Nearby sold comps map
Loading sold comps map…
Walkable amenities ~0.75 mi
Loading nearby amenities…
Taxation est. · year 1
- Rental income
- $17,538
- − Mortgage interest
- −$7,954
- − Property taxes
- −$1,511
- − Insurance
- −$710
- − Repairs & maintenance
- −$1,403
- − Management
- −$1,403
- − Depreciation
- −$4,131
- Taxable income
- $426
- Est. tax owed @ 24.0%
- −$102
- After-tax cash flow
- $2,596/yr
For passive investors: Depreciation is non-cash, so a rental often shows a tax loss while cash-flowing — sheltering income. Rental losses are passive: they offset passive income freely, and up to $25,000/yr can offset ordinary (W-2) income if you actively participate and your MAGI is under $100k (phasing out to $0 by $150k); unused losses carry forward. On sale, claimed depreciation is recaptured at up to 25%, and gains may owe capital-gains tax (a 1031 exchange can defer both). Figures are a year-1 estimate at your 24.0% rate — not tax advice; consult a CPA.
Schools (NCES district)
- District
- Bullard ISD
- NCES district ID
- 4812060
- Math proficiency
- 65% ▼ -2.00%
- Reading proficiency
- 60% ▬ 0.00%
- Median HH income
- $55,026
- Composite
- 53.66/100
- National rank
- #1433
- State rank
- #48 of 826 in TX
Livability — Shadybrook
- Score
- 60/100
- State rank
- #1042
- US rank
- #18541
Category grades
Schools grade is shown separately in the Schools card above.
Census & demographics
- Population (ZIP)
- 13,977
Population outlook (Cherokee County) Hauer SSP2
- Today (2025)
- 51,949 people
- By 2030
- 51,984 · +0.1%
- By 2040
- 51,780 · -0.3%
- By 2050
- 51,085 · -1.7%
- By 2075
- 47,418 · -8.7%
- By 2100
- 39,464 · -24.0%
Race, ethnicity, and origin ACS 2023
- Neighborhood character
- Predominantly White (80%)
- Race & ethnicity
- White 80% Hispanic / Latino 13% Two or more races 10% Black 2%
- Hispanic origin (detail)
- Mexican 10%
- Common ancestry
- Iranian 5% Italian 4% Slovak 2%
- Foreign-born
- 4% · Canada, Guatemala
- Languages at home
- 92% English-only · Spanish 8%
Political lean MEDSL · Cherokee
- 2024 margin
- Solid R (+62.7) · D 18.3% · R 80.9%
- 2008→2024 swing
- -19.5pp toward R · 2008: -43.2pp · 2024: -62.7pp
- All cycles
- 2024: R+62.7 2020: R+55.8 2016: R+56.5 2012: R+51.0 2008: R+43.2
Not yet ingested
- Civics
- —
Market trends
- HPI YoY
- ▼ -58.57%
- Current HPI
- 189.5215
- Rent YoY
- —
- Metro
- —
- State GDP YoY
- ▲ 3.95%
- F500 in state
- 110
Industry mix (Fortune 500 HQ in TX)
| Industry | F500 HQs | Revenue |
|---|---|---|
| Energy | 16 | $1,198B |
|
||
| Technology | 5 | $198B |
|
||
| Engineering / Construction | 4 | $72B |
|
||
| Energy Services | 3 | $60B |
|
||
| Utilities | 3 | $41B |
|
||
| Healthcare | 2 | $330B |
|
||
Price history
-59.3% since first listed4 events — show timeline
- 2026-03-23 Listed $142,000 GTAR
- 2026-03-23 Price Changed $320,000 GTAR
- 2026-02-05 Listed $349,000 GTAR
- 2025-02-04 Sold (Public Records) — Public Records
Property tax history
+6.0%/yrLatest (2025): $1,511 · -3.9% YoY. Source: county tax records.
Cash-flow waterfall
monthlySold comps — $/sqft
last 12 mo · ≤1 miLoading sold comps…