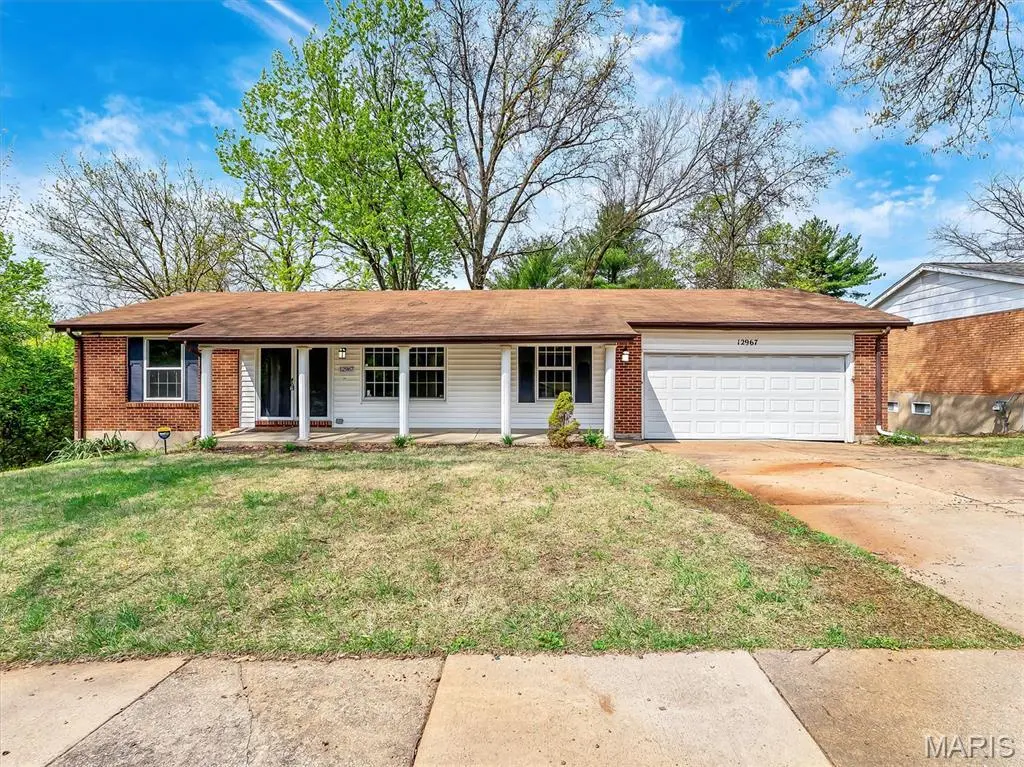
12967 Vanderwood Dr · Black Jack, MO
Flood risk 1/10 · Minimal
- FEMA flood zone
- X (unshaded)
- Chance of flooding over 30 yrs
- 0.0%
- Est. flood insurance / yr
- $473 – $860
Fire risk 1/10 · Minimal
- Est. fire insurance / yr
- $1,054 – $1,958
Heat risk 4/10 · Minor
- Hot days now (above 106°F)
- 7 days/yr
- Hot days in 30 yrs
- 20 days/yr
Wind risk 2/10 · Minimal
- Chance of severe wind over 30 yrs
- 1.0%
Air-quality risk 3/10 · Minor
- Unhealthy air days now
- 3 days/yr
- Unhealthy air days in 30 yrs
- 5 days/yr
Risk factors via First Street. Map © Google.
Why this score? — see what drove the B- grade
The composite is a weighted blend of 9 inputs, each scored 0–100. Each bar is that input's sub-score; the figure is the points it added to the 100-point composite (weight × sub-score).
- Cash flow +17.8/30.0
- ARV discount +15.0/15.0
- Appreciation +10.0/10.0
- DSCR +5.6/10.0
- 1% rule +4.8/10.0
- Rent growth +4.4/5.0
- Livability +3.5/5.0
- Condition / age +2.5/5.0
- Schools +1.7/10.0
$189,500
🖨 Deal sheet 📄 Offer letter ✓ Due diligence
Listing remarks MLS
Beautiful 3 bed, 2 bath home that truly checks all the boxes! Featuring stylish hardwood-style flooring and a cozy fireplace, this home offers both comfort and charm throughout. The spacious primary bedroom includes a walk-in closet, providing plenty of storage. Enjoy the added bonus of a walk-out basement and relax on the deck overlooking a private, wooded backdrop—perfect for entertaining or unwinding. With a 2-car garage and great overall layout, this home offers the space and features today’s buyers are looking for. Being sold as-is, but full of value and move-in ready appeal—don’t miss this one!
Key facts
- Walk-in closet
- Walk-out basement
- Cozy fireplace
Tags
Neighborhood map
What this means for you Summary
Snapshot
- This is a 3-bed/2.0-bath single-family listed at $190k.
Deal economics
- At list price, monthly cash flow is $158 ($2k/yr) — positive.
- The deal already cash-flows at list — no discount required.
- To meet the 1% rule (rent ≥ 1% of price), the offer needs to be $186k (2.1% below list).
- Recommended offer: $184k (3.0% below list) — sets the bar for market timing.
Location & tenants
- Location reads 70/100 on livability (#132 in MO) — a middle-class / working-renter tenant base. Strengths: cost of living A+, housing A+; Watch: health & safety C-, crime D+, amenities F.
- Hazelwood (suburban): math 11% / reading 26% proficiency, ranked #306 of 324 in MO (top 94%) — low school quality limits family demand, transient renter base, plan for 1-2y turnover.
- Market conditions: Rents rising fast (+7.5%/yr); 218 active listings in the ZIP; 9 comparable units currently listed for rent nearby; rentals at typical pace (median 17d on market — plan ~3-4 weeks tenant-placement turnaround); 920 units permitted in St. Louis County in 2024 (250 in 5+ unit buildings).
- This rent runs 33% of the median local income ($67k/yr) — at the standard rent-burdened threshold; future hikes will face affordability resistance.
Forward outlook
- In year one you build about $20k of equity ($1k loan paydown + $19k appreciation (10.0% local appreciation)).
- At projected returns (10.0% appreciation + 7.5% rent growth), your $53k cash investment doubles in ~3 years — after that, you're playing with house money.
- By year 2, paydown + projected appreciation supports a ~$33k cash-out refi (75% LTV) — recoverable capital for the next deal without selling this one.
Negotiation context
- It's been on market 38 days — a 3% lower offer ($184k) is reasonable based on typical stale-listing flexibility.
- 3 sale attempts since 6y ago with the ask held roughly flat each time — persistent listings suggest the price (not the market) is what's stuck; bring a comps-based counter.
- Current owner paid $90k; list at $190k implies a 111% gain — meaningful room to come down on a strong offer.
Questions for the listing agent
- It's been on market 38 days. Have you received any prior offers? Is the seller open to a 3% concession, seller financing, or rate buy-down credit?
- Built in 1971 — when were the roof, HVAC, electrical panel, plumbing, and water heater last replaced?
- Is there a deadline driving the sale (1031 exchange, divorce, estate, relocation)? That informs how much negotiation room exists.
- Crime grade is D in this area — have there been break-ins, vandalism, or insurance claims at this property in the last 3 years? What carrier currently insures it and at what premium?
- What's the average days-on-market for RENTAL listings here right now (not sales)? A rising rental-DOM trend means longer vacancies and softer asking-rent achievability than the comps imply.
- What's the recent tenant-quality profile in this submarket — average credit score on applications, eviction rate, late-payment / NSF rate, and stable-employment percentage? A property-management company in the area should have these aggregated.
- How much new for-sale + rental construction is in the pipeline within 1–3 miles? Heavy new supply typically softens prices + rents 12–24 months out; constrained supply supports both.
Investment metrics
- 1% rule
- 0.98% ✗
- Cap rate
- 7.29%
- Cash-on-cash
- 3.56%
- DSCR
- 1.16
- GRM
- 8.5
CMA / ARV
- ARV (median comp)
- $270,875
- List price
- $189,500
- Delta
- -30.04%
- Verdict
- UNDERPRICED
- Comps
- 20 within 1.0 mi
Show comp detail 12 sales within ~0.75 mi
| Address | Dist | Beds/Ba | Sqft | Sold | Price | $/sf | Match |
|---|---|---|---|---|---|---|---|
| 4424 Cloverbrook Dr | 0.06mi | 3/2.0 | 1,521 (+3%) | 5mo | $249,900 | $164 | 88 |
| 4423 Cloverbrook Dr | 0.07mi | 3/2.0 | 1,457 (-2%) | 8mo | $275,000 | $189 | 88 |
| 35 Wild Ridge/hazeltine | 0.17mi | 3/2.0 | 1,612 (+9%) | 1mo | $317,742 | $197 | 76 |
| Lot 8 Wild Ridge/ Hazeltine | 0.17mi | 3/2.0 | 1,612 (+9%) | 6mo | $334,967 | $208 | 72 |
| 6 Fairway Ct | 0.29mi | 3/2.0 | 1,407 (-5%) | 13mo | $194,900 | $139 | 68 |
| 1 Club Grounds North Dr | 0.68mi | 3/2.0 | 1,426 (-4%) | 4mo | $209,900 | $147 | 58 |
| 12250 Old Halls Ferry Rd | 0.56mi | 3/2.5 | 1,524 (+3%) | 12mo | $200,000 | $131 | 57 |
| 3870 Woodcrest Dr | 0.59mi | 4/2.0 (+1) | 1,536 (+4%) | 7mo | $279,900 | $182 | 55 |
| 1515 Lisa Dr | 0.69mi | 3/3.0 | 1,443 (-2%) | 8mo | $195,000 | $135 | 53 |
| 12922 High Crest St | 0.55mi | 4/3.5 (+1) | 1,566 (+6%) | 2mo | $320,000 | $204 | 52 |
| 4359 Blythewood Dr | 0.37mi | 3/3.0 | 1,684 (+14%) | 5mo | $250,000 | $148 | 51 |
| 13011 Mystic Bend Ln | 0.73mi | 3/2.0 | 1,643 (+11%) | 10mo | $245,000 | $149 | 39 |
Match score weights: distance 35% · size 25% · config 20% · recency 20%. Top-matched comps best support the ARV.
Projected returns pro-forma
10.0% appreciation · 7.51% rent growth · sell at horizon
- IRR
- 28.6%
- Equity multiple
- 3.30×
- Total profit
- $122,074
- Equity at exit
- $170,717
- IRR
- 26.2%
- Equity multiple
- 8.03×
- Total profit
- $373,048
- Equity at exit
- $368,157
Cash invested: $53,060 (down + closing). Projections, not guarantees.
Landlord ↔ Tenant lean methodology
- Overall (STATE)
- 81 Strongly Landlord-Friendly
- State Missouri
- 81 Strongly Landlord-Friendly · R+10
- County
- — inherits STATE
- City
- — inherits STATE
ZIP-level market 63033
- Home prices YoY
- 2.5%
- Rents YoY
- 7.5%
- Active inventory
- 218
- Price-to-rent
- 8.5×
Monthly cashflow live
- Estimated rent
- $1,856 high interval (Pro) →
- Mortgage (P&I)
- −$994
- Tax from tax record
- −$236 /mo · $2,829/yr
- Insurance
- −$79
- HOA
- −$0
- Vacancy / Maint / Mgmt
- −$390
- Net cashflow
- $158
Break-even live
UW: 25.0% down · 7.5% · 30yr · 1.5% tax · 5.0% vac · 8.0% maint · 8.0% mgmt
Financing live
Cash to close
- Down payment
- $47,375
- Closing costs
- $5,685
- Reserves months
- —
- Total cash needed
- —
Loan-product check · same deal, 3 products live
Conventional
25% down · 7.5% · 30yr
- Down + closing
- —
- Monthly P&I
- —
- Monthly cashflow
- —
- DSCR
- —
- Eligible?
- —
Personal DTI + credit; lowest rate.
DSCR
20% down · 8.5% · 30yr
- Down + closing
- —
- Monthly P&I
- —
- Monthly cashflow
- —
- DSCR
- —
- Eligible?
- —
No personal income docs; deal must DSCR.
Hard money
10% down · 12.0% · 12mo
- Down + closing
- —
- Monthly P&I
- —
- Monthly cashflow
- —
- DSCR
- —
- Eligible?
- —
Short-term bridge; refi at stabilization.
Rent comps 9 comps
| Address | Beds | Baths | Sqft | Rent | $/sqft | DOM | Units | Dist |
|---|---|---|---|---|---|---|---|---|
| 4583 Whisper Lake Dr Black Jack, MO | 1.0–5.0 | 1.0–2.5 | 1225 | $1,156 | $0.94 | 1d | 17 | 0.48mi |
| 4872 Bristol Rock Rd Black Jack, MO | 4.0 | 2.0 | 1448 | $2,061 | $1.42 | 2d | 1 | 0.91mi |
| 3930 Belcroft Dr Florissant, MO | 3.0 | 3.0 | 1408 | $1,935 | $1.37 | 43d | 1 | 0.92mi |
| 2075 Cordoba Dr Florissant, MO | 3.0 | 2.0 | 1523 | $1,850 | $1.21 | 14d | 1 | 0.93mi |
| 11635 Hazeloak Dr Black Jack, MO | 3.0 | 2.0 | 1124 | $1,728 | $1.54 | 17d | 1 | 1.08mi |
| 5320 Springtrail Dr Black Jack, MO | 4.0 | 2.5 | 1712 | $2,390 | $1.40 | 22d | 1 | 1.12mi |
| 3 Cantabrian Ct Florissant, MO | 3.0 | 2.0 | 1436 | $1,881 | $1.31 | 14d | 1 | 1.13mi |
| 2990 Santiago Dr Florissant, MO | 2.0 | 2.0 | 984 | $1,200 | $1.22 | 43d | 1 | 1.36mi |
| 1600 Horseshoe Dr Florissant, MO | 3.0 | 2.0 | 1314 | $1,550 | $1.18 | 43d | 1 | 1.48mi |
Listing history 9 events
-
2026-05-08status Active 633-char remark
Show marketing remark (633 chars)
Beautiful 3 bed, 2 bath home that truly checks all the boxes! Featuring stylish hardwood-style flooring and a cozy fireplace, this home offers both comfort and charm throughout. The spacious primary bedroom includes a walk-in closet, providing plenty of storage. Enjoy the added bonus of a walk-out basement and relax on the deck overlooking a private, wooded backdrop—perfect for entertaining or unwinding. With a 2-car garage and great overall layout, this home offers the space and features today’s buyers are looking for. Being sold as-is, but full of value and move-in ready appeal—don’t miss this one!
-
2026-05-06status Pending 633-char remark
Show marketing remark (633 chars)
Beautiful 3 bed, 2 bath home that truly checks all the boxes! Featuring stylish hardwood-style flooring and a cozy fireplace, this home offers both comfort and charm throughout. The spacious primary bedroom includes a walk-in closet, providing plenty of storage. Enjoy the added bonus of a walk-out basement and relax on the deck overlooking a private, wooded backdrop—perfect for entertaining or unwinding. With a 2-car garage and great overall layout, this home offers the space and features today’s buyers are looking for. Being sold as-is, but full of value and move-in ready appeal—don’t miss this one!
-
2026-04-16$189,500 Active 633-char remark
Show marketing remark (633 chars)
Beautiful 3 bed, 2 bath home that truly checks all the boxes! Featuring stylish hardwood-style flooring and a cozy fireplace, this home offers both comfort and charm throughout. The spacious primary bedroom includes a walk-in closet, providing plenty of storage. Enjoy the added bonus of a walk-out basement and relax on the deck overlooking a private, wooded backdrop—perfect for entertaining or unwinding. With a 2-car garage and great overall layout, this home offers the space and features today’s buyers are looking for. Being sold as-is, but full of value and move-in ready appeal—don’t miss this one!
-
2020-09-28price $59,500 29-char remark
Show marketing remark (29 chars)
For comparable purposes only.
-
2020-06-11soldstatus $90,000
-
2020-06-03soldstatus $79,750
-
2020-05-19price $49,500 29-char remark
Show marketing remark (29 chars)
For comparable purposes only.
-
2020-05-19$44,500 29-char remark
Show marketing remark (29 chars)
For comparable purposes only.
-
2020-04-30soldstatus Closed 29-char remark
Show marketing remark (29 chars)
For comparable purposes only.
ⓘ Source: listings_history table (triggers on properties + properties_extension) + one-shot
backfill from property_details.listing_events for pre-trigger history.
Tax reassessment forecast MO · Resets to sale price
- Current annual tax
- $2,829 · $236/mo
- Projected year-2 tax
- $2,829 · $236/mo
- Expected delta
- $0/yr ($0/mo · 0.0%)
ⓘ Screening estimate from a state-policy table — verify with the county assessor before closing.
Climate risk First Street
- Flood 1/10 Low FEMA zone X (unshaded) · 0% chance over 30 yrs
- Wildfire 1/10 Low
- Heat 4/10 Moderate 7 d/yr ≥106°F today · 20 d/yr by 30 yrs out
- Wind 2/10 Low 100% chance of damaging wind over 30 yrs
- Air quality 3/10 Moderate 3 unhealthy d/yr today · 5 by 30 yrs out
Nearby sold comps map
Loading sold comps map…
Walkable amenities ~0.75 mi
Loading nearby amenities…
Taxation est. · year 1
- Rental income
- $22,270
- − Mortgage interest
- −$10,615
- − Property taxes
- −$2,829
- − Insurance
- −$948
- − Repairs & maintenance
- −$1,782
- − Management
- −$1,782
- − Depreciation
- −$5,513
- Taxable loss
- −$1,198
- Est. tax savings @ 24.0%
- +$288
- After-tax cash flow
- $2,178/yr
For passive investors: Depreciation is non-cash, so a rental often shows a tax loss while cash-flowing — sheltering income. Rental losses are passive: they offset passive income freely, and up to $25,000/yr can offset ordinary (W-2) income if you actively participate and your MAGI is under $100k (phasing out to $0 by $150k); unused losses carry forward. On sale, claimed depreciation is recaptured at up to 25%, and gains may owe capital-gains tax (a 1031 exchange can defer both). Figures are a year-1 estimate at your 24.0% rate — not tax advice; consult a CPA.
Schools (NCES district)
- District
- Hazelwood
- NCES district ID
- 2913830
- Math proficiency
- 11% ▼ -13.00%
- Reading proficiency
- 26% ▼ -6.00%
- Median HH income
- $51,621
- Composite
- 16.77/100
- National rank
- #9156
- State rank
- #306 of 324 in MO
Livability — Black Jack
- Score
- 70/100
- State rank
- #132
- US rank
- #7706
Category grades
Schools grade is shown separately in the Schools card above.
Census & demographics
- Census place
- Black Jack, MO
- County
- Saint Louis County · 888,823 people
- City population
- 69,104
- Metro
- St. Louis, MO-IL
- Population (ZIP)
- 43,056
- Household income
- $66,776
- Rent vs Own
- Severe rent burden
- 1429.0
Population outlook (St. Louis County) Hauer SSP2
- Today (2025)
- 1,025,227 people
- By 2030
- 1,028,023 · +0.3%
- By 2040
- 1,020,940 · -0.4%
- By 2050
- 1,007,280 · -1.8%
- By 2075
- 987,277 · -3.7%
- By 2100
- 921,984 · -10.1%
Race, ethnicity, and origin ACS 2023
- Neighborhood character
- Predominantly Black (71%)
- Race & ethnicity
- Black 71% White 23% Two or more races 4% Hispanic / Latino 1%
- Common ancestry
- Romanian 1% Lithuanian 1% Italian 1%
- Foreign-born
- 3% · Canada, Vietnam
- Languages at home
- 95% English-only · Spanish 1% French/Haitian/Cajun 1%
Political lean MEDSL · St. Louis
- 2024 margin
- Strong D (+23.4) · D 60.8% · R 37.4% · Other 1.7%
- 2008→2024 swing
- +3.5pp toward D · 2008: 19.9pp · 2024: 23.4pp
- All cycles
- 2024: D+23.4 2020: D+24.0 2016: D+16.2 2012: D+13.7 2008: D+19.9
Not yet ingested
- Civics
- —
Market trends
- HPI YoY
- ▲ 13.78%
- Current HPI
- 570.6
- Rent YoY
- ▲ 7.51%
- Metro
- St. Louis, MO-IL
- State GDP YoY
- ▲ 1.84%
- F500 in state
- 20
Industry mix (Fortune 500 HQ in MO)
| Industry | F500 HQs | Revenue |
|---|---|---|
| Healthcare | 1 | $163B |
|
||
| Insurance | 1 | $21B |
|
||
| Industrial Technology | 1 | $17B |
|
||
| Retail | 1 | $16B |
|
||
| Industrial Distribution | 1 | $10B |
|
||
| Utilities | 1 | $9B |
|
||
Price history
+325.8% since first listed9 events — show timeline
- 2026-05-08 Relisted — MARIS as Distributed by MLS Grid
- 2026-05-06 Pending — MARIS as Distributed by MLS Grid
- 2026-04-16 Listed $189,500 MARIS as Distributed by MLS Grid
- 2020-09-28 Price Changed $59,500 MARIS as Distributed by MLS Grid
- 2020-06-11 Sold (Public Records) $90,000 Public Records
- 2020-06-03 Sold (Public Records) $79,750 Public Records
- 2020-05-19 Price Changed $49,500 MARIS as Distributed by MLS Grid
- 2020-05-19 Listed $44,500 MARIS as Distributed by MLS Grid
- 2020-04-30 Sold (MLS) — MARIS as Distributed by MLS Grid
Property tax history
+2.2%/yrLatest (2022): $2,829 · +4.6% YoY. Source: county tax records.
Cash-flow waterfall
monthlySold comps — $/sqft
last 12 mo · ≤1 miLoading sold comps…