4126 Cardoon Dr · Elfers, FL
Flood risk 1/10 · Minimal
- FEMA flood zone
- X (unshaded)
- Chance of flooding over 30 yrs
- 0.0%
- Est. flood insurance / yr
- $507 – $1,088
Fire risk 2/10 · Minimal
- Est. fire insurance / yr
- $947 – $1,759
Heat risk 10/10 · Severe
- Hot days now (above 108°F)
- 6 days/yr
- Hot days in 30 yrs
- 24 days/yr
Wind risk 10/10 · Severe
- Chance of severe wind over 30 yrs
- 99.0%
Air-quality risk 2/10 · Minimal
- Unhealthy air days now
- 1 days/yr
- Unhealthy air days in 30 yrs
- 1 days/yr
Risk factors via First Street. Map © Google.
Why this score? — see what drove the C+ grade
The composite is a weighted blend of 9 inputs, each scored 0–100. Each bar is that input's sub-score; the figure is the points it added to the 100-point composite (weight × sub-score).
- Cash flow +30.0/30.0
- DSCR +10.0/10.0
- 1% rule +8.8/10.0
- Schools +4.3/10.0
- Livability +3.9/5.0
- Condition / age +2.5/5.0
- Rent growth +1.8/5.0
- ARV discount +0.0/15.0
- Appreciation +0.0/10.0
$93,500
🖨 Deal sheet 📄 Offer letter ✓ Due diligence
Listing remarks MLS
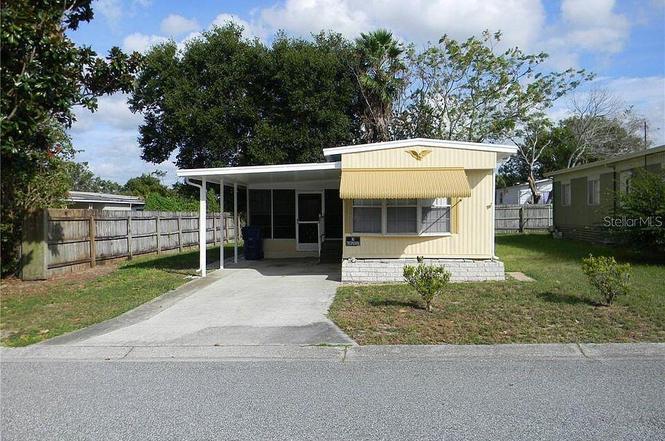
Great investment opportunity. 2 bedroom 1 and half bath manufactured home. Features screen in porch and separate outside laundry room. Needs a little loving, but what do you want for this price? Come and check it out!
Key facts
- Screened in porch
- Eat in kitchen
- Owned land
Tags
Property features AI
Finance
- Other: Zoning: R1-MH (Residential single family housing); Lot size: 0.9 acres
- Financial info: Not specified
- HOA & community: Subdivision: Virginia Park
Exterior
- Parking: Attached carport with 2 carport spaces
- Security: Not specified
- Utilities: Public water available; Septic tank sewer; 200+ amp electric service; Cable available; Electricity connected; Sewer connected; Water available
- Home design: Manufactured mobile home (residential); Attached property
- Construction: Vinyl siding
- Exterior features: Wood fencing enclosing yard; Cleared lot
Interior
- Kitchen: Electric range; Refrigerator
- Bedrooms: Not specified
- Flooring: Carpet; Vinyl
- Bathrooms: 1 full bathroom
- Heating & cooling: Central heating; Central air conditioning
- Interior features: Electric water heater; 3 total rooms
- Laundry & utility: Washer hookup in unit; Electric dryer hookup
Neighborhood map
What this means for you Summary
Snapshot
- This is a 2-bed/2.0-bath manufactured listed at $94k.
Deal economics
- At list price, monthly cash flow is $407 ($5k/yr) — positive.
- The deal already cash-flows at list — no discount required.
- Meets the 1% rule at list price ($1k rent vs $94k).
- Recommended offer: $91k (3.0% below list) — sets the bar for market timing.
- Cap rate 11.5% vs local median 4.7% in Elfers — top-decile yield for the area; either an underpriced asset or a hidden risk that comps aren't pricing in. Stress-test before assuming the spread holds.
Location & tenants
- Location reads 78/100 on livability (#167 in FL, #2,486 nationally) — a middle-class / working-renter tenant base. Strengths: cost of living A+, housing A+, health & safety A+; Watch: crime C-, employment D+, amenities D-.
- Pasco (suburban): math 50% / reading 52% proficiency, ranked #32 of 73 in FL (top 44%) — acceptable for families but not a draw, mixed tenant base, ~2y average lease.
- Market conditions: Rents soft (-2.9%/yr); 305 active listings in the ZIP; 12 comparable units currently listed for rent nearby; rentals at typical pace (median 22d on market — plan ~3-4 weeks tenant-placement turnaround); 6,765 units permitted in Pasco County in 2024 (1,250 in 5+ unit buildings).
- This rent runs 31% of the median local income ($50k/yr) — at the standard rent-burdened threshold; future hikes will face affordability resistance.
Forward outlook
- Local home prices are declining (-3.0%/yr); year-one equity from $646 of loan paydown is wiped out by about $3k of value loss. Plan a longer hold.
- Pasco County population projected at +29% by 2050 — long-run rental-demand tailwind backs the buy-and-hold thesis.
- At projected returns (-3.0% appreciation + 0.0% rent growth), your $26k cash investment doubles in ~9 years — after that, you're playing with house money.
Negotiation context
- It's been on market 57 days — a 3% lower offer ($91k) is reasonable based on typical stale-listing flexibility.
- 4 sale attempts since 21y ago with the ask held roughly flat each time — persistent listings suggest the price (not the market) is what's stuck; bring a comps-based counter.
- Current owner paid $67k; 40% above their basis — modest negotiation headroom, anchor on the comps not their cost.
Risks & watch-outs
- Climate carrying-cost: severe wind risk, 99% chance of damaging wind over 30y; extreme-heat days projected 6→24/yr by 2055 (HVAC capex compounding) — expect insurance premiums to compound above CPI over the hold.
Questions for the listing agent
- It's been on market 57 days. Have you received any prior offers? Is the seller open to a 3% concession, seller financing, or rate buy-down credit?
- Is there a deadline driving the sale (1031 exchange, divorce, estate, relocation)? That informs how much negotiation room exists.
- What's the average days-on-market for RENTAL listings here right now (not sales)? A rising rental-DOM trend means longer vacancies and softer asking-rent achievability than the comps imply.
- What's the recent tenant-quality profile in this submarket — average credit score on applications, eviction rate, late-payment / NSF rate, and stable-employment percentage? A property-management company in the area should have these aggregated.
- How much new for-sale + rental construction is in the pipeline within 1–3 miles? Heavy new supply typically softens prices + rents 12–24 months out; constrained supply supports both.
Investment metrics
- 1% rule
- 1.38% ✓
- Cap rate
- 11.51%
- Cash-on-cash
- 18.64%
- DSCR
- 1.83
- GRM
- 6.0
CMA / ARV
- ARV (on-the-fly)
- $69,216
- Comps found
- 3
Show comp detail 3 sales within ~0.75 mi
| Address | Dist | Beds/Ba | Sqft | Sold | Price | $/sf | Match |
|---|---|---|---|---|---|---|---|
| 4100 Cardoon Dr | 0.05mi | 2/1.5 | 672 (0%) | 21mo | $60,000 | $89 | 79 |
| 5713 Sunshine Park Dr | 0.68mi | 2/1.5 | 672 (0%) | 4mo | $69,000 | $103 | 63 |
| 4239 Memphis Ave | 0.42mi | 2/1.5 | 600 (-11%) | 2mo | $70,000 | $117 | 59 |
Match score weights: distance 35% · size 25% · config 20% · recency 20%. Top-matched comps best support the ARV.
Projected returns pro-forma
-3.0% appreciation · 0.0% rent growth · sell at horizon
- IRR
- 7.1%
- Equity multiple
- 1.27×
- Total profit
- $6,967
- Equity at exit
- $13,941
- IRR
- 13.7%
- Equity multiple
- 1.95×
- Total profit
- $24,781
- Equity at exit
- $8,084
Cash invested: $26,180 (down + closing). Projections, not guarantees.
Landlord ↔ Tenant lean methodology
- Overall (STATE)
- 87 Strongly Landlord-Friendly
- State Florida
- 87 Strongly Landlord-Friendly · R+3
- County
- — inherits STATE
- City
- — inherits STATE
ZIP-level market 34653
- Home prices YoY
- -18.4%
- Rents YoY
- -2.9%
- Active inventory
- 305
- Price-to-rent
- 6.0×
Monthly cashflow live
- Estimated rent
- $1,293 high interval (Pro) →
- Mortgage (P&I)
- −$490
- Tax from tax record
- −$86 /mo · $1,027/yr
- Insurance
- −$39
- HOA
- −$0
- Vacancy / Maint / Mgmt
- −$272
- Net cashflow
- $407
Break-even live
UW: 25.0% down · 7.5% · 30yr · 1.5% tax · 5.0% vac · 8.0% maint · 8.0% mgmt
Financing live
Cash to close
- Down payment
- $23,375
- Closing costs
- $2,805
- Reserves months
- —
- Total cash needed
- —
Loan-product check · same deal, 3 products live
Conventional
25% down · 7.5% · 30yr
- Down + closing
- —
- Monthly P&I
- —
- Monthly cashflow
- —
- DSCR
- —
- Eligible?
- —
Personal DTI + credit; lowest rate.
DSCR
20% down · 8.5% · 30yr
- Down + closing
- —
- Monthly P&I
- —
- Monthly cashflow
- —
- DSCR
- —
- Eligible?
- —
No personal income docs; deal must DSCR.
Hard money
10% down · 12.0% · 12mo
- Down + closing
- —
- Monthly P&I
- —
- Monthly cashflow
- —
- DSCR
- —
- Eligible?
- —
Short-term bridge; refi at stabilization.
Rent comps 12 comps
| Address | Beds | Baths | Sqft | Rent | $/sqft | DOM | Units | Dist |
|---|---|---|---|---|---|---|---|---|
| 5844 Sunshine Park Dr New Port Richey, FL | 3.0 | 1.0 | 672 | $1,100 | $1.64 | 2d | 1 | 0.60mi |
| 6807 Porter Rd Unit PCG G-202 New Port Richey, FL | 1.0 | 1.0 | 605 | $1,025 | $1.69 | 4d | 1 | 0.91mi |
| 7425 Trouble Creek Rd New Port Richey, FL | 1.0–2.0 | 1.0–2.0 | 812 | $1,604 | $1.97 | 1d | 15 | 1.17mi |
| 4540 Audrey Ln New Port Richey, FL | 2.0 | 1.0 | 750 | $1,150 | $1.53 | 24d | 1 | 1.18mi |
| 4551 Audrey Ln NEW PRT RCHY, FL | 2.0 | 1.0 | 750 | $1,295 | $1.73 | 21d | 1 | 1.18mi |
| 4518 Audrey Ln Unit 4551 New Port Richey, FL | 2.0 | 1.0 | 750 | $1,295 | $1.73 | 21d | 1 | 1.20mi |
| 4529 Audrey Ln New Port Richey, FL | 2.0 | 1.0 | 750 | $1,295 | $1.73 | 21d | 1 | 1.21mi |
| 5333 Pasadena Dr Unit 5333 New Port Richey, FL | 1.0 | 1.0 | 576 | $1,200 | $2.08 | 17d | 1 | 1.25mi |
| 4744 Azalea Dr #204 New Port Richey, FL | 1.0 | 1.0 | 736 | $1,100 | $1.49 | 20d | 1 | 1.26mi |
| 4722 Kennedy Dr New Port Richey, FL | 1.0 | 1.0 | 504 | $850 | $1.69 | 24d | 1 | 1.31mi |
| 7320 Broadmoor Dr New Port Richey, FL | 1.0–2.0 | 1.0–2.0 | 765 | $1,715 | $2.24 | 1d | 59 | 1.33mi |
| 5149 Tangelo Dr Apt B New Port Richey, FL | 1.0 | 1.0 | 350 | $1,195 | $3.41 | 24d | 1 | 1.44mi |
Listing history 14 events
-
2026-05-07status Pending
-
2026-04-14price $93,500
-
2026-03-11$95,000 Active
-
2020-12-02soldstatus $66,875
-
2018-10-26soldstatus $26,000
-
2018-10-05soldstatus $26,000 Sold 217-char remark
Show marketing remark (217 chars)
Great investment opportunity. 2 bedroom 1 and half bath manufactured home. Features screen in porch and separate outside laundry room. Needs a little loving, but what do you want for this price? Come and check it out!
-
2018-09-15status Pending 217-char remark
Show marketing remark (217 chars)
Great investment opportunity. 2 bedroom 1 and half bath manufactured home. Features screen in porch and separate outside laundry room. Needs a little loving, but what do you want for this price? Come and check it out!
-
2018-09-14$34,900 Active 217-char remark
Show marketing remark (217 chars)
Great investment opportunity. 2 bedroom 1 and half bath manufactured home. Features screen in porch and separate outside laundry room. Needs a little loving, but what do you want for this price? Come and check it out!
-
2015-02-03historical Contingent - Other Contract Contingencies
-
2015-01-05price $27,000
-
2014-12-23price $37,000
-
2014-11-26$39,900 Active
-
2005-03-15soldstatus $35,000
-
2005-01-11$35,000
ⓘ Source: listings_history table (triggers on properties + properties_extension) + one-shot
backfill from property_details.listing_events for pre-trigger history.
Tax reassessment forecast FL · Resets to sale price
- Current annual tax
- $1,027 · $86/mo
- Projected year-2 tax
- $1,027 · $86/mo
- Expected delta
- $0/yr ($0/mo · 0.0%)
ⓘ Screening estimate from a state-policy table — verify with the county assessor before closing.
Climate risk First Street
- Flood 1/10 Low FEMA zone X (unshaded) · 0% chance over 30 yrs
- Wildfire 2/10 Low
- Heat 10/10 Extreme 6 d/yr ≥108°F today · 24 d/yr by 30 yrs out
- Wind 10/10 Extreme 99% chance of damaging wind over 30 yrs
- Air quality 2/10 Low 1 unhealthy d/yr today · 1 by 30 yrs out
Nearby sold comps map
Loading sold comps map…
Walkable amenities ~0.75 mi
Loading nearby amenities…
Taxation est. · year 1
- Rental income
- $15,518
- − Mortgage interest
- −$5,237
- − Property taxes
- −$1,027
- − Insurance
- −$468
- − Repairs & maintenance
- −$1,241
- − Management
- −$1,241
- − Depreciation
- −$2,720
- Taxable income
- $3,584
- Est. tax owed @ 24.0%
- −$860
- After-tax cash flow
- $4,021/yr
For passive investors: Depreciation is non-cash, so a rental often shows a tax loss while cash-flowing — sheltering income. Rental losses are passive: they offset passive income freely, and up to $25,000/yr can offset ordinary (W-2) income if you actively participate and your MAGI is under $100k (phasing out to $0 by $150k); unused losses carry forward. On sale, claimed depreciation is recaptured at up to 25%, and gains may owe capital-gains tax (a 1031 exchange can defer both). Figures are a year-1 estimate at your 24.0% rate — not tax advice; consult a CPA.
Schools (NCES district)
- District
- Pasco
- NCES district ID
- 1201530
- Math proficiency
- 50% ▼ -10.00%
- Reading proficiency
- 52% ▼ -5.00%
- Median HH income
- $45,039
- Composite
- 43.14/100
- National rank
- #3074
- State rank
- #32 of 73 in FL
Livability — Elfers
- Score
- 78/100
- State rank
- #167
- US rank
- #2486
Category grades
Schools grade is shown separately in the Schools card above.
Census & demographics
- Census place
- Elfers, FL
- County
- Pasco County · 524,098 people
- Metro
- Tampa-St. Petersburg-Clearwater, FL
- Population (ZIP)
- 35,945
- Household income
- $49,563
- Rent vs Own
- Severe rent burden
- 1439.0
Population outlook (Pasco County) Hauer SSP2
- Today (2025)
- 570,045 people
- By 2030
- 605,844 · +6.3%
- By 2040
- 674,806 · +18.4%
- By 2050
- 736,022 · +29.1%
- By 2075
- 862,900 · +51.4%
- By 2100
- 906,364 · +59.0%
Race, ethnicity, and origin ACS 2023
- Neighborhood character
- Predominantly White (74%)
- Race & ethnicity
- White 74% Hispanic / Latino 14% Two or more races 9% Black 6% Asian 2%
- Hispanic origin (detail)
- Mexican 3% Puerto Rican 4% Cuban 2%
- Common ancestry
- Romanian 3% Lithuanian 2% Slovak 2%
- Foreign-born
- 11% · Canada, Jamaica, China
- Languages at home
- 84% English-only · Spanish 9% Other Indo-European 2% Russian/Polish/Slavic 2%
Political lean MEDSL · Pasco
- 2024 margin
- Strong R (+25.2) · D 36.9% · R 62.1% · Other 1.0%
- 2008→2024 swing
- -21.6pp toward R · 2008: -3.6pp · 2024: -25.2pp
- All cycles
- 2024: R+25.2 2020: R+20.1 2016: R+21.6 2012: R+6.7 2008: R+3.6
Not yet ingested
- Civics
- —
Market trends
- HPI YoY
- ▼ -73.10%
- Current HPI
- 324.6519
- Rent YoY
- ▼ -2.92%
- Metro
- Tampa-St. Petersburg-Clearwater, FL
- State GDP YoY
- ▲ 3.28%
- F500 in state
- 36
Industry mix (Fortune 500 HQ in FL)
| Industry | F500 HQs | Revenue |
|---|---|---|
| Industrial Technology | 2 | $29B |
|
||
| Insurance | 2 | $17B |
|
||
| Retail | 1 | $60B |
|
||
| Technology Distribution | 1 | $58B |
|
||
| Homebuilding | 1 | $35B |
|
||
| Technology Manufacturing | 1 | $35B |
|
||
Price history
+167.1% since first listed14 events — show timeline
- 2026-05-07 Pending — HCAR
- 2026-04-14 Price Changed $93,500 HCAR
- 2026-03-11 Listed $95,000 HCAR
- 2020-12-02 Sold (Public Records) $66,875 Public Records
- 2018-10-26 Sold (Public Records) $26,000 Public Records
- 2018-10-05 Sold (MLS) $26,000 Stellar MLS as Distributed by MLS Grid
- 2018-09-15 Pending — Stellar MLS as Distributed by MLS Grid
- 2018-09-14 Listed $34,900 Stellar MLS as Distributed by MLS Grid
- 2015-02-03 Contingent — Stellar MLS as Distributed by MLS Grid
- 2015-01-05 Price Changed $27,000 Stellar MLS as Distributed by MLS Grid
- 2014-12-23 Price Changed $37,000 Stellar MLS as Distributed by MLS Grid
- 2014-11-26 Listed $39,900 Stellar MLS as Distributed by MLS Grid
- 2005-03-15 Sold (MLS) $35,000 Stellar MLS as Distributed by MLS Grid
- 2005-01-11 Listed $35,000 Stellar MLS as Distributed by MLS Grid
Property tax history
+5.9%/yrLatest (2025): $1,027 · +2.0% YoY. Source: county tax records.
Cash-flow waterfall
monthlySold comps — $/sqft
last 12 mo · ≤1 miLoading sold comps…