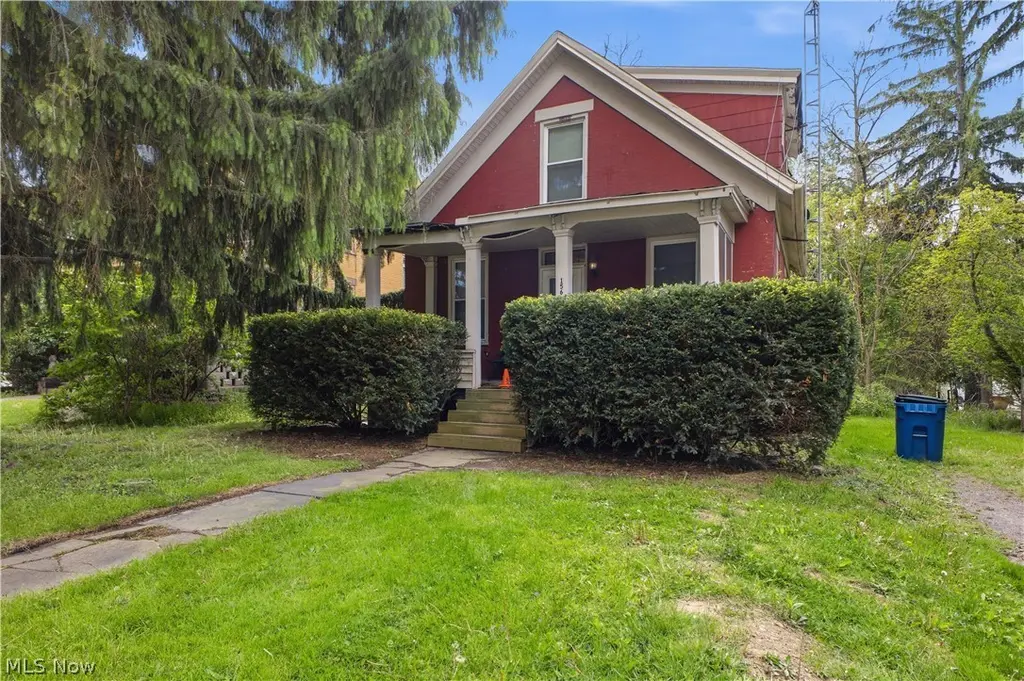
1561 E State St · Salem, OH
Flood risk 6/10 · Moderate
- FEMA flood zone
- X (unshaded)
- Chance of flooding over 30 yrs
- 0.71%
- Est. flood insurance / yr
- $473 – $860
Fire risk 1/10 · Minimal
- Est. fire insurance / yr
- $713 – $1,323
Heat risk 3/10 · Minor
- Hot days now (above 96°F)
- 7 days/yr
- Hot days in 30 yrs
- 17 days/yr
Wind risk 1/10 · Minimal
- Chance of severe wind over 30 yrs
- —
Air-quality risk 2/10 · Minimal
- Unhealthy air days now
- 1 days/yr
- Unhealthy air days in 30 yrs
- 2 days/yr
Risk factors via First Street. Map © Google.
Why this score? — see what drove the C- grade
The composite is a weighted blend of 9 inputs, each scored 0–100. Each bar is that input's sub-score; the figure is the points it added to the 100-point composite (weight × sub-score).
- Cash flow +21.0/30.0
- ARV discount +7.5/15.0
- 1% rule +6.8/10.0
- DSCR +6.7/10.0
- Schools +4.6/10.0
- Livability +3.4/5.0
- Rent growth +2.5/5.0
- Condition / age +2.5/5.0
- Appreciation +0.0/10.0
$75,000
🖨 Deal sheet (PDF) 📄 Offer letter ✓ Due diligence
Listing remarks MLS
Great investment property in the heart of Salem! This all brick home features three bedrooms. Two fireplaces on the first floor. Kitchen features an addition that could be used as a pantry or storage area. Take time to view this home today!
Key facts
- Near schools
- Unique floor plan
- Private oasis
Tags
Property features AI
Exterior
- Parking: Driveway (unpaved)
- Utilities: Public water; Public sewer
- Home design: Two-story single-family home; Entry on first floor
- Construction: Built in public-records year (2-story); Brick and frame construction with shake and wood siding; Block, brick/mortar, and stone foundation; Asphalt fiberglass roof
- Exterior features: Back yard; Front porch
Interior
- Kitchen: Range
- Bedrooms: Three bedrooms on the second floor (approx. 11x9, 11x9, and 10x9)
- Bathrooms: One full bathroom
- Heating & cooling: Forced-air gas heating
- Interior features: Decorative fireplace in the dining room; Full unfinished basement with interior and exterior entry and walk-out access; Front porch
- Laundry & utility: Laundry located in the basement
Neighborhood map
What this means for you Summary
Snapshot
- This is a 3-bed/1.0-bath single-family listed at $75k.
Deal economics
- At list price, monthly cash flow is $105 ($1k/yr) — positive.
- The deal already cash-flows at list — no discount required.
- Meets the 1% rule at list price ($881 rent vs $75k).
- Recommended offer: $73k (3.0% below list) — sets the bar for market timing.
- Cap rate 8.0% vs local median 2.7% in Salem — top-decile yield for the area; either an underpriced asset or a hidden risk that comps aren't pricing in. Stress-test before assuming the spread holds.
Location & tenants
- Location reads 68/100 on livability (#538 in OH) — a middle-class / working-renter tenant base. Strengths: cost of living A+, housing A, crime B; Watch: amenities F, commute F, employment F.
- Salem City (town): math 53% / reading 56% proficiency, ranked #389 of 656 in OH (top 59%) — acceptable for families but not a draw, mixed tenant base, ~2y average lease.
- Zoned schools: Buckeye Elementary School (431 students, 0% FRL); Salem Junior High School (math 51% / reading 52%, grade C, #401 of 654 statewide, top 62%, 310 students, 54% FRL); Salem High School (math 47% / reading 77%, grade B-, #202 of 781 statewide, top 29%, 638 students, 42% FRL) — zoned schools average 32% FRL vs 48% district-wide (17 pts lower); this property's tenant base skews higher-income than the district average.
- Market conditions: 91 active listings in the ZIP; 3 comparable units currently listed for rent nearby; rentals at typical pace (median 15d on market — plan ~3-4 weeks tenant-placement turnaround); 49 units permitted in Columbiana County in 2024 (0 in 5+ unit buildings).
- This rent is only 18% of the median local income ($60k/yr) — well below the 30% rent-burden line; pricing power to push rent on renewal without tenant pushback.
Forward outlook
- Local home prices are declining (-3.0%/yr); year-one equity from $519 of loan paydown is wiped out by about $2k of value loss. Plan a longer hold.
- Columbiana County population projected at -23% by 2050 — secular population decline; favor cash flow + early exit over multi-decade hold.
Negotiation context
- It's been on market 43 days — a 3% lower offer ($73k) is reasonable based on typical stale-listing flexibility.
- 3 sale attempts since 8y ago with the ask held roughly flat each time — persistent listings suggest the price (not the market) is what's stuck; bring a comps-based counter.
- Current owner paid $30k; list at $75k implies a 150% gain — meaningful room to come down on a strong offer.
Risks & watch-outs
- Watch-outs: property tax is 2.7% of price; built in 1908 — expect roof / HVAC / electrical / plumbing capex.
- Climate carrying-cost: major flood risk — expect insurance premiums to compound above CPI over the hold.
Questions for the listing agent
- It's been on market 43 days. Have you received any prior offers? Is the seller open to a 3% concession, seller financing, or rate buy-down credit?
- Built in 1908 — when were the roof, HVAC, electrical panel, plumbing, and water heater last replaced?
- Property tax is high relative to price — has the assessment been appealed recently, and will the sale trigger a re-assessment?
- Is there a deadline driving the sale (1031 exchange, divorce, estate, relocation)? That informs how much negotiation room exists.
- Schools are B-rated — typically a magnet for longer-tenancy family renters. What's the average tenant stay here, and is there a school-zone premium baked into asking?
- What's the average days-on-market for RENTAL listings here right now (not sales)? A rising rental-DOM trend means longer vacancies and softer asking-rent achievability than the comps imply.
- What's the recent tenant-quality profile in this submarket — average credit score on applications, eviction rate, late-payment / NSF rate, and stable-employment percentage? A property-management company in the area should have these aggregated.
- How much new for-sale + rental construction is in the pipeline within 1–3 miles? Heavy new supply typically softens prices + rents 12–24 months out; constrained supply supports both.
Investment metrics
- 1% rule
- 1.18% ✓
- Cap rate
- 7.98%
- Cash-on-cash
- 6.02%
- DSCR
- 1.27
- GRM
- 7.1
CMA / ARV
- ARV (median comp)
- $157,164
- List price
- $75,000
- Delta
- -52.28%
- Verdict
- UNDERPRICED
- Comps
- 20 within 1.0 mi
Show comp detail 12 sales within ~0.75 mi
| Address | Dist | Beds/Ba | Sqft | Sold | Price | $/sf | Match |
|---|---|---|---|---|---|---|---|
| 427 S Union Ave | 0.27mi | 3/1.0 | 1,352 (+5%) | 1mo | $148,700 | $110 | 78 |
| 443 S Union Ave | 0.27mi | 3/1.0 | 1,152 (-10%) | 8mo | $72,000 | $63 | 63 |
| 1828 E 3rd St | 0.26mi | 3/2.0 | 1,404 (+9%) | 8mo | $200,000 | $142 | 62 |
| 512 N Union Ave | 0.36mi | 3/1.5 | 1,128 (-12%) | 2mo | $245,000 | $217 | 59 |
| 845 Adams Ave | 0.42mi | 3/2.0 | 1,444 (+12%) | 2mo | $198,000 | $137 | 54 |
| 927 E 6th St | 0.61mi | 3/1.0 | 1,440 (+12%) | 7mo | $118,450 | $82 | 46 |
| 242 Vine St | 0.59mi | 3/1.0 | 1,472 (+15%) | 4mo | $65,000 | $44 | 45 |
| 807 E Third St | 0.60mi | 3/2.0 | 1,456 (+13%) | 2mo | $220,000 | $151 | 44 |
| 1009 E 6th St | 0.56mi | 4/1.5 (+1) | 1,452 (+13%) | 2mo | $179,000 | $123 | 43 |
| 2337 Oak St | 0.61mi | 3/1.0 | 1,108 (-14%) | 7mo | $210,000 | $190 | 43 |
| 966 Park Ave | 0.46mi | 2/2.0 (-1) | 1,108 (-14%) | 6mo | $165,000 | $149 | 41 |
| 937 Homewood Ave | 0.63mi | 2/2.0 (-1) | 1,118 (-13%) | 5mo | $163,000 | $146 | 36 |
Match score weights: distance 35% · size 25% · config 20% · recency 20%. Top-matched comps best support the ARV.
Projected returns pro-forma
-3.0% appreciation · 3.0% rent growth · sell at horizon
- IRR
- -6.9%
- Equity multiple
- 0.74×
- Total profit
- $-5,387
- Equity at exit
- $11,183
- IRR
- 2.8%
- Equity multiple
- 1.20×
- Total profit
- $4,183
- Equity at exit
- $6,485
Cash invested: $21,000 (down + closing). Projections, not guarantees.
Landlord ↔ Tenant lean methodology
- Overall (STATE)
- 73 Landlord-Friendly
- State Ohio
- 73 Landlord-Friendly · R+6
- County
- — inherits STATE
- City
- — inherits STATE
ZIP-level market 44460
- Home prices YoY
- -32.5%
- Active inventory
- 91
- Price-to-rent
- 7.1×
Monthly cashflow live
- Estimated rent
- $881 medium interval (Pro) →
- Mortgage (P&I)
- −$393
- Tax from tax record
- −$166 /mo · $1,998/yr
- Insurance
- −$31
- HOA
- −$0
- Vacancy / Maint / Mgmt
- −$185
- Net cashflow
- $105
Break-even live
Sensitivity live
| Price | -10% $148 | -5% $127 | +0% $105 | +5% $84 | +10% $63 |
|---|---|---|---|---|---|
| Rent | -10% $36 | -5% $71 | +0% $105 | +5% $140 | +10% $175 |
| Rate | -1.0pp $143 | -0.5pp $124 | base $105 | +0.5pp $86 | +1.0pp $66 |
UW: 25.0% down · 7.5% · 30yr · 1.5% tax · 5.0% vac · 8.0% maint · 8.0% mgmt
Financing live
Cash to close
- Down payment
- $18,750
- Closing costs
- $2,250
- Reserves months
- —
- Total cash needed
- —
Loan-product check · same deal, 3 products live
Conventional
25% down · 7.5% · 30yr
- Down + closing
- —
- Monthly P&I
- —
- Monthly cashflow
- —
- DSCR
- —
- Eligible?
- —
Personal DTI + credit; lowest rate.
DSCR
20% down · 8.5% · 30yr
- Down + closing
- —
- Monthly P&I
- —
- Monthly cashflow
- —
- DSCR
- —
- Eligible?
- —
No personal income docs; deal must DSCR.
Hard money
10% down · 12.0% · 12mo
- Down + closing
- —
- Monthly P&I
- —
- Monthly cashflow
- —
- DSCR
- —
- Eligible?
- —
Short-term bridge; refi at stabilization.
Rent comps 3 comps
| Address | Beds | Baths | Sqft | Rent | $/sqft | DOM | Units | Dist |
|---|---|---|---|---|---|---|---|---|
| 339 S Union Ave Salem, OH | 2.0 | 1.0 | 982 | $895 | $0.91 | 15d | 1 | 0.25mi |
| 1271 Cedar Ridge Dr Apt B Salem, OH | 2.0 | 1.5 | 1060 | $900 | $0.85 | 22d | 1 | 0.78mi |
| 335 S Broadway Ave Salem, OH | 2.0 | 1.0 | 1245 | $825 | $0.66 | 15d | 1 | 0.89mi |
Listing history 23 events
-
2026-06-21days on market $75,000 Active 43 DOM
-
2026-06-21days on market $75,000 Active 42 DOM
-
2026-06-18days on market $75,000 Active 40 DOM
-
2026-06-17days on market $75,000 Active 39 DOM
-
2026-06-16days on market $75,000 Active 38 DOM
-
2026-06-15days on market $75,000 Active 37 DOM
-
2026-06-13days on market $75,000 Active 35 DOM
-
2026-06-12days on market $75,000 Active 34 DOM
-
2026-06-09days on market $75,000 Active 31 DOM
-
2026-06-08days on market $75,000 Active 30 DOM
-
2026-06-08days on market $75,000 Active 29 DOM
-
2026-06-05days on market $75,000 Active 27 DOM
-
2026-06-04days on market $75,000 Active 25 DOM
-
2026-06-02days on market $75,000 Active 24 DOM
-
2026-06-01days on market $75,000 Active 23 DOM
-
2026-05-31days on market $75,000 Active 22 DOM
-
2026-05-07$75,000 Active 1271-char remark
-
2019-10-29soldstatus $30,000 Closed 240-char remark
Show marketing remark (240 chars)
Great investment property in the heart of Salem! This all brick home features three bedrooms. Two fireplaces on the first floor. Kitchen features an addition that could be used as a pantry or storage area. Take time to view this home today!
-
2019-09-18historical 240-char remark
Show marketing remark (240 chars)
Great investment property in the heart of Salem! This all brick home features three bedrooms. Two fireplaces on the first floor. Kitchen features an addition that could be used as a pantry or storage area. Take time to view this home today!
-
2019-08-19historical Contingent 240-char remark
Show marketing remark (240 chars)
Great investment property in the heart of Salem! This all brick home features three bedrooms. Two fireplaces on the first floor. Kitchen features an addition that could be used as a pantry or storage area. Take time to view this home today!
-
2019-03-18$42,000 Active 240-char remark
Show marketing remark (240 chars)
Great investment property in the heart of Salem! This all brick home features three bedrooms. Two fireplaces on the first floor. Kitchen features an addition that could be used as a pantry or storage area. Take time to view this home today!
-
2018-11-30historical
-
2018-05-30$49,500 Active
ⓘ Source: listings_history table (triggers on properties + properties_extension) + one-shot
backfill from property_details.listing_events for pre-trigger history.
Tax reassessment forecast OH · Partial reset (capped growth)
- Current annual tax
- $1,998 · $166/mo
- Projected year-2 tax
- $1,998 · $166/mo
- Expected delta
- $0/yr ($0/mo · 0.0%)
ⓘ Screening estimate from a state-policy table — verify with the county assessor before closing.
Climate risk First Street
- Flood 6/10 Major FEMA zone X (unshaded) · 71% chance over 30 yrs
- Wildfire 1/10 Low
- Heat 3/10 Moderate 7 d/yr ≥96°F today · 17 d/yr by 30 yrs out
- Wind 1/10 Low
- Air quality 2/10 Low 1 unhealthy d/yr today · 2 by 30 yrs out
Nearby sold comps map
Loading sold comps map…
Walkable amenities ~0.75 mi
Loading nearby amenities…
Taxation est. · year 1
- Rental income
- $10,578
- − Mortgage interest
- −$4,201
- − Property taxes
- −$1,998
- − Insurance
- −$375
- − Repairs & maintenance
- −$846
- − Management
- −$846
- − Depreciation
- −$2,182
- Taxable income
- $130
- Est. tax owed @ 24.0%
- −$31
- After-tax cash flow
- $1,233/yr
For passive investors: Depreciation is non-cash, so a rental often shows a tax loss while cash-flowing — sheltering income. Rental losses are passive: they offset passive income freely, and up to $25,000/yr can offset ordinary (W-2) income if you actively participate and your MAGI is under $100k (phasing out to $0 by $150k); unused losses carry forward. On sale, claimed depreciation is recaptured at up to 25%, and gains may owe capital-gains tax (a 1031 exchange can defer both). Figures are a year-1 estimate at your 24.0% rate — not tax advice; consult a CPA.
Schools (NCES district)
- District
- Salem City
- NCES district ID
- 3910006
- Math proficiency
- 53% ▼ -14.00%
- Reading proficiency
- 56% ▼ -12.00%
- Median HH income
- $41,145
- Composite
- 45.66/100
- National rank
- #2582
- State rank
- #389 of 656 in OH
Livability — Salem
- Score
- 68/100
- State rank
- #538
- US rank
- #9073
Category grades
Schools grade is shown separately in the Schools card above.
Census & demographics
- Census place
- Salem, OH
- County
- Columbiana · 99,532 people
- City population
- 25,289
- Population (ZIP)
- 25,289
- Household income
- $59,882
- Rent vs Own
- Severe rent burden
- 9.0
Population outlook (Columbiana County) Hauer SSP2
- Today (2025)
- 98,353 people
- By 2030
- 94,225 · -4.2%
- By 2040
- 85,169 · -13.4%
- By 2050
- 76,157 · -22.6%
- By 2075
- 58,451 · -40.6%
- By 2100
- 42,805 · -56.5%
Race, ethnicity, and origin ACS 2023
- Neighborhood character
- Predominantly White (96%)
- Race & ethnicity
- White 96% Two or more races 2%
- Common ancestry
- Slovak 4% Lithuanian 3% Romanian 2%
- Foreign-born
- 1% · Canada
- Languages at home
- 98% English-only · Spanish 1%
Political lean MEDSL · Columbiana
- 2024 margin
- Solid R (+49.0) · D 25.1% · R 74.1%
- 2008→2024 swing
- -41.4pp toward R · 2008: -7.6pp · 2024: -49.0pp
- All cycles
- 2024: R+49.0 2020: R+44.9 2016: R+41.6 2012: R+12.0 2008: R+7.6
Not yet ingested
- Civics
- —
Market trends
- HPI YoY
- ▼ -102.42%
- Current HPI
- 212.8922
- Rent YoY
- —
- Metro
- —
- State GDP YoY
- ▲ 1.98%
- F500 in state
- 48
Industry mix (Fortune 500 HQ in OH)
| Industry | F500 HQs | Revenue |
|---|---|---|
| Insurance | 3 | $145B |
|
||
| Industrial Machinery | 3 | $49B |
|
||
| Financial Services | 3 | $24B |
|
||
| Consumer Goods | 2 | $93B |
|
||
| Aerospace / Defense | 2 | $47B |
|
||
| Utilities | 2 | $33B |
|
||
Price history
+51.5% since first listed7 events — show timeline
- 2026-05-07 Listed $75,000 MLSNOW
- 2019-10-29 Sold (MLS) $30,000 MLSNOW
- 2019-09-18 Listing Removed — MLSNOW
- 2019-08-19 Contingent — MLSNOW
- 2019-03-18 Listed $42,000 MLSNOW
- 2018-11-30 Listing Removed — MLSNOW
- 2018-05-30 Listed $49,500 MLSNOW
Property tax history
+5.3%/yrLatest (2025): $1,998 · +28.4% YoY. Source: county tax records.
Cash-flow waterfall
monthlySold comps — $/sqft
last 12 mo · ≤1 miLoading sold comps…