 Multi-family
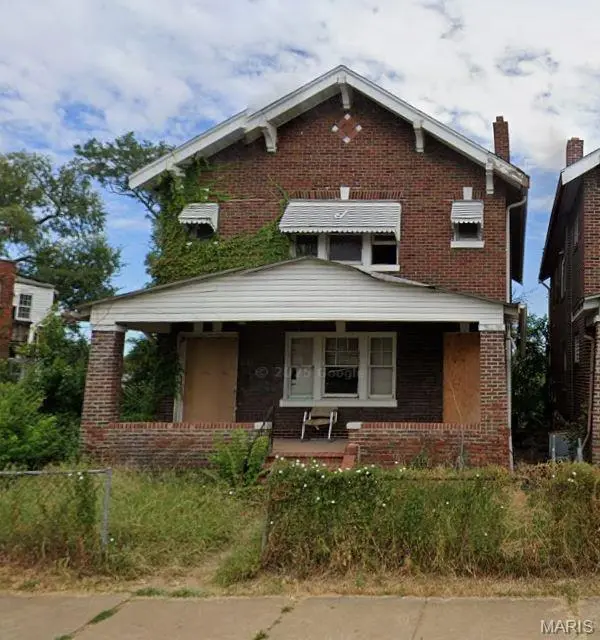
5723 Labadie Ave · St. Louis, MO
Flood risk 1/10 · Minimal
- FEMA flood zone
- X (unshaded)
- Chance of flooding over 30 yrs
- 0.0%
- Est. flood insurance / yr
- $473 – $860
Fire risk 1/10 · Minimal
- Est. fire insurance / yr
- $1,054 – $1,958
Heat risk 5/10 · Moderate
- Hot days now (above 107°F)
- 7 days/yr
- Hot days in 30 yrs
- 21 days/yr
Wind risk 2/10 · Minimal
- Chance of severe wind over 30 yrs
- 1.0%
Air-quality risk 4/10 · Minor
- Unhealthy air days now
- 4 days/yr
- Unhealthy air days in 30 yrs
- 5 days/yr
Risk factors via First Street. Map © Google.
Why this score? — see what drove the D+ grade
The composite is a weighted blend of 9 inputs, each scored 0–100. Each bar is that input's sub-score; the figure is the points it added to the 100-point composite (weight × sub-score).
- Cash flow +15.0/30.0
- ARV discount +7.5/15.0
- Appreciation +5.3/10.0
- 1% rule +5.0/10.0
- DSCR +5.0/10.0
- Rent growth +2.5/5.0
- Livability +2.5/5.0
- Condition / age +2.5/5.0
- Schools +1.2/10.0
$15,000
🖨 Deal sheet 📄 Offer letter ✓ Due diligence
Multi-family units
County records classify this as Multi-Family (2-4 Unit). Listing-text estimate: 1 unit. estimate disagrees with records
Listing remarks MLS
Brick duplex in need of repair. Property to be sold as-is, in current condition. Seller to make no repairs.
Key facts
- 3,105 sq ft lot
- Built 1928
- Listed 23 days
Property features AI
Finance
- Other: Living area reported as 2,228 (assessor)
- Financial info: Annual tax listed (other financial details excluded)
- HOA & community: No HOA information provided
Exterior
- Parking: No parking details provided
- Security: No security features listed
- Utilities: No utilities details provided
- Home design: Residential income property (2-4 units)
- Construction: Brick construction
- Exterior features: Lot approximately 0.071 acres; Neighborhood: Wells Goodfellow
Interior
- Kitchen: No kitchen details provided
- Bedrooms: No main or upper level bedrooms listed
- Flooring: No flooring details provided
- Bathrooms: No main or upper level bathrooms listed
- Heating & cooling: Other heating; No cooling
- Interior features: No listed interior features
- Laundry & utility: No laundry or utility details provided
Neighborhood map
What this means for you Summary
Snapshot
- This is a ?-bed/2.0-bath multifamily listed at $15k.
Deal economics
- At list price, monthly cash flow is $809 ($10k/yr) — positive.
- The deal already cash-flows at list — no discount required.
- Meets the 1% rule at list price ($1k rent vs $15k).
- Recommended offer: $15k (1.5% below list) — sets the bar for market timing.
- Cap rate 71.0% vs local median 5.0% in St. Louis — top-decile yield for the area; either an underpriced asset or a hidden risk that comps aren't pricing in. Stress-test before assuming the spread holds.
Location & tenants
- Location reads: area grade D — affects rentability + tenant quality, not the cash-flow math above.
- St. Louis City (urban): math 10% / reading 18% proficiency, ranked #312 of 324 in MO (top 96%) — low school quality limits family demand, transient renter base, plan for 1-2y turnover; 80% free/reduced lunch — lower-income household profile, screen leases tightly.
- Zoned schools: Sigel Elem. Comm. Ed. Ctr. (math 2% / reading 2%, grade F, #1,099 of 1,115 statewide, top 100%, 219 students, 99% FRL); Sumner High (math 2% / reading 2%, grade F, #520 of 521 statewide, top 100%, 264 students, 99% FRL) — zoned schools average 99% FRL vs 80% district-wide (18 pts higher); higher-poverty schools than district average — tighter screening recommended.
- Market conditions: 20 active listings in the ZIP; 8 comparable units currently listed for rent nearby; rentals lingering (median 44d on market — plan ~5-8 weeks vacancy on turnover, expect pricing pressure); 88% of comp listings sitting > 30 days — soft ceiling on asking rent; lower-income renter base — watch delinquency; 294 units permitted in St. Louis city in 2024 (227 in 5+ unit buildings).
- This rent runs 40% of the median local income ($35k/yr) — at the standard rent-burdened threshold; future hikes will face affordability resistance.
Forward outlook
- In year one you build about $185 of equity ($104 loan paydown + $81 appreciation (0.5% local appreciation)).
- St. Louis County population projected to shrink 6% by 2050 — rents likely to lag national; underwrite the cash flow, not the appreciation.
- At projected returns (0.5% appreciation + 3.0% rent growth), your $4k cash investment doubles in ~1 year — after that, you're playing with house money.
Negotiation context
- It's been on market 23 days — a 2% lower offer ($15k) is reasonable based on typical stale-listing flexibility.
- 3 sale attempts with the ask held roughly flat each time — persistent listings suggest the price (not the market) is what's stuck; bring a comps-based counter.
Risks & watch-outs
- Watch-outs: built in 1928 — expect roof / HVAC / electrical / plumbing capex.
- Climate carrying-cost: extreme-heat days projected 7→21/yr by 2055 (HVAC capex compounding) — expect insurance premiums to compound above CPI over the hold.
Questions for the listing agent
- Built in 1928 — when were the roof, HVAC, electrical panel, plumbing, and water heater last replaced?
- Is there a deadline driving the sale (1031 exchange, divorce, estate, relocation)? That informs how much negotiation room exists.
- The area grade is low — what's the realistic commute time and amenity access for the typical tenant pool here? Any planned neighborhood developments (good or bad) we should know about?
- What's the average days-on-market for RENTAL listings here right now (not sales)? A rising rental-DOM trend means longer vacancies and softer asking-rent achievability than the comps imply.
- What's the recent tenant-quality profile in this submarket — average credit score on applications, eviction rate, late-payment / NSF rate, and stable-employment percentage? A property-management company in the area should have these aggregated.
- How much new apartment / multifamily construction is in the pipeline within 1–3 miles? Heavy new supply (>2% of stock underway) typically softens rents 12–24 months out; light construction supports rent growth.
Investment metrics
- 1% rule
- 7.77% ✓
- Cap rate
- 70.99%
- Cash-on-cash
- 231.06%
- DSCR
- 11.28
- GRM
- 1.1
CMA / ARV
- ARV (on-the-fly)
- $82,436
- Comps found
- 6
Show comp detail 6 sales within ~0.75 mi
| Address | Dist | Beds/Ba | Sqft | Sold | Price | $/sf | Match |
|---|---|---|---|---|---|---|---|
| 2615 Burd Ave | 0.38mi | —/— | 2,184 (-2%) | 6mo | $80,000 | $37 | 74 |
| 5929 Highland Ave | 0.49mi | 4/2.0 | 2,208 (-1%) | 5mo | $12,000 | $5 | 71 |
| 5568 Palm St | 0.32mi | 6/2.0 | 2,254 (+1%) | 24mo | $37,000 | $16 | 64 |
| 3421 Belt Ave | 0.41mi | 8/4.0 | 2,174 (-2%) | 10mo | $80,000 | $37 | 61 |
| 5543 Hebert St | 0.33mi | 4/2.0 | 2,476 (+11%) | 16mo | $80,000 | $32 | 53 |
| 2125 Edmund Ave | 0.73mi | 16/16.0 | 1,950 (-12%) | 7mo | $199,900 | $103 | 19 |
Match score weights: distance 35% · size 25% · config 20% · recency 20%. Top-matched comps best support the ARV.
Projected returns pro-forma
0.54% appreciation · 3.0% rent growth · sell at horizon
- IRR
- —
- Equity multiple
- 13.26×
- Total profit
- $51,476
- Equity at exit
- $4,764
- IRR
- —
- Equity multiple
- 28.06×
- Total profit
- $113,655
- Equity at exit
- $6,065
Cash invested: $4,200 (down + closing). Projections, not guarantees.
Landlord ↔ Tenant lean methodology
- Overall (STATE)
- 81 Strongly Landlord-Friendly
- State Missouri
- 81 Strongly Landlord-Friendly · R+10
- County
- — inherits STATE
- City
- — inherits STATE
ZIP-level market 63120
- Home prices YoY
- 0.4%
- Active inventory
- 20
- Price-to-rent
- 1.1×
Monthly cashflow live
- Estimated rent
- $1,166 high interval (Pro) →
- Mortgage (P&I)
- −$79
- Tax from tax record
- −$28 /mo · $332/yr
- Insurance
- −$6
- HOA
- −$0
- Vacancy / Maint / Mgmt
- −$245
- Net cashflow
- $809
Break-even live
UW: 25.0% down · 7.5% · 30yr · 1.5% tax · 5.0% vac · 8.0% maint · 8.0% mgmt
Financing live
Cash to close
- Down payment
- $3,750
- Closing costs
- $450
- Reserves months
- —
- Total cash needed
- —
Loan-product check · same deal, 3 products live
Conventional
25% down · 7.5% · 30yr
- Down + closing
- —
- Monthly P&I
- —
- Monthly cashflow
- —
- DSCR
- —
- Eligible?
- —
Personal DTI + credit; lowest rate.
DSCR
20% down · 8.5% · 30yr
- Down + closing
- —
- Monthly P&I
- —
- Monthly cashflow
- —
- DSCR
- —
- Eligible?
- —
No personal income docs; deal must DSCR.
Hard money
10% down · 12.0% · 12mo
- Down + closing
- —
- Monthly P&I
- —
- Monthly cashflow
- —
- DSCR
- —
- Eligible?
- —
Short-term bridge; refi at stabilization.
Rent comps 8 comps
| Address | Beds | Baths | Sqft | Rent | $/sqft | DOM | Units | Dist |
|---|---|---|---|---|---|---|---|---|
| 5760 Theodosia Ave Saint Louis, MO | 3.0 | 1.5 | 1702 | $1,420 | $0.83 | 23d | 1 | 0.63mi |
| 5223 Ashland Ave Unit 2 St. Louis, MO | 3.0 | 1.0 | 2200 | $1,450 | $0.66 | 43d | 1 | 0.77mi |
| 5223 Ashland Ave Saint Louis, MO | 2.0 | 1.0 | 2200 | $1,250 | $0.57 | 43d | 1 | 0.77mi |
| 5345 Wells Ave Saint Louis, MO | 3.0 | 1.0 | 2254 | $1,295 | $0.57 | 43d | 1 | 1.00mi |
| 5096 Minerva Ave Unit C St. Louis, MO | 3.0 | 1.0 | 1800 | $1,395 | $0.78 | 43d | 1 | 1.35mi |
| 1320 Academy Ave Unit A St. Louis, MO | 2.0 | 1.0 | 1600 | $1,090 | $0.68 | 43d | 1 | 1.36mi |
| 4868 Farlin Ave Unit 2 St. Louis, MO | 2.0 | 1.0 | 2690 | $1,100 | $0.41 | 43d | 1 | 1.42mi |
| 1416 N Euclid Ave Saint Louis, MO | 2.0 | 2.0 | 2702 | $1,200 | $0.44 | 43d | 1 | 1.47mi |
Listing history 31 events
-
2026-06-18days on market $15,000 Active 23 DOM
-
2026-06-17days on market $15,000 Active 22 DOM
-
2026-06-16days on market $15,000 Active 21 DOM
-
2026-06-15days on market $15,000 Active 20 DOM
-
2026-06-13days on market $15,000 Active 18 DOM
-
2026-06-09days on market $15,000 Active 14 DOM
-
2026-06-08days on market $15,000 Active 13 DOM
-
2026-06-07days on market $15,000 Active 12 DOM
-
2026-06-05days on market $15,000 Active 9 DOM
-
2026-06-03days on market $15,000 Active 8 DOM
-
2026-06-02days on market $15,000 Active 7 DOM
-
2026-06-01days on market $15,000 Active 6 DOM
-
2026-05-31days on market $15,000 Active 5 DOM
-
2026-05-26$15,000 Active
-
2026-02-02soldstatus Closed 107-char remark
Show marketing remark (107 chars)
Brick duplex in need of repair. Property to be sold as-is, in current condition. Seller to make no repairs.
-
2026-01-20status Pending 107-char remark
Show marketing remark (107 chars)
Brick duplex in need of repair. Property to be sold as-is, in current condition. Seller to make no repairs.
-
2025-12-12price $27,500 107-char remark
Show marketing remark (107 chars)
Brick duplex in need of repair. Property to be sold as-is, in current condition. Seller to make no repairs.
-
2025-11-06price $28,500 107-char remark
Show marketing remark (107 chars)
Brick duplex in need of repair. Property to be sold as-is, in current condition. Seller to make no repairs.
-
2025-10-20price $29,900 107-char remark
Show marketing remark (107 chars)
Brick duplex in need of repair. Property to be sold as-is, in current condition. Seller to make no repairs.
-
2025-10-15price $32,000 107-char remark
Show marketing remark (107 chars)
Brick duplex in need of repair. Property to be sold as-is, in current condition. Seller to make no repairs.
-
2025-09-15status Active 107-char remark
Show marketing remark (107 chars)
Brick duplex in need of repair. Property to be sold as-is, in current condition. Seller to make no repairs.
-
2025-09-15price $35,000 107-char remark
Show marketing remark (107 chars)
Brick duplex in need of repair. Property to be sold as-is, in current condition. Seller to make no repairs.
-
2025-08-13status Pending 107-char remark
Show marketing remark (107 chars)
Brick duplex in need of repair. Property to be sold as-is, in current condition. Seller to make no repairs.
-
2025-06-03price $40,000 107-char remark
Show marketing remark (107 chars)
Brick duplex in need of repair. Property to be sold as-is, in current condition. Seller to make no repairs.
-
2025-05-28price $42,500 107-char remark
Show marketing remark (107 chars)
Brick duplex in need of repair. Property to be sold as-is, in current condition. Seller to make no repairs.
-
2025-05-08price $45,000 107-char remark
Show marketing remark (107 chars)
Brick duplex in need of repair. Property to be sold as-is, in current condition. Seller to make no repairs.
-
2025-04-26$50,000 Active 107-char remark
Show marketing remark (107 chars)
Brick duplex in need of repair. Property to be sold as-is, in current condition. Seller to make no repairs.
-
2024-05-08soldstatus $51,852
-
2022-03-04soldstatus $5,773,000
-
2021-12-14soldstatus $25,000
-
2005-09-02soldstatus $20,910
ⓘ Source: listings_history table (triggers on properties + properties_extension) + one-shot
backfill from property_details.listing_events for pre-trigger history.
Tax reassessment forecast MO · Resets to sale price
- Current annual tax
- $332 · $28/mo
- Projected year-2 tax
- $332 · $28/mo
- Expected delta
- $0/yr ($0/mo · 0.0%)
ⓘ Screening estimate from a state-policy table — verify with the county assessor before closing.
Climate risk First Street
- Flood 1/10 Low FEMA zone X (unshaded) · 0% chance over 30 yrs
- Wildfire 1/10 Low
- Heat 5/10 Major 7 d/yr ≥107°F today · 21 d/yr by 30 yrs out
- Wind 2/10 Low 100% chance of damaging wind over 30 yrs
- Air quality 4/10 Moderate 4 unhealthy d/yr today · 5 by 30 yrs out
Nearby sold comps map
Loading sold comps map…
Walkable amenities ~0.75 mi
Loading nearby amenities…
Taxation est. · year 1
- Rental income
- $13,994
- − Mortgage interest
- −$840
- − Property taxes
- −$332
- − Insurance
- −$75
- − Repairs & maintenance
- −$1,120
- − Management
- −$1,120
- − Depreciation
- −$436
- Taxable income
- $10,072
- Est. tax owed @ 24.0%
- −$2,417
- After-tax cash flow
- $7,287/yr
For passive investors: Depreciation is non-cash, so a rental often shows a tax loss while cash-flowing — sheltering income. Rental losses are passive: they offset passive income freely, and up to $25,000/yr can offset ordinary (W-2) income if you actively participate and your MAGI is under $100k (phasing out to $0 by $150k); unused losses carry forward. On sale, claimed depreciation is recaptured at up to 25%, and gains may owe capital-gains tax (a 1031 exchange can defer both). Figures are a year-1 estimate at your 24.0% rate — not tax advice; consult a CPA.
Schools (NCES district)
- District
- St. Louis City
- NCES district ID
- 2929280
- Math proficiency
- 10% ▼ -6.00%
- Reading proficiency
- 18% ▼ -3.00%
- Median HH income
- $35,685
- Composite
- 11.54/100
- National rank
- #9699
- State rank
- #312 of 324 in MO
Livability — St. Louis
No livability data for this city. (Only ~50 U.S. cities are tracked.)
Census & demographics
- Census place
- St. Louis, MO
- County
- Saint Louis City · 254,015 people
- City population
- 283,259
- Metro
- St. Louis, MO-IL
- Population (ZIP)
- 6,790
- Household income
- $35,176
- Rent vs Own
- Severe rent burden
- 555.0
Population outlook (St. Louis County) Hauer SSP2
- Today (2025)
- 315,737 people
- By 2030
- 313,865 · -0.6%
- By 2040
- 305,439 · -3.3%
- By 2050
- 296,529 · -6.1%
- By 2075
- 271,028 · -14.2%
- By 2100
- 255,359 · -19.1%
Race, ethnicity, and origin ACS 2023
- Neighborhood character
- Predominantly Black (90%)
- Race & ethnicity
- Black 90% Two or more races 7% White 2%
- Foreign-born
- 1% · Canada
- Languages at home
- 97% English-only · Spanish 1% French/Haitian/Cajun 1%
Political lean MEDSL · St. Louis
- 2024 margin
- Solid D (+64.7) · D 81.4% · R 16.7% · Other 2.0%
- 2008→2024 swing
- -3.5pp toward R · 2008: 68.2pp · 2024: 64.7pp
- All cycles
- 2024: D+64.7 2020: D+66.2 2016: D+63.7 2012: D+66.6 2008: D+68.2
Not yet ingested
- Civics
- —
Market trends
- HPI YoY
- ▲ 0.54%
- Current HPI
- 141.8177
- Rent YoY
- —
- Metro
- St. Louis, MO-IL
- State GDP YoY
- ▲ 1.84%
- F500 in state
- 20
Industry mix (Fortune 500 HQ in MO)
| Industry | F500 HQs | Revenue |
|---|---|---|
| Healthcare | 1 | $163B |
|
||
| Insurance | 1 | $21B |
|
||
| Industrial Technology | 1 | $17B |
|
||
| Retail | 1 | $16B |
|
||
| Industrial Distribution | 1 | $10B |
|
||
| Utilities | 1 | $9B |
|
||
Price history
-28.3% since first listed18 events — show timeline
- 2026-05-26 Listed $15,000 MARIS as Distributed by MLS Grid
- 2026-02-02 Sold (MLS) — MARIS as Distributed by MLS Grid
- 2026-01-20 Pending — MARIS as Distributed by MLS Grid
- 2025-12-12 Price Changed $27,500 MARIS as Distributed by MLS Grid
- 2025-11-06 Price Changed $28,500 MARIS as Distributed by MLS Grid
- 2025-10-20 Price Changed $29,900 MARIS as Distributed by MLS Grid
- 2025-10-15 Price Changed $32,000 MARIS as Distributed by MLS Grid
- 2025-09-15 Relisted — MARIS as Distributed by MLS Grid
- 2025-09-15 Price Changed $35,000 MARIS as Distributed by MLS Grid
- 2025-08-13 Pending — MARIS as Distributed by MLS Grid
- 2025-06-03 Price Changed $40,000 MARIS as Distributed by MLS Grid
- 2025-05-28 Price Changed $42,500 MARIS as Distributed by MLS Grid
- 2025-05-08 Price Changed $45,000 MARIS as Distributed by MLS Grid
- 2025-04-26 Listed $50,000 MARIS as Distributed by MLS Grid
- 2024-05-08 Sold (Public Records) $51,852 Public Records
- 2022-03-04 Sold (Public Records) $5,773,000 Public Records
- 2021-12-14 Sold (Public Records) $25,000 Public Records
- 2005-09-02 Sold (Public Records) $20,910 Public Records
Property tax history
+0.8%/yrLatest (2024): $332 · +3.0% YoY. Source: county tax records.
Cash-flow waterfall
monthlySold comps — $/sqft
last 12 mo · ≤1 miLoading sold comps…