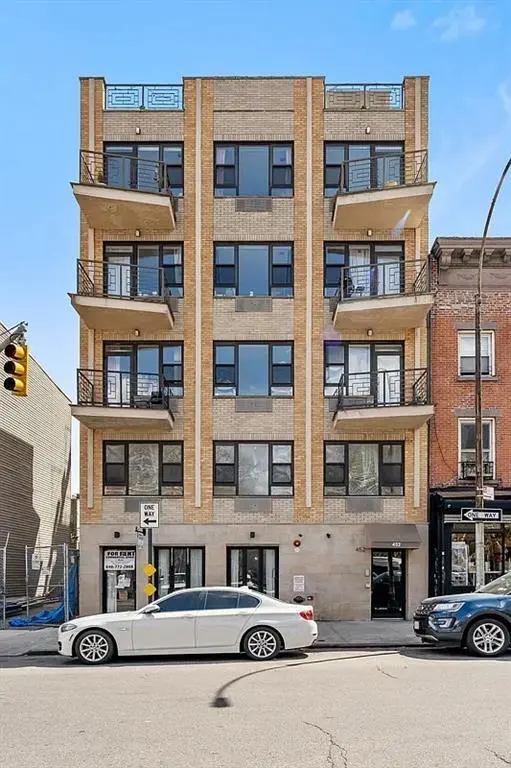
452 Lafayette Ave Unit 2F · New York, NY
Flood risk 1/10 · Minimal
- FEMA flood zone
- X (unshaded)
- Chance of flooding over 30 yrs
- 0.0%
- Est. flood insurance / yr
- $507 – $1,088
Fire risk 1/10 · Minimal
- Est. fire insurance / yr
- $691 – $1,283
Heat risk 7/10 · Major
- Hot days now (above 99°F)
- 7 days/yr
- Hot days in 30 yrs
- 15 days/yr
Wind risk 6/10 · Moderate
- Chance of severe wind over 30 yrs
- 27.0%
Air-quality risk 4/10 · Minor
- Unhealthy air days now
- 5 days/yr
- Unhealthy air days in 30 yrs
- 7 days/yr
Risk factors via First Street. Map © Google.
Why this score? — see what drove the B- grade
The composite is a weighted blend of 9 inputs, each scored 0–100. Each bar is that input's sub-score; the figure is the points it added to the 100-point composite (weight × sub-score).
- Cash flow +22.0/30.0
- Appreciation +10.0/10.0
- ARV discount +7.5/15.0
- DSCR +7.0/10.0
- 1% rule +5.8/10.0
- Schools +5.0/10.0
- Rent growth +4.7/5.0
- Livability +3.8/5.0
- Condition / age +2.5/5.0
$400,000
🖨 Deal sheet (PDF) 📄 Offer letter ✓ Due diligence
Listing remarks
Auction Property: https://www. foreclosureauctions.com/properties/708 Presenting a premier opportunity to acquire a meticulously designed One-bedroom condominium in one of Brooklyn’s most dynamic and culturally rich enclaves. Situated on a highly coveted block at 452 Lafayette Avenue, on the vibrant Bedford-Stuyvesant and Clinton Hill border, this refined residence offers unparalleled proximity to local premier dining, boutique shopping, artisanal cafes, and efficient transit links. Exceptionally low monthly overhead, including reasonable common charges (which cover water) and a coveted 421a tax abatement active through 2037, keeping real estate taxes at an incredible $27 per month.
Key facts
- Coveted block
- Premier dining
- Artisanal cafes
Tags
Property features AI
Finance
- Other: Tax abatement in place through January 1, 2037
- Financial info: Financing available: bank mortgage or cash; Typical down payment around 10%
- HOA & community: Monthly maintenance common fee of $324; Managed by The 452 Lafayette Ave Condominium
Exterior
- Utilities: Water service
- Home design: Residential unit in a multi-unit building; Unit located on floor 2
- Construction: Part of a 9-unit building
- Exterior features: Located on the second floor of the building
Interior
- Kitchen: Eat-in kitchen; Includes refrigerator and stove
- Bedrooms: One bedroom on the first floor
- Bathrooms: One full bathroom on the first floor
- Heating & cooling: No AC units
- Interior features: Refrigerator; Stove
Neighborhood map
What this means for you Summary
Snapshot
- This is a 1-bed/1.0-bath condo listed at $400k.
Deal economics
- At list price, monthly cash flow is $636 ($8k/yr) — positive.
- The deal already cash-flows at list — no discount required.
- Meets the 1% rule at list price ($4k rent vs $400k).
- Cap rate 8.2% vs local median 2.6% in New York — top-decile yield for the area; either an underpriced asset or a hidden risk that comps aren't pricing in. Stress-test before assuming the spread holds.
Location & tenants
- Location reads 75/100 on livability (#268 in NY, #4,188 nationally) — a middle-class / working-renter tenant base. Strengths: amenities A+, commute A+, health & safety A; Watch: crime F, cost of living F.
- Market conditions: Rents rising fast (+8.6%/yr); 88 active listings in the ZIP; 24 comparable units currently listed for rent nearby; rentals leasing fast (median 9d on market — plan ~1-2 weeks tenant-placement turnaround); solid renter incomes; 10,063 units permitted in Kings County in 2024 (9,789 in 5+ unit buildings).
- At $4,304/mo this rent would consume 55% of the median local household income ($94k/yr) (locally 3544% of renters already pay >50% of income on rent) — very limited rent-growth headroom before tenants either downsize or default.
Forward outlook
- In year one you build about $43k of equity ($3k loan paydown + $40k appreciation (10.0% local appreciation)).
- Kings County population projected at +13% by 2050 — modest demand growth; plan on rents tracking national, not racing it.
- At projected returns (10.0% appreciation + 8.0% rent growth), your $112k cash investment doubles in ~3 years — after that, you're playing with house money.
- By year 2, paydown + projected appreciation supports a ~$69k cash-out refi (75% LTV) — recoverable capital for the next deal without selling this one.
Negotiation context
- Only 5 days on market — expect competitive offers; lowballing is unlikely to land.
Risks & watch-outs
- Climate carrying-cost: major wind risk, 27% chance of damaging wind over 30y; extreme-heat days projected 7→15/yr by 2055 (HVAC capex compounding) — expect insurance premiums to compound above CPI over the hold.
Questions for the listing agent
- Any open or pending special assessments — roof, HVAC, plumbing, elevator, façade? What's the per-unit balance and payoff schedule, and is the seller paying it off at close or rolling it to the buyer?
- Is there a deadline driving the sale (1031 exchange, divorce, estate, relocation)? That informs how much negotiation room exists.
- Schools are B-rated — typically a magnet for longer-tenancy family renters. What's the average tenant stay here, and is there a school-zone premium baked into asking?
- Crime grade is F in this area — have there been break-ins, vandalism, or insurance claims at this property in the last 3 years? What carrier currently insures it and at what premium?
- What's the average days-on-market for RENTAL listings here right now (not sales)? A rising rental-DOM trend means longer vacancies and softer asking-rent achievability than the comps imply.
- What's the recent tenant-quality profile in this submarket — average credit score on applications, eviction rate, late-payment / NSF rate, and stable-employment percentage? A property-management company in the area should have these aggregated.
- How much new apartment / multifamily construction is in the pipeline within 1–3 miles? Heavy new supply (>2% of stock underway) typically softens rents 12–24 months out; light construction supports rent growth.
Investment metrics
- 1% rule
- 1.08% ✓
- Cap rate
- 8.20%
- Cash-on-cash
- 6.81%
- DSCR
- 1.30
- GRM
- 7.7
CMA / ARV
No comps found within radius.
Projected returns pro-forma
10.0% appreciation · 8.0% rent growth · sell at horizon
- IRR
- 31.3%
- Equity multiple
- 3.51×
- Total profit
- $281,148
- Equity at exit
- $360,352
- IRR
- 28.7%
- Equity multiple
- 8.61×
- Total profit
- $852,570
- Equity at exit
- $777,112
Cash invested: $112,000 (down + closing). Projections, not guarantees.
Landlord ↔ Tenant lean methodology
- Overall (CITY)
- 0 Strongly Tenant-Friendly
- State New York
- 15 Strongly Tenant-Friendly · D+10
- County
- — inherits STATE
- City New York
- 0 Strongly Tenant-Friendly · D+34
ZIP-level market 11205
- Home prices YoY
- 2.1%
- Rents YoY
- 8.6%
- Active inventory
- 88
- Price-to-rent
- 7.7×
Monthly cashflow live
- Estimated rent
- $4,304 high interval (Pro) →
- Mortgage (P&I)
- −$2,098
- Tax est. 1.5%
- −$500 /mo · $6,000/yr
- Insurance
- −$167
- HOA
- −$0
- Vacancy / Maint / Mgmt
- −$904
- Net cashflow
- $636
Break-even live
Sensitivity live
| Price | -10% $912 | -5% $774 | +0% $636 | +5% $497 | +10% $359 |
|---|---|---|---|---|---|
| Rent | -10% $296 | -5% $466 | +0% $636 | +5% $806 | +10% $976 |
| Rate | -1.0pp $837 | -0.5pp $737 | base $636 | +0.5pp $532 | +1.0pp $427 |
UW: 25.0% down · 7.5% · 30yr · 1.5% tax · 5.0% vac · 8.0% maint · 8.0% mgmt
Financing live
Cash to close
- Down payment
- $100,000
- Closing costs
- $12,000
- Reserves months
- —
- Total cash needed
- —
Loan-product check · same deal, 3 products live
Conventional
25% down · 7.5% · 30yr
- Down + closing
- —
- Monthly P&I
- —
- Monthly cashflow
- —
- DSCR
- —
- Eligible?
- —
Personal DTI + credit; lowest rate.
DSCR
20% down · 8.5% · 30yr
- Down + closing
- —
- Monthly P&I
- —
- Monthly cashflow
- —
- DSCR
- —
- Eligible?
- —
No personal income docs; deal must DSCR.
Hard money
10% down · 12.0% · 12mo
- Down + closing
- —
- Monthly P&I
- —
- Monthly cashflow
- —
- DSCR
- —
- Eligible?
- —
Short-term bridge; refi at stabilization.
Rent comps 24 comps
| Address | Beds | Baths | Sqft | Rent | $/sqft | DOM | Units | Dist |
|---|---|---|---|---|---|---|---|---|
| 198 Hancock St Brooklyn, NY | 1.0 | 1.0 | 400 | $2,450 | $6.12 | 25d | 1 | 0.65mi |
| 475 Clermont Ave Brooklyn, NY | 2.0 | 1.0–2.0 | 807 | $5,144 | $6.37 | 5d | 7 | 0.71mi |
| 545 Vanderbilt Ave Brooklyn, NY | 2.0 | 1.0 | 600 | $4,910 | $8.18 | 4d | 3 | 0.72mi |
| 328 Hancock St Brooklyn, NY | 2.0 | 1.0 | 500 | $2,800 | $5.60 | 25d | 1 | 0.84mi |
| 565 Nostrand Ave Unit 1 Brooklyn, NY | — | 1.0 | 600 | $2,000 | $3.33 | 7d | 1 | 0.86mi |
| 552 Prospect Pl Unit 3A Brooklyn, NY | 1.0 | 1.0 | 676 | $4,500 | $6.66 | 25d | 1 | 0.94mi |
| 668 Nostrand Ave #1 Brooklyn, NY | 1.0 | 1.0 | 611 | $4,200 | $6.87 | 20d | 1 | 0.99mi |
| 151 S Elliott Pl Brooklyn, NY | 1.0–2.0 | 1.0–2.0 | 655 | $4,670 | $7.13 | 3d | 2 | 0.99mi |
| 755 Washington Ave Brooklyn, NY | 1.0 | 1.0 | 700 | $1,800 | $2.57 | 22d | 1 | 1.07mi |
| 461 Dean St Brooklyn, NY | 1.0 | 1.0 | 781 | $5,320 | $6.81 | 6d | 5 | 1.08mi |
| 196 Willoughby St Brooklyn, NY | 2.0 | 1.0–2.0 | 717 | $6,146 | $8.57 | 0d | 7 | 1.23mi |
| 955 Sterling Pl Unit 415 Brooklyn, NY | 2.0 | 1.0 | 680 | $5,150 | $7.57 | 25d | 1 | 1.25mi |
| 955 Sterling Pl #1936 Brooklyn, NY | 1.0 | 1.0 | 540 | $3,170 | $5.87 | 22d | 1 | 1.26mi |
| 333 Schermerhorn St Brooklyn, NY | 1.0 | 1.0 | 585 | $6,782 | $11.58 | 0d | 15 | 1.27mi |
| 540 Fulton St #1729 Brooklyn, NY | 3.0 | 1.0–2.0 | 750 | $5,737 | $7.65 | 25d | 4 | 1.27mi |
| 10 Nevins St Unit 9D Brooklyn, NY | — | 1.0 | 488 | $3,500 | $7.17 | 25d | 1 | 1.28mi |
| 250 Union Ave #2119 Brooklyn, NY | 1.0–2.0 | 1.0 | 590 | $3,500 | $5.93 | 25d | 2 | 1.35mi |
| 343 Gold St Brooklyn, NY | 3.0 | 1.0–2.0 | 903 | $5,053 | $5.59 | 5d | 1 | 1.40mi |
| 275 S 5th St #1698 Brooklyn, NY | 1.0 | 1.0 | 450 | $4,860 | $10.80 | 25d | 2 | 1.40mi |
| 482 Kent Ave Brooklyn, NY | 2.0 | 1.0–2.0 | 750 | $6,555 | $8.74 | 0d | 3 | 1.42mi |
| 478 Kent Ave Brooklyn, NY | 2.0 | 1.0–2.0 | 775 | $5,920 | $7.64 | 4d | 3 | 1.42mi |
| 11 Wharf Way Brooklyn, NY | 1.0 | 1.0 | 610 | $4,870 | $7.98 | 0d | 2 | 1.45mi |
| 214 Duffield St Brooklyn, NY | 3.0 | 1.0–2.0 | 956 | $4,342 | $4.54 | 0d | 1 | 1.46mi |
| 100 Willoughby St Brooklyn, NY | 3.0 | 1.0–2.0 | 892 | $5,232 | $5.87 | 8d | 1 | 1.47mi |
HOA detail condo
- Monthly dues
- $0 · $0/yr
- Likely covers
- water
- Assessments
- None detected in remarks — confirm with the listing agent.
Listing history 4 events
-
2026-06-21days on market $400,000 Active 5 DOM
-
2026-06-18days on market $400,000 Active 2 DOM
-
2026-06-17remarks 693-char remark
-
2026-06-17$400,000 Active 1 DOM
ⓘ Source: listings_history table (triggers on properties + properties_extension) + one-shot
backfill from property_details.listing_events for pre-trigger history.
Climate risk First Street
- Flood 1/10 Low FEMA zone X (unshaded) · 0% chance over 30 yrs
- Wildfire 1/10 Low
- Heat 7/10 Severe 7 d/yr ≥99°F today · 15 d/yr by 30 yrs out
- Wind 6/10 Major 27% chance of damaging wind over 30 yrs
- Air quality 4/10 Moderate 5 unhealthy d/yr today · 7 by 30 yrs out
Nearby sold comps map
Loading sold comps map…
Walkable amenities ~0.75 mi
Loading nearby amenities…
Taxation est. · year 1
- Rental income
- $51,646
- − Mortgage interest
- −$22,406
- − Property taxes
- −$6,000
- − Insurance
- −$2,000
- − Repairs & maintenance
- −$4,132
- − Management
- −$4,132
- − Depreciation
- −$11,636
- Taxable income
- $1,340
- Est. tax owed @ 24.0%
- −$322
- After-tax cash flow
- $7,307/yr
For passive investors: Depreciation is non-cash, so a rental often shows a tax loss while cash-flowing — sheltering income. Rental losses are passive: they offset passive income freely, and up to $25,000/yr can offset ordinary (W-2) income if you actively participate and your MAGI is under $100k (phasing out to $0 by $150k); unused losses carry forward. On sale, claimed depreciation is recaptured at up to 25%, and gains may owe capital-gains tax (a 1031 exchange can defer both). Figures are a year-1 estimate at your 24.0% rate — not tax advice; consult a CPA.
Schools (NCES district)
No district data.
Livability — New York
- Score
- 75/100
- State rank
- #268
- US rank
- #4188
Category grades
Schools grade is shown separately in the Schools card above.
Census & demographics
- Census place
- New York, NY
- County
- Kings County · 2,614,986 people
- City population
- 7,731,280
- Metro
- New York-Newark-Jersey City, NY-NJ-PA
- Population (ZIP)
- 51,676
- Household income
- $93,887
- Rent vs Own
- Severe rent burden
- 3544.0
Population outlook (Kings County) Hauer SSP2
- Today (2025)
- 2,847,441 people
- By 2030
- 2,937,006 · +3.1%
- By 2040
- 3,095,491 · +8.7%
- By 2050
- 3,228,968 · +13.4%
- By 2075
- 3,321,723 · +16.7%
- By 2100
- 3,111,387 · +9.3%
Race, ethnicity, and origin ACS 2023
- Neighborhood character
- Diverse neighborhood (Simpson 0.66)
- Race & ethnicity
- White 52% Black 20% Hispanic / Latino 15% Two or more races 10% Asian 7%
- Hispanic origin (detail)
- Mexican 3% Puerto Rican 5% Dominican 3%
- Common ancestry
- Italian 4% Scandinavian 3% Romanian 2%
- Foreign-born
- 16% · Canada, China, South Korea
- Languages at home
- 57% English-only · German/W. Germanic 21% Spanish 11% Chinese 4%
Political lean MEDSL · Kings
- 2024 margin
- Solid D (+44.0) · D 72.0% · R 28.0%
- 2008→2024 swing
- -15.5pp toward R · 2008: 59.4pp · 2024: 44.0pp
- All cycles
- 2024: D+44.0 2020: D+54.8 2016: D+61.8 2012: D+63.9 2008: D+59.4
Not yet ingested
- Civics
- —
Market trends
- HPI YoY
- ▲ 12.40%
- Current HPI
- 605.3512
- Rent YoY
- ▲ 8.61%
- Metro
- New York-Newark-Jersey City, NY-NJ-PA
- State GDP YoY
- ▲ 2.60%
- F500 in state
- 92
Industry mix (Fortune 500 HQ in NY)
| Industry | F500 HQs | Revenue |
|---|---|---|
| Financial Services | 10 | $950B |
|
||
| Consumer Goods | 9 | $162B |
|
||
| Insurance | 4 | $225B |
|
||
| Telecommunications | 2 | $144B |
|
||
| Pharmaceuticals | 2 | $112B |
|
||
| Media / Entertainment | 2 | $69B |
|
||
Price history
-20.0% since first listed3 events — show timeline
- 2026-06-16 Price Changed $400,000 BNYMLS
- 2026-06-16 Listed $525,000 BNYMLS
- 2011-12-12 Sold (Public Records) $499,950 Public Records
Property tax history
-0.6%/yrLatest (2025): $276 · -1.0% YoY. Source: county tax records.
Cash-flow waterfall
monthlySold comps — $/sqft
last 12 mo · ≤1 miLoading sold comps…