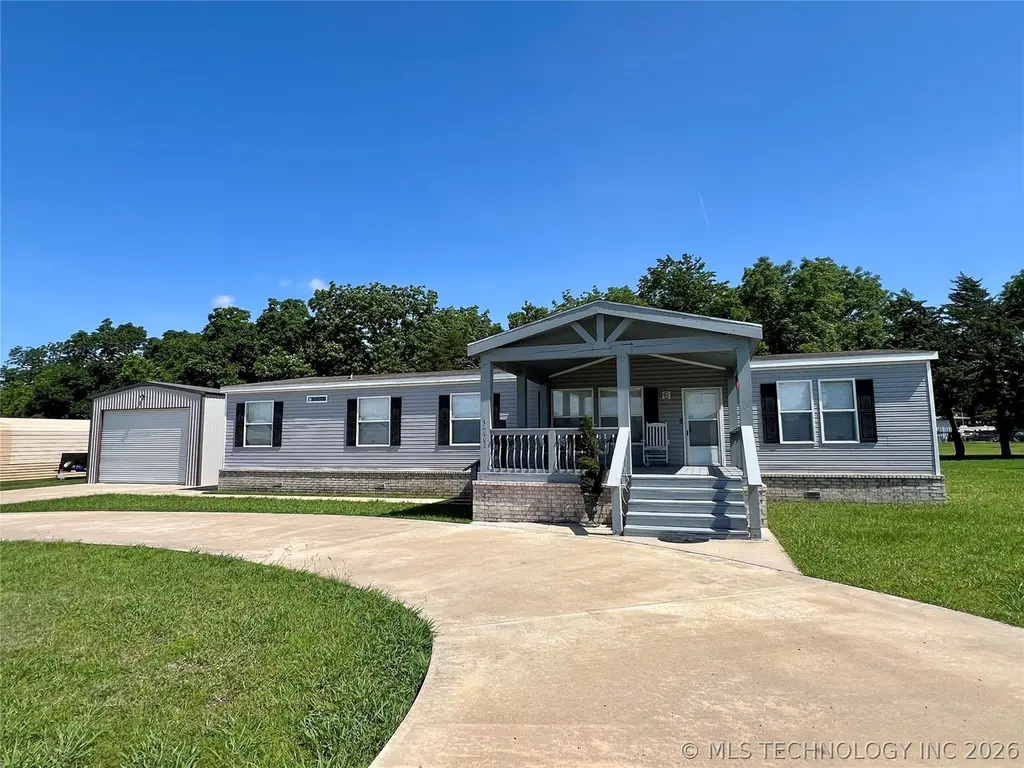
14068 Pond View Dr · Sherwood Shores, TX
Flood risk No data
- FEMA flood zone
- —
- Chance of flooding over 30 yrs
- —
- Est. flood insurance / yr
- —
Fire risk No data
- Est. fire insurance / yr
- —
Heat risk No data
- Hot days now (above threshold)
- —
- Hot days in 30 yrs
- —
Wind risk No data
- Chance of severe wind over 30 yrs
- —
Air-quality risk No data
- Unhealthy air days now
- —
- Unhealthy air days in 30 yrs
- —
Risk factors via First Street. Map © Google.
Why this score? — see what drove the D- grade
The composite is a weighted blend of 9 inputs, each scored 0–100. Each bar is that input's sub-score; the figure is the points it added to the 100-point composite (weight × sub-score).
- Appreciation +10.0/10.0
- Cash flow +8.3/30.0
- ARV discount +7.5/15.0
- Rent growth +2.5/5.0
- Schools +2.5/10.0
- Livability +2.5/5.0
- Condition / age +2.5/5.0
- DSCR +2.2/10.0
- 1% rule +1.5/10.0
$339,000
🖨 Deal sheet (PDF) 📄 Offer letter ✓ Due diligence
Listing remarks
Located in the desirable Twin Ponds addition near Lake Texoma, this spacious 4 bedroom, 2 bath home offers the perfect blend of comfort and lake-area living! Featuring two living areas, there’s plenty of room for entertaining family and friends or relaxing after a day on the lake. Enjoy outdoor living with both a covered front porch and covered back patio, ideal for morning coffee or evening gatherings. The property also includes a 20x30 metal garage/shop plus an additional shop/garage, providing excellent storage for boats, vehicles, lake toys, or hobbies. A circle drive adds convenience and great curb appeal. Conveniently located near Buncombe Creek Resort Marina and The Twisted Anc
Key facts
- Covered front porch
- 20x30 metal garage
- Circle drive
Tags
Property features AI
Finance
- HOA & community: Sidewalks; Gutters (community features)
Exterior
- Parking: Detached garage; 3 garage spaces; RV access/parking; Boat parking; Garage includes storage and workshop
- Security: Smoke detector(s); No safety shelter
- Utilities: Electricity available; Water available (rural); Aerobic septic
- Home design: Single-story; Manufactured double wide; Faces south; Entry on main level
- Construction: Manufactured construction with vinyl siding; Asphalt/fiberglass roof; Crawlspace / permanent foundation; Built (year per public records)
- Exterior features: Covered porch; Covered patio; Rain gutters; Second garage; Porch; Patio
Interior
- Kitchen: Oven; Range; Dishwasher; Refrigerator; Plumbed for ice maker; Electric oven and range connections
- Flooring: Carpet; Laminate flooring
- Bathrooms: 2 full bathrooms
- Heating & cooling: Central heating (electric); Central air conditioning
- Interior features: Ceiling fan(s); Laminate counters; Programmable thermostat; Insulated doors; Storm door(s); Vinyl window frames; Other interior features
- Laundry & utility: Washer hookup; Dryer; Electric dryer hookup; Electric water heater
Neighborhood map
What this means for you Summary
Snapshot
- This is a 3-bed/2.0-bath manufactured listed at $339k.
Deal economics
- At list price, monthly cash flow is $-312 ($-4k/yr) — negative.
- To cash-flow at today's rent, offer at most $284k (16.2% below list).
- To meet the 1% rule (rent ≥ 1% of price), the offer needs to be $220k (35.2% below list).
- Recommended offer: $220k (35.2% below list) — sets the bar for 1% rule.
- Cap rate 5.2% vs local median 2.9% in Sherwood Shores — top-decile yield for the area; either an underpriced asset or a hidden risk that comps aren't pricing in. Stress-test before assuming the spread holds.
Location & tenants
- Location reads 49/100 on livability (#1,519 in TX) — a working-class tenant base; expect higher turnover. Strengths: cost of living A+, housing A+; Watch: crime F, amenities F, commute F.
- Kingston (rural): math 27% / reading 32% proficiency, ranked #70 of 270 in OK (top 26%) — low school quality limits family demand, transient renter base, plan for 1-2y turnover; 76% free/reduced lunch — lower-income household profile, screen leases tightly.
- Zoned schools: Kingston Es (math 33% / reading 32%, grade F, #210 of 845 statewide, top 25%, 620 students, 0% FRL); Kingston Ms (math 23% / reading 34%, grade F, #57 of 345 statewide, top 18%, 286 students, 0% FRL); Kingston Hs (math 22% / reading 27%, grade F, #150 of 447 statewide, top 48%, 362 students, 0% FRL) — zoned schools average 0% FRL vs 76% district-wide (76 pts lower); this property's tenant base skews higher-income than the district average.
- Market conditions: 42 units permitted in Marshall County in 2024 (0 in 5+ unit buildings).
Forward outlook
- In year one you build about $36k of equity ($2k loan paydown + $34k appreciation (10.0% local appreciation)).
- Marshall County population projected at +22% by 2050 — long-run rental-demand tailwind backs the buy-and-hold thesis.
- By year 2, paydown + projected appreciation supports a ~$58k cash-out refi (75% LTV) — recoverable capital for the next deal without selling this one.
Negotiation context
- It's been on market 24 days — a 2% lower offer ($334k) is reasonable based on typical stale-listing flexibility.
- 2 sale attempts since 3y ago with the ask held roughly flat each time — persistent listings suggest the price (not the market) is what's stuck; bring a comps-based counter.
- Current owner paid $42k; list at $339k implies a 717% gain — meaningful room to come down on a strong offer.
Questions for the listing agent
- What do current leases actually rent for vs. the listed asking? Can we see a recent rent roll and the last 12 months of T-12 income?
- Is there a deadline driving the sale (1031 exchange, divorce, estate, relocation)? That informs how much negotiation room exists.
- Schools are F-rated, which usually means shorter tenancies and higher turnover. Who's the typical renter profile here, and what's been the actual vacancy rate?
- Crime grade is F in this area — have there been break-ins, vandalism, or insurance claims at this property in the last 3 years? What carrier currently insures it and at what premium?
- The area grade is low — what's the realistic commute time and amenity access for the typical tenant pool here? Any planned neighborhood developments (good or bad) we should know about?
- What's the average days-on-market for RENTAL listings here right now (not sales)? A rising rental-DOM trend means longer vacancies and softer asking-rent achievability than the comps imply.
- What's the recent tenant-quality profile in this submarket — average credit score on applications, eviction rate, late-payment / NSF rate, and stable-employment percentage? A property-management company in the area should have these aggregated.
- How much new for-sale + rental construction is in the pipeline within 1–3 miles? Heavy new supply typically softens prices + rents 12–24 months out; constrained supply supports both.
Investment metrics
- 1% rule
- 0.65% ✗
- Cap rate
- 5.19%
- Cash-on-cash
- -3.94%
- DSCR
- 0.82
- GRM
- 12.9
CMA / ARV
No comps found within radius.
Projected returns pro-forma
10.0% appreciation · 3.0% rent growth · sell at horizon
- IRR
- 21.5%
- Equity multiple
- 2.73×
- Total profit
- $164,621
- Equity at exit
- $305,398
- IRR
- 19.4%
- Equity multiple
- 6.27×
- Total profit
- $500,106
- Equity at exit
- $658,602
Cash invested: $94,920 (down + closing). Projections, not guarantees.
Landlord ↔ Tenant lean methodology
- Overall (STATE)
- 87 Strongly Landlord-Friendly
- State Texas
- 87 Strongly Landlord-Friendly · R+5
- County
- — inherits STATE
- City
- — inherits STATE
ZIP-level market 73439
- Home prices YoY
- 12.3%
- Price-to-rent
- 12.9×
Monthly cashflow live
- Estimated rent
- $2,198 medium interval (Pro) →
- Mortgage (P&I)
- −$1,778
- Tax from tax record
- −$129 /mo · $1,553/yr
- Insurance
- −$141
- HOA
- −$0
- Vacancy / Maint / Mgmt
- −$462
- Net cashflow
- $-312
Break-even live
Sensitivity live
| Price | -10% $-120 | -5% $-216 | +0% $-312 | +5% $-408 | +10% $-504 |
|---|---|---|---|---|---|
| Rent | -10% $-485 | -5% $-399 | +0% $-312 | +5% $-225 | +10% $-138 |
| Rate | -1.0pp $-141 | -0.5pp $-226 | base $-312 | +0.5pp $-400 | +1.0pp $-489 |
UW: 25.0% down · 7.5% · 30yr · 1.5% tax · 5.0% vac · 8.0% maint · 8.0% mgmt
Financing live
Cash to close
- Down payment
- $84,750
- Closing costs
- $10,170
- Reserves months
- —
- Total cash needed
- —
Loan-product check · same deal, 3 products live
Conventional
25% down · 7.5% · 30yr
- Down + closing
- —
- Monthly P&I
- —
- Monthly cashflow
- —
- DSCR
- —
- Eligible?
- —
Personal DTI + credit; lowest rate.
DSCR
20% down · 8.5% · 30yr
- Down + closing
- —
- Monthly P&I
- —
- Monthly cashflow
- —
- DSCR
- —
- Eligible?
- —
No personal income docs; deal must DSCR.
Hard money
10% down · 12.0% · 12mo
- Down + closing
- —
- Monthly P&I
- —
- Monthly cashflow
- —
- DSCR
- —
- Eligible?
- —
Short-term bridge; refi at stabilization.
Listing history 24 events
-
2026-06-22days on market $339,000 Active 24 DOM
-
2026-06-19days on market $339,000 Active 22 DOM
-
2026-06-18days on market $339,000 Active 21 DOM
-
2026-06-17days on market $339,000 Active 20 DOM
-
2026-06-16days on market $339,000 Active 19 DOM
-
2026-06-15days on market $339,000 Active 18 DOM
-
2026-06-14days on market $339,000 Active 16 DOM
-
2026-06-13days on market $339,000 Active 15 DOM
-
2026-06-10days on market $339,000 Active 13 DOM
-
2026-06-09days on market $339,000 Active 12 DOM
-
2026-06-08days on market $339,000 Active 11 DOM
-
2026-06-07days on market $339,000 Active 10 DOM
-
2026-06-05days on market $339,000 Active 7 DOM
-
2026-06-02days on market $339,000 Active 5 DOM
-
2026-06-01days on market $339,000 Active 4 DOM
-
2026-05-31days on market $339,000 Active 3 DOM
-
2026-05-30days on market $339,000 Active 2 DOM
-
2026-05-26$339,000 Active
-
2023-10-12historical
-
2023-08-20$350,000 Active
-
2015-07-10soldstatus $41,500
-
2007-07-19soldstatus $25,000
-
2006-06-01soldstatus $15,000
-
2004-10-05soldstatus $15,500
ⓘ Source: listings_history table (triggers on properties + properties_extension) + one-shot
backfill from property_details.listing_events for pre-trigger history.
Tax reassessment forecast TX · Resets to sale price
- Current annual tax
- $1,553 · $129/mo
- Projected year-2 tax
- $6,204 · $517/mo
- Expected delta
- +$4,651/yr (+$388/mo · 299.5%)
ⓘ Screening estimate from a state-policy table — verify with the county assessor before closing.
Nearby sold comps map
Loading sold comps map…
Walkable amenities ~0.75 mi
Loading nearby amenities…
Taxation est. · year 1
- Rental income
- $26,379
- − Mortgage interest
- −$18,989
- − Property taxes
- −$1,553
- − Insurance
- −$1,695
- − Repairs & maintenance
- −$2,110
- − Management
- −$2,110
- − Depreciation
- −$9,862
- Taxable loss
- −$9,941
- Est. tax savings @ 24.0%
- +$2,386
- After-tax cash flow
- $-1,356/yr
For passive investors: Depreciation is non-cash, so a rental often shows a tax loss while cash-flowing — sheltering income. Rental losses are passive: they offset passive income freely, and up to $25,000/yr can offset ordinary (W-2) income if you actively participate and your MAGI is under $100k (phasing out to $0 by $150k); unused losses carry forward. On sale, claimed depreciation is recaptured at up to 25%, and gains may owe capital-gains tax (a 1031 exchange can defer both). Figures are a year-1 estimate at your 24.0% rate — not tax advice; consult a CPA.
Schools (NCES district)
- District
- Kingston
- NCES district ID
- 4016590
- Math proficiency
- 27% ▼ -7.00%
- Reading proficiency
- 32% ▼ -7.00%
- Median HH income
- $40,655
- Composite
- 24.88/100
- National rank
- #7585
- State rank
- #70 of 270 in OK
Livability — Sherwood Shores
- Score
- 49/100
- State rank
- #1519
- US rank
- #25941
Category grades
Schools grade is shown separately in the Schools card above.
Census & demographics
- Population (ZIP)
- 7,011
Population outlook (Marshall County) Hauer SSP2
- Today (2025)
- 17,405 people
- By 2030
- 18,038 · +3.6%
- By 2040
- 19,513 · +12.1%
- By 2050
- 21,283 · +22.3%
- By 2075
- 27,884 · +60.2%
- By 2100
- 35,435 · +103.6%
Race, ethnicity, and origin ACS 2023
- Neighborhood character
- Predominantly White (75%)
- Race & ethnicity
- White 75% Two or more races 16% Native American 5% Hispanic / Latino 4%
- Common ancestry
- Lithuanian 3% Italian 2% Serbian 1%
- Foreign-born
- 1% · Canada
- Languages at home
- 97% English-only · Spanish 3%
Political lean MEDSL · Marshall
- 2024 margin
- Solid R (+63.4) · D 17.7% · R 81.2% · Other 1.1%
- 2008→2024 swing
- -24.6pp toward R · 2008: -38.8pp · 2024: -63.4pp
- All cycles
- 2024: R+63.4 2020: R+62.5 2016: R+56.6 2012: R+45.7 2008: R+38.8
Not yet ingested
- Civics
- —
Market trends
- HPI YoY
- ▲ 26.96%
- Current HPI
- 246.2253
- Rent YoY
- —
- Metro
- —
- State GDP YoY
- ▲ 3.95%
- F500 in state
- 110
Industry mix (Fortune 500 HQ in TX)
| Industry | F500 HQs | Revenue |
|---|---|---|
| Energy | 16 | $1,198B |
|
||
| Technology | 5 | $198B |
|
||
| Engineering / Construction | 4 | $72B |
|
||
| Energy Services | 3 | $60B |
|
||
| Utilities | 3 | $41B |
|
||
| Healthcare | 2 | $330B |
|
||
Price history
+2087.1% since first listed7 events — show timeline
- 2026-05-26 Listed $339,000 MLS Technology, Inc.
- 2023-10-12 Listing Removed — MLS Technology, Inc.
- 2023-08-20 Listed $350,000 MLS Technology, Inc.
- 2015-07-10 Sold (Public Records) $41,500 Public Records
- 2007-07-19 Sold (Public Records) $25,000 Public Records
- 2006-06-01 Sold (Public Records) $15,000 Public Records
- 2004-10-05 Sold (Public Records) $15,500 Public Records
Property tax history
+19.1%/yrLatest (2025): $1,553 · +5.9% YoY. Source: county tax records.
Cash-flow waterfall
monthlySold comps — $/sqft
last 12 mo · ≤1 miLoading sold comps…