3564 J C Ave · Tully, NY
Flood risk 7/10 · Major
- FEMA flood zone
- X (unshaded)
- Chance of flooding over 30 yrs
- 0.99%
- Est. flood insurance / yr
- $473 – $860
Fire risk 1/10 · Minimal
- Est. fire insurance / yr
- $691 – $1,283
Heat risk 2/10 · Minimal
- Hot days now (above 91°F)
- 8 days/yr
- Hot days in 30 yrs
- 18 days/yr
Wind risk 1/10 · Minimal
- Chance of severe wind over 30 yrs
- 1.0%
Air-quality risk 2/10 · Minimal
- Unhealthy air days now
- 0 days/yr
- Unhealthy air days in 30 yrs
- 1 days/yr
Risk factors via First Street. Map © Google.
Why this score? — see what drove the B+ grade
The composite is a weighted blend of 9 inputs, each scored 0–100. Each bar is that input's sub-score; the figure is the points it added to the 100-point composite (weight × sub-score).
- Cash flow +24.5/30.0
- ARV discount +15.0/15.0
- Appreciation +10.0/10.0
- DSCR +7.9/10.0
- 1% rule +7.6/10.0
- Schools +4.7/10.0
- Livability +3.2/5.0
- Rent growth +2.5/5.0
- Condition / age +2.5/5.0
$149,000
🖨 Deal sheet 📄 Offer letter ✓ Due diligence
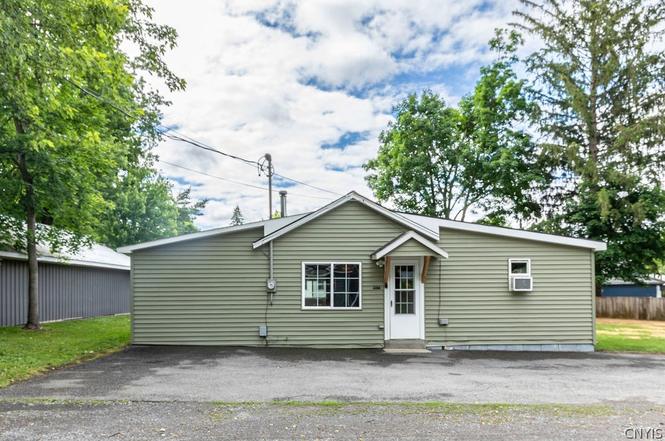
Listing remarks
Move right into this beautifully maintained 2-bedroom, 1-bath cottage on scenic Otisco Lake. Whether you're looking for a seasonal retreat, investment property, or year-round residence, this home offers comfort, convenience, and countless updates. The current owner has thoughtfully renovated the property throughout ownership, including updated windows, electrical, plumbing, flooring, siding, kitchen, bathroom, and fresh interior paint. Major improvements also include a new septic system installed approximately 5 years ago and a new well completed in 2022, providing peace of mind for years to come. Stay cozy during the colder months with the efficient wood-burning stove, or enjoy the conveni
Key facts
- Breathtaking views
- New well
- Updated windows
Tags
Property features AI
Exterior
- Parking: Driveway only (no garage)
- Utilities: Well water; Septic tank; Circuit breaker electric; Cable available; High-speed internet available; Gas water heater
- Home design: Single-story home; Resale property; Shingle roof
- Construction: Vinyl siding; Blown-in insulation; Copper and PEX plumbing; Block and pier/pillar foundation; Existing (year built details)
- Exterior features: Blacktop driveway; Shed(s) and storage; Rectangular residential lot; City street frontage; Deeded lake access to Otisco Lake (10' frontage)
Interior
- Kitchen: Gas oven; Gas range
- Bedrooms: Two main-level bedrooms
- Flooring: Carpet; Hardwood; Tile; Vinyl; Varied flooring
- Bathrooms: One full bathroom (main level)
- Heating & cooling: Electric baseboard heating; Window cooling units
- Interior features: Eat-in kitchen; Separate/formal living room; Galley kitchen; Bedroom on main level; Thermal windows; Has fireplace (1)
- Laundry & utility: Main-level laundry / accessible utilities
Neighborhood map
What this means for you Summary
Snapshot
- This is a 2-bed/1.0-bath single-family listed at $149k.
Deal economics
- At list price, monthly cash flow is $249 ($3k/yr) — positive.
- The deal already cash-flows at list — no discount required.
- Meets the 1% rule at list price ($2k rent vs $149k).
- Cap rate 8.7% vs local median 1.7% in Tully — top-decile yield for the area; either an underpriced asset or a hidden risk that comps aren't pricing in. Stress-test before assuming the spread holds.
Location & tenants
- Location reads 63/100 on livability (#800 in NY) — a middle-class / working-renter tenant base. Strengths: housing A+, cost of living A-; Watch: employment D, crime F, amenities F.
- Tully Central School District (rural): math 53% / reading 53% proficiency, ranked #308 of 590 in NY (top 52%) — acceptable for families but not a draw, mixed tenant base, ~2y average lease.
- Market conditions: 11 active listings in the ZIP; 616 units permitted in Onondaga County in 2024 (256 in 5+ unit buildings).
Forward outlook
- In year one you build about $16k of equity ($1k loan paydown + $15k appreciation (10.0% local appreciation)).
- Onondaga County population projected to shrink 9% by 2050 — rents likely to lag national; underwrite the cash flow, not the appreciation.
- At projected returns (10.0% appreciation + 3.0% rent growth), your $42k cash investment doubles in ~3 years — after that, you're playing with house money.
- By year 3, paydown + projected appreciation supports a ~$40k cash-out refi (75% LTV) — recoverable capital for the next deal without selling this one.
Negotiation context
- Only 3 days on market — expect competitive offers; lowballing is unlikely to land.
- Current owner paid $31k; list at $149k implies a 382% gain — meaningful room to come down on a strong offer.
Risks & watch-outs
- Watch-outs: property tax is 2.7% of price; flood insurance adds $56/mo; built in 1950 — expect roof / HVAC / electrical / plumbing capex.
- Climate carrying-cost: major flood risk — expect insurance premiums to compound above CPI over the hold.
Questions for the listing agent
- Built in 1950 — when were the roof, HVAC, electrical panel, plumbing, and water heater last replaced?
- Property tax is high relative to price — has the assessment been appealed recently, and will the sale trigger a re-assessment?
- What's the actual annual flood-insurance premium (NFIP or private), and is the property in a SFHA with mandatory coverage?
- Is there a deadline driving the sale (1031 exchange, divorce, estate, relocation)? That informs how much negotiation room exists.
- Schools are B-rated — typically a magnet for longer-tenancy family renters. What's the average tenant stay here, and is there a school-zone premium baked into asking?
- Crime grade is F in this area — have there been break-ins, vandalism, or insurance claims at this property in the last 3 years? What carrier currently insures it and at what premium?
- What's the average days-on-market for RENTAL listings here right now (not sales)? A rising rental-DOM trend means longer vacancies and softer asking-rent achievability than the comps imply.
- What's the recent tenant-quality profile in this submarket — average credit score on applications, eviction rate, late-payment / NSF rate, and stable-employment percentage? A property-management company in the area should have these aggregated.
- How much new for-sale + rental construction is in the pipeline within 1–3 miles? Heavy new supply typically softens prices + rents 12–24 months out; constrained supply supports both.
Investment metrics
- 1% rule
- 1.26% ✓
- Cap rate
- 8.74%
- Cash-on-cash
- 8.75%
- DSCR
- 1.39
- GRM
- 6.6
CMA / ARV
- ARV (on-the-fly)
- $212,095
- Comps found
- 3
Show comp detail 3 sales within ~0.75 mi
| Address | Dist | Beds/Ba | Sqft | Sold | Price | $/sf | Match |
|---|---|---|---|---|---|---|---|
| 1742 Otisco Valley Rd Rd | 0.43mi | 3/1.5 (+1) | 844 (-0%) | 12mo | $350,000 | $415 | 63 |
| 3681 Nt Ave | 0.02mi | 3/1.0 (+1) | 720 (-15%) | 8mo | $120,000 | $167 | 63 |
| 3565 J C Ave | 0.02mi | 2/1.0 | 718 (-15%) | 19mo | $179,900 | $251 | 58 |
Match score weights: distance 35% · size 25% · config 20% · recency 20%. Top-matched comps best support the ARV.
Projected returns pro-forma
10.0% appreciation · 3.0% rent growth · sell at horizon
- IRR
- 29.5%
- Equity multiple
- 3.33×
- Total profit
- $97,136
- Equity at exit
- $134,231
- IRR
- 25.6%
- Equity multiple
- 7.57×
- Total profit
- $273,902
- Equity at exit
- $289,474
Cash invested: $41,720 (down + closing). Projections, not guarantees.
Landlord ↔ Tenant lean methodology
- Overall (STATE)
- 15 Strongly Tenant-Friendly
- State New York
- 15 Strongly Tenant-Friendly · D+10
- County
- — inherits STATE
- City
- — inherits STATE
ZIP-level market 13110
- Home prices YoY
- 3.9%
- Active inventory
- 11
- Price-to-rent
- 6.6×
Monthly cashflow live
- Estimated rent
- $1,875 medium interval (Pro) →
- Mortgage (P&I)
- −$781
- Tax from tax record
- −$334 /mo · $4,007/yr
- Insurance
- −$62
- Flood insurance flood zone
- −$56 /mo · $666/yr
- HOA
- −$0
- Vacancy / Maint / Mgmt
- −$394
- Net cashflow
- $249
Break-even live
UW: 25.0% down · 7.5% · 30yr · 1.5% tax · 5.0% vac · 8.0% maint · 8.0% mgmt
Financing live
Cash to close
- Down payment
- $37,250
- Closing costs
- $4,470
- Reserves months
- —
- Total cash needed
- —
Loan-product check · same deal, 3 products live
Conventional
25% down · 7.5% · 30yr
- Down + closing
- —
- Monthly P&I
- —
- Monthly cashflow
- —
- DSCR
- —
- Eligible?
- —
Personal DTI + credit; lowest rate.
DSCR
20% down · 8.5% · 30yr
- Down + closing
- —
- Monthly P&I
- —
- Monthly cashflow
- —
- DSCR
- —
- Eligible?
- —
No personal income docs; deal must DSCR.
Hard money
10% down · 12.0% · 12mo
- Down + closing
- —
- Monthly P&I
- —
- Monthly cashflow
- —
- DSCR
- —
- Eligible?
- —
Short-term bridge; refi at stabilization.
Listing history 4 events
-
2026-06-19days on market $149,000 Active 3 DOM
-
2026-06-18days on market $149,000 Active 2 DOM
-
2026-06-17remarks 699-char remark
-
2026-06-17$149,000 Active 1 DOM
ⓘ Source: listings_history table (triggers on properties + properties_extension) + one-shot
backfill from property_details.listing_events for pre-trigger history.
Tax reassessment forecast NY · Partial reset (capped growth)
- Current annual tax
- $4,007 · $334/mo
- Projected year-2 tax
- $4,007 · $334/mo
- Expected delta
- $0/yr ($0/mo · 0.0%)
ⓘ Screening estimate from a state-policy table — verify with the county assessor before closing.
Climate risk First Street
- Flood 7/10 Severe FEMA zone X (unshaded) · 99% chance over 30 yrs
- Wildfire 1/10 Low
- Heat 2/10 Low 8 d/yr ≥91°F today · 18 d/yr by 30 yrs out
- Wind 1/10 Low 100% chance of damaging wind over 30 yrs
- Air quality 2/10 Low 0 unhealthy d/yr today · 1 by 30 yrs out
Nearby sold comps map
Loading sold comps map…
Walkable amenities ~0.75 mi
Loading nearby amenities…
Taxation est. · year 1
- Rental income
- $22,504
- − Mortgage interest
- −$8,346
- − Property taxes
- −$4,007
- − Insurance
- −$1,412
- − Repairs & maintenance
- −$1,800
- − Management
- −$1,800
- − Depreciation
- −$4,335
- Taxable income
- $804
- Est. tax owed @ 24.0%
- −$193
- After-tax cash flow
- $2,790/yr
For passive investors: Depreciation is non-cash, so a rental often shows a tax loss while cash-flowing — sheltering income. Rental losses are passive: they offset passive income freely, and up to $25,000/yr can offset ordinary (W-2) income if you actively participate and your MAGI is under $100k (phasing out to $0 by $150k); unused losses carry forward. On sale, claimed depreciation is recaptured at up to 25%, and gains may owe capital-gains tax (a 1031 exchange can defer both). Figures are a year-1 estimate at your 24.0% rate — not tax advice; consult a CPA.
Schools (NCES district)
- District
- Tully Central School District
- NCES district ID
- 3629130
- Math proficiency
- 53% ▼ -8.00%
- Reading proficiency
- 53% ▲ 3.00%
- Median HH income
- $67,026
- Composite
- 46.91/100
- National rank
- #2365
- State rank
- #308 of 590 in NY
Livability — Tully
- Score
- 63/100
- State rank
- #800
- US rank
- #15471
Category grades
Schools grade is shown separately in the Schools card above.
Census & demographics
- City population
- 5,297
- Population (ZIP)
- 2,374
Population outlook (Onondaga County) Hauer SSP2
- Today (2025)
- 467,894 people
- By 2030
- 463,381 · -1.0%
- By 2040
- 447,697 · -4.3%
- By 2050
- 426,399 · -8.9%
- By 2075
- 373,661 · -20.1%
- By 2100
- 307,967 · -34.2%
Race, ethnicity, and origin ACS 2023
- Neighborhood character
- Predominantly White (90%)
- Race & ethnicity
- White 90% Two or more races 7% Hispanic / Latino 2%
- Common ancestry
- Romanian 7% Italian 7% Lithuanian 2%
- Foreign-born
- 2% · Canada
- Languages at home
- 98% English-only · Spanish 1% Russian/Polish/Slavic 1%
Political lean MEDSL · Onondaga
- 2024 margin
- D (+17.3) · D 58.6% · R 41.4%
- 2008→2024 swing
- -3.0pp toward R · 2008: 20.3pp · 2024: 17.3pp
- All cycles
- 2024: D+17.3 2020: D+20.6 2016: D+12.8 2012: D+21.1 2008: D+20.3
Not yet ingested
- Civics
- —
Market trends
- HPI YoY
- ▲ 13.70%
- Current HPI
- 364.1864
- Rent YoY
- —
- Metro
- —
- State GDP YoY
- ▲ 2.60%
- F500 in state
- 92
Industry mix (Fortune 500 HQ in NY)
| Industry | F500 HQs | Revenue |
|---|---|---|
| Financial Services | 10 | $950B |
|
||
| Consumer Goods | 9 | $162B |
|
||
| Insurance | 4 | $225B |
|
||
| Telecommunications | 2 | $144B |
|
||
| Pharmaceuticals | 2 | $112B |
|
||
| Media / Entertainment | 2 | $69B |
|
||
Price history
+382.2% since first listed2 events — show timeline
- 2026-06-16 Listed $149,000 CNYIS
- 2007-11-07 Sold (Public Records) $30,900 Public Records
Property tax history
+6.7%/yrLatest (2025): $4,007 · +69.4% YoY. Source: county tax records.
Cash-flow waterfall
monthlySold comps — $/sqft
last 12 mo · ≤1 miLoading sold comps…