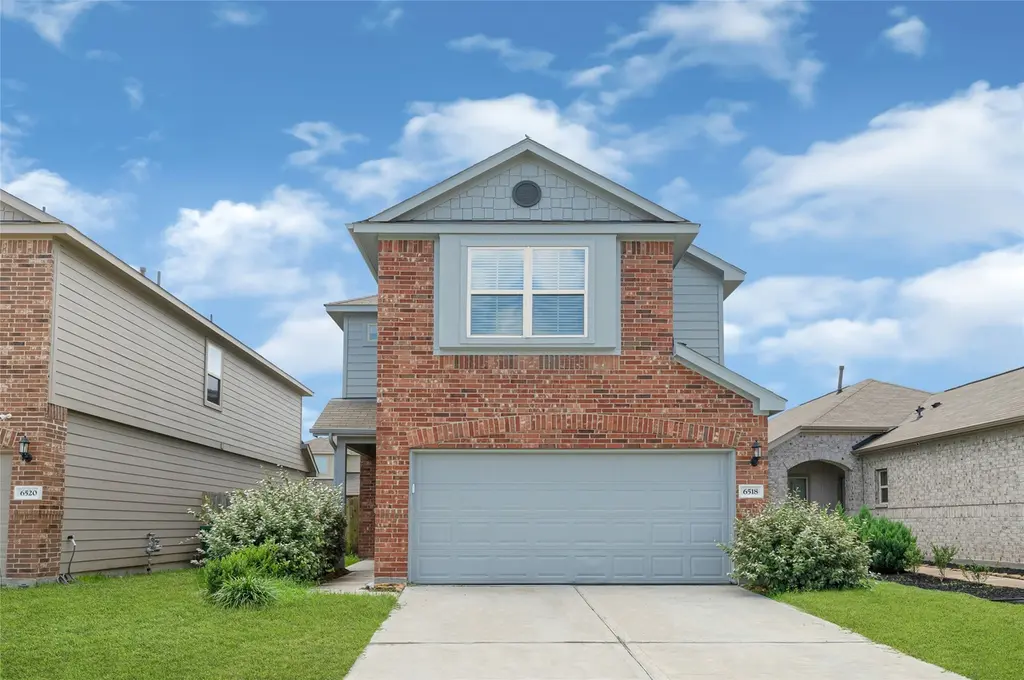
6518 Wenlock Dr · Houston, TX
Flood risk 7/10 · Major
- FEMA flood zone
- X (shaded)
- Chance of flooding over 30 yrs
- 0.99%
- Est. flood insurance / yr
- $507 – $1,088
Fire risk 2/10 · Minimal
- Est. fire insurance / yr
- $1,222 – $2,270
Heat risk 9/10 · Severe
- Hot days now (above 109°F)
- 7 days/yr
- Hot days in 30 yrs
- 24 days/yr
Wind risk 9/10 · Severe
- Chance of severe wind over 30 yrs
- 99.0%
Air-quality risk 2/10 · Minimal
- Unhealthy air days now
- 1 days/yr
- Unhealthy air days in 30 yrs
- 2 days/yr
Risk factors via First Street. Map © Google.
Why this score? — see what drove the D- grade
The composite is a weighted blend of 9 inputs, each scored 0–100. Each bar is that input's sub-score; the figure is the points it added to the 100-point composite (weight × sub-score).
- ARV discount +8.1/15.0
- Appreciation +6.3/10.0
- Cash flow +5.9/30.0
- Livability +3.7/5.0
- 1% rule +2.9/10.0
- Rent growth +2.8/5.0
- Schools +2.7/10.0
- Condition / age +2.5/5.0
- DSCR +0.3/10.0
$289,000
🖨 Deal sheet (PDF) 📄 Offer letter ✓ Due diligence
Listing remarks
Welcome to this beautifully maintained two-story home by Carolina Creek Homes, located in the desirable South Meadow Place community. Offering 4 spacious bedrooms, 2.5 bathrooms, and a versatile upstairs loft/game room, this home combines comfort, style, and functionality. The open-concept floor plan features a stunning island kitchen with granite countertops, gas cooking, ample cabinetry, and seamless connectivity to the living and dining areas—perfect for both everyday living and entertaining. The spacious primary suite offers a private retreat with dual vanities, a garden tub, separate shower, and a generous walk-in closet. Step outside to enjoy the seller-added concrete extension,
Key facts
- Concrete extension
- Upstairs loft
- Island kitchen
Tags
Property features AI
Finance
- Other: Lease not considered
- HOA & community: Managed by Legacy Management Group; Association fee $500 annually
Exterior
- Parking: Attached garage with 2 spaces
- Utilities: Public water; Public sewer
- Home design: Residential property; Built in 2022; Slab foundation; Composition roof
- Construction: Brick construction
- Exterior features: Deck; Patio; Lot identified as 'Other' features
Interior
- Kitchen: Dishwasher; Disposal; Microwave
- Bedrooms: 8 total rooms (includes bedrooms and living spaces)
- Flooring: Carpet; Laminate
- Bathrooms: 2 full bathrooms; 1 half bathroom
- Heating & cooling: Central heating (gas); Central electric air conditioning
- Interior features: Breakfast bar; Double vanity; High ceilings; Kitchen/family room combo; Pantry; Separate shower; Tub with shower; Ceiling fans; Kitchen/dining combo; Living/dining room
Neighborhood map
What this means for you Summary
Snapshot
- This is a 4-bed/2.5-bath single-family listed at $289k.
Deal economics
- At list price, monthly cash flow is $-628 ($-8k/yr) — negative.
- To cash-flow at today's rent, offer at most $178k (38.4% below list).
- To meet the 1% rule (rent ≥ 1% of price), the offer needs to be $229k (20.9% below list).
- Recommended offer: $178k (38.4% below list) — sets the bar for cash-flow.
- Cap rate 4.0% vs local median 3.2% in Houston — meaningfully above typical; check what's discounted (condition, days-on-market, listing class) to confirm the premium yield is real.
Location & tenants
- Location reads 74/100 on livability (#184 in TX, #4,771 nationally) — a middle-class / working-renter tenant base. Strengths: amenities A+, cost of living A+, housing A+; Watch: crime F.
- Houston ISD (urban): math 27% / reading 35% proficiency, ranked #593 of 826 in TX (top 72%) — families likely to look elsewhere, expect single-tenant / working-renter base with shorter leases; 71% free/reduced lunch — lower-income household profile, screen leases tightly.
- Zoned schools: Frost El (math 8% / reading 12%, grade F, #4,259 of 4,322 statewide, top 99%, 489 students, 97% FRL); Thomas Middle (math 3% / reading 13%, grade F, #1,654 of 1,662 statewide, top 100%, 526 students, 98% FRL); Sterling H S (math 16% / reading 27%, grade F, #1,377 of 1,632 statewide, top 85%, 1,421 students, 92% FRL) — zoned schools average 96% FRL vs 71% district-wide (25 pts higher); higher-poverty schools than district average — tighter screening recommended.
- Zoned-school proficiency averages 13% at this address vs 31% district-wide (-18 pts) — the specific schools serving this property underperform the Houston ISD average; the district grade overstates school quality for this exact location.
- Market conditions: Rents rising (+1.2%/yr); 305 active listings in the ZIP; 6 comparable units currently listed for rent nearby; rentals lingering (median 46d on market — plan ~5-8 weeks vacancy on turnover, expect pricing pressure); 50% of comp listings sitting > 30 days — soft ceiling on asking rent; 29,883 units permitted in Harris County in 2024 (8,621 in 5+ unit buildings).
Forward outlook
- In year one you build about $10k of equity ($2k loan paydown + $8k appreciation (2.6% local appreciation)).
- Harris County population projected at +47% by 2050 — long-run rental-demand tailwind backs the buy-and-hold thesis.
- By year 4, paydown + projected appreciation supports a ~$33k cash-out refi (75% LTV) — recoverable capital for the next deal without selling this one.
Negotiation context
- Only 5 days on market — expect competitive offers; lowballing is unlikely to land.
- 2 sale attempts with the ask held roughly flat each time — persistent listings suggest the price (not the market) is what's stuck; bring a comps-based counter.
Risks & watch-outs
- Watch-outs: property tax is 2.9% of price; flood insurance adds $66/mo.
- Climate carrying-cost: major flood risk; severe wind risk, 99% chance of damaging wind over 30y; extreme-heat days projected 7→24/yr by 2055 (HVAC capex compounding) — expect insurance premiums to compound above CPI over the hold.
Questions for the listing agent
- What do current leases actually rent for vs. the listed asking? Can we see a recent rent roll and the last 12 months of T-12 income?
- Property tax is high relative to price — has the assessment been appealed recently, and will the sale trigger a re-assessment?
- What's the actual annual flood-insurance premium (NFIP or private), and is the property in a SFHA with mandatory coverage?
- What does the HOA fee cover, when was the last increase, and are there any pending special assessments or reserve-fund shortfalls?
- Is there a deadline driving the sale (1031 exchange, divorce, estate, relocation)? That informs how much negotiation room exists.
- Schools are D-rated, which usually means shorter tenancies and higher turnover. Who's the typical renter profile here, and what's been the actual vacancy rate?
- Crime grade is F in this area — have there been break-ins, vandalism, or insurance claims at this property in the last 3 years? What carrier currently insures it and at what premium?
- The area grade is low — what's the realistic commute time and amenity access for the typical tenant pool here? Any planned neighborhood developments (good or bad) we should know about?
- What's the average days-on-market for RENTAL listings here right now (not sales)? A rising rental-DOM trend means longer vacancies and softer asking-rent achievability than the comps imply.
- What's the recent tenant-quality profile in this submarket — average credit score on applications, eviction rate, late-payment / NSF rate, and stable-employment percentage? A property-management company in the area should have these aggregated.
- How much new for-sale + rental construction is in the pipeline within 1–3 miles? Heavy new supply typically softens prices + rents 12–24 months out; constrained supply supports both.
Investment metrics
- 1% rule
- 0.79% ✗
- Cap rate
- 3.96%
- Cash-on-cash
- -8.33%
- DSCR
- 0.63
- GRM
- 10.5
CMA / ARV
- ARV (on-the-fly)
- $292,662
- Comps found
- 12
Show comp detail 12 sales within ~0.75 mi
| Address | Dist | Beds/Ba | Sqft | Sold | Price | $/sf | Match |
|---|---|---|---|---|---|---|---|
| 13323 Ardery Meadow Dr | 0.10mi | 4/2.5 | 1,918 (-7%) | 2mo | $289,000 | $151 | 82 |
| 13309 Myrtle Meadows Ln | 0.22mi | 3/2.5 (-1) | 2,029 (-2%) | 1mo | $265,000 | $131 | 81 |
| 6522 Macroom Meadows Ln | 0.15mi | 3/2.5 (-1) | 1,832 (-11%) | 8mo | $272,000 | $148 | 62 |
| 6615 Capridge Dr | 0.65mi | 3/2.0 (-1) | 2,074 (+1%) | 1mo | $295,000 | $142 | 61 |
| 6638 Atlasridge Dr | 0.56mi | 3/3.0 (-1) | 2,088 (+1%) | 6mo | $229,000 | $110 | 60 |
| 6743 Forbes Run Dr | 0.65mi | 4/3.0 | 2,064 (+0%) | 9mo | $299,990 | $145 | 60 |
| 6408 Pregonero Ln | 0.48mi | 3/3.5 (-1) | 1,971 (-4%) | 3mo | $319,900 | $162 | 58 |
| 6650 Atlasridge Dr | 0.55mi | 3/3.0 (-1) | 2,136 (+4%) | 4mo | $265,000 | $124 | 58 |
| 6527 Capridge Dr | 0.70mi | 3/2.0 (-1) | 2,083 (+1%) | 4mo | $275,000 | $132 | 55 |
| 10634 Cashew Run Ln | 0.69mi | 4/2.5 | 2,211 (+7%) | 4mo | $300,000 | $136 | 52 |
| 6819 Forbes Run Dr | 0.68mi | 4/2.5 | 1,919 (-7%) | 6mo | $290,000 | $151 | 52 |
| 6121 Perth St | 0.53mi | 3/2.0 (-1) | 1,859 (-10%) | 7mo | $229,999 | $124 | 46 |
Match score weights: distance 35% · size 25% · config 20% · recency 20%. Top-matched comps best support the ARV.
Projected returns pro-forma
2.61% appreciation · 1.17% rent growth · sell at horizon
- IRR
- -3.3%
- Equity multiple
- 0.82×
- Total profit
- $-14,916
- Equity at exit
- $123,676
- IRR
- 0.5%
- Equity multiple
- 1.07×
- Total profit
- $5,640
- Equity at exit
- $185,860
Cash invested: $80,920 (down + closing). Projections, not guarantees.
Landlord ↔ Tenant lean methodology
- Overall (STATE)
- 87 Strongly Landlord-Friendly
- State Texas
- 87 Strongly Landlord-Friendly · R+5
- County
- — inherits STATE
- City
- — inherits STATE
ZIP-level market 77048
- Home prices YoY
- 1.0%
- Rents YoY
- 1.2%
- Active inventory
- 305
- Price-to-rent
- 10.5×
Monthly cashflow live
- Estimated rent
- $2,286 high interval (Pro) →
- Mortgage (P&I)
- −$1,516
- Tax from tax record
- −$689 /mo · $8,271/yr
- Insurance
- −$120
- Flood insurance flood zone
- −$66 /mo · $798/yr
- HOA
- −$42
- Vacancy / Maint / Mgmt
- −$480
- Net cashflow
- $-628
Break-even live
Sensitivity live
| Price | -10% $-465 | -5% $-546 | +0% $-628 | +5% $-710 | +10% $-792 |
|---|---|---|---|---|---|
| Rent | -10% $-809 | -5% $-718 | +0% $-628 | +5% $-538 | +10% $-448 |
| Rate | -1.0pp $-483 | -0.5pp $-555 | base $-628 | +0.5pp $-703 | +1.0pp $-779 |
UW: 25.0% down · 7.5% · 30yr · 1.5% tax · 5.0% vac · 8.0% maint · 8.0% mgmt
Financing live
Cash to close
- Down payment
- $72,250
- Closing costs
- $8,670
- Reserves months
- —
- Total cash needed
- —
Loan-product check · same deal, 3 products live
Conventional
25% down · 7.5% · 30yr
- Down + closing
- —
- Monthly P&I
- —
- Monthly cashflow
- —
- DSCR
- —
- Eligible?
- —
Personal DTI + credit; lowest rate.
DSCR
20% down · 8.5% · 30yr
- Down + closing
- —
- Monthly P&I
- —
- Monthly cashflow
- —
- DSCR
- —
- Eligible?
- —
No personal income docs; deal must DSCR.
Hard money
10% down · 12.0% · 12mo
- Down + closing
- —
- Monthly P&I
- —
- Monthly cashflow
- —
- DSCR
- —
- Eligible?
- —
Short-term bridge; refi at stabilization.
Rent comps 6 comps
| Address | Beds | Baths | Sqft | Rent | $/sqft | DOM | Units | Dist |
|---|---|---|---|---|---|---|---|---|
| 6543 Castle Loch Ct Houston, TX | 3.0 | 2.5 | 1709 | $1,995 | $1.17 | 16d | 1 | 0.11mi |
| 6706 Hobby Wind Ridge Dr Unit 1503192P Houston, TX | 5.0 | 2.5 | 2195 | $3,448 | $1.57 | 0d | 1 | 0.52mi |
| 10647 Cashew Run Ln Houston, TX | 3.0 | 2.0 | 1515 | $2,100 | $1.39 | 45d | 1 | 0.65mi |
| 5919 Allison Rd Unit B Houston, TX | 4.0 | 2.5 | 1450 | $1,850 | $1.28 | 45d | 1 | 0.74mi |
| 6450 Dayridge Ln Houston, TX | 3.0 | 2.0 | 1415 | $1,820 | $1.29 | 20d | 1 | 0.84mi |
| 7821 Fuqua St Houston, TX | 3.0 | 2.0 | 1408 | $1,700 | $1.21 | 45d | 1 | 1.39mi |
HOA detail
- Monthly dues
- $42 · $504/yr
- Likely covers
- gas
Listing history 4 events
-
2026-06-21days on market $289,000 Active 5 DOM
-
2026-06-18days on market $289,000 Active 2 DOM
-
2026-06-17remarks 693-char remark
-
2026-06-17$289,000 Active 1 DOM
ⓘ Source: listings_history table (triggers on properties + properties_extension) + one-shot
backfill from property_details.listing_events for pre-trigger history.
Tax reassessment forecast TX · Resets to sale price
- Current annual tax
- $8,271 · $689/mo
- Projected year-2 tax
- $8,271 · $689/mo
- Expected delta
- $0/yr ($0/mo · 0.0%)
ⓘ Screening estimate from a state-policy table — verify with the county assessor before closing.
Climate risk First Street
- Flood 7/10 Severe FEMA zone X (shaded) · 99% chance over 30 yrs
- Wildfire 2/10 Low
- Heat 9/10 Extreme 7 d/yr ≥109°F today · 24 d/yr by 30 yrs out
- Wind 9/10 Extreme 99% chance of damaging wind over 30 yrs
- Air quality 2/10 Low 1 unhealthy d/yr today · 2 by 30 yrs out
Nearby sold comps map
Loading sold comps map…
Walkable amenities ~0.75 mi
Loading nearby amenities…
Taxation est. · year 1
- Rental income
- $27,426
- − Mortgage interest
- −$16,188
- − Property taxes
- −$8,271
- − Insurance
- −$2,242
- − Repairs & maintenance
- −$2,194
- − Management
- −$2,194
- − HOA
- −$504
- − Depreciation
- −$8,407
- Taxable loss
- −$12,575
- Est. tax savings @ 24.0%
- +$3,018
- After-tax cash flow
- $-4,519/yr
For passive investors: Depreciation is non-cash, so a rental often shows a tax loss while cash-flowing — sheltering income. Rental losses are passive: they offset passive income freely, and up to $25,000/yr can offset ordinary (W-2) income if you actively participate and your MAGI is under $100k (phasing out to $0 by $150k); unused losses carry forward. On sale, claimed depreciation is recaptured at up to 25%, and gains may owe capital-gains tax (a 1031 exchange can defer both). Figures are a year-1 estimate at your 24.0% rate — not tax advice; consult a CPA.
Schools (NCES district)
- District
- Houston ISD
- NCES district ID
- 4823640
- Math proficiency
- 27% ▼ -18.00%
- Reading proficiency
- 35% ▼ -6.00%
- Median HH income
- $46,054
- Composite
- 26.63/100
- National rank
- #7173
- State rank
- #593 of 826 in TX
Livability — Houston
- Score
- 74/100
- State rank
- #184
- US rank
- #4771
Category grades
Schools grade is shown separately in the Schools card above.
Census & demographics
- Census place
- Houston, TX
- County
- Harris County · 4,702,590 people
- City population
- 3,226,434
- Metro
- Houston-The Woodlands-Sugar Land, TX
- Population (ZIP)
- 21,151
- Household income
- $56,747
- Rent vs Own
- Severe rent burden
- 1117.0
Population outlook (Harris County) Hauer SSP2
- Today (2025)
- 5,571,493 people
- By 2030
- 6,089,821 · +9.3%
- By 2040
- 7,142,806 · +28.2%
- By 2050
- 8,185,864 · +46.9%
- By 2075
- 10,574,329 · +89.8%
- By 2100
- 12,109,958 · +117.4%
Race, ethnicity, and origin ACS 2023
- Neighborhood character
- Predominantly Black (69%)
- Race & ethnicity
- Black 69% Hispanic / Latino 24% Two or more races 6% Asian 3% White 2%
- Hispanic origin (detail)
- Mexican 17% Puerto Rican 1%
- Foreign-born
- 12% · Canada, Vietnam
- Languages at home
- 76% English-only · Spanish 20% Tagalog/Filipino 2% Vietnamese 1%
Political lean MEDSL · Harris
- 2024 margin
- Lean D (+5.5) · D 52.0% · R 46.4% · Other 1.6%
- 2008→2024 swing
- +3.9pp toward D · 2008: 1.6pp · 2024: 5.5pp
- All cycles
- 2024: D+5.5 2020: D+13.3 2016: D+12.4 2012: D+0.1 2008: D+1.6
Not yet ingested
- Civics
- —
Market trends
- HPI YoY
- ▲ 2.61%
- Current HPI
- 266.4468
- Rent YoY
- ▲ 1.17%
- Metro
- Houston-The Woodlands-Sugar Land, TX
- State GDP YoY
- ▲ 3.95%
- F500 in state
- 110
Industry mix (Fortune 500 HQ in TX)
| Industry | F500 HQs | Revenue |
|---|---|---|
| Energy | 16 | $1,198B |
|
||
| Technology | 5 | $198B |
|
||
| Engineering / Construction | 4 | $72B |
|
||
| Energy Services | 3 | $60B |
|
||
| Utilities | 3 | $41B |
|
||
| Healthcare | 2 | $330B |
|
||
Price history
+12465.2% since first listed5 events — show timeline
- 2026-06-16 Listed $289,000 HARMLS
- 2026-06-12 Rental Removed $2,200 HARMLS
- 2026-03-05 Price Changed $2,200 HARMLS
- 2026-01-06 Listed for Rent $2,300 HARMLS
- 2023-07-13 Rental Removed — HARMLS
Property tax history
+130.6%/yrLatest (2025): $8,271 · +2.0% YoY. Source: county tax records.
Cash-flow waterfall
monthlySold comps — $/sqft
last 12 mo · ≤1 miLoading sold comps…