 Multi-family
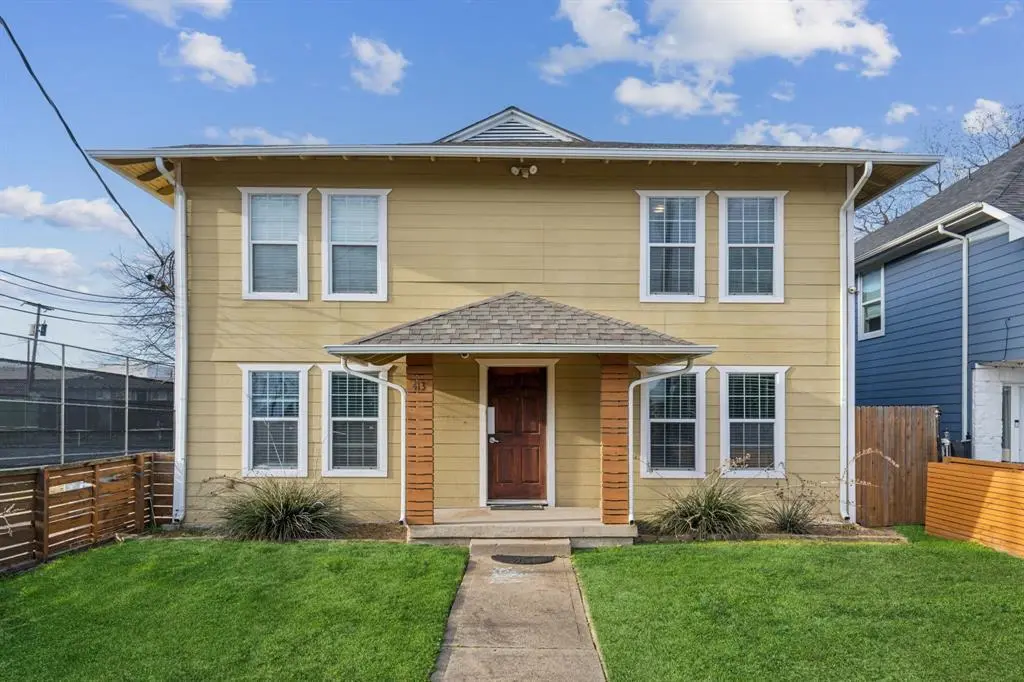
413 E 10th St · Dallas, TX
Flood risk 1/10 · Minimal
- FEMA flood zone
- X (unshaded)
- Chance of flooding over 30 yrs
- 0.0%
- Est. flood insurance / yr
- $507 – $1,088
Fire risk 1/10 · Minimal
- Est. fire insurance / yr
- $1,222 – $2,270
Heat risk 7/10 · Major
- Hot days now (above 109°F)
- 7 days/yr
- Hot days in 30 yrs
- 24 days/yr
Wind risk 6/10 · Moderate
- Chance of severe wind over 30 yrs
- 27.0%
Air-quality risk 2/10 · Minimal
- Unhealthy air days now
- 1 days/yr
- Unhealthy air days in 30 yrs
- 2 days/yr
Risk factors via First Street. Map © Google.
Why this score? — see what drove the B- grade
The composite is a weighted blend of 9 inputs, each scored 0–100. Each bar is that input's sub-score; the figure is the points it added to the 100-point composite (weight × sub-score).
- Cash flow +18.3/30.0
- ARV discount +14.1/15.0
- Appreciation +10.0/10.0
- 1% rule +6.5/10.0
- DSCR +5.8/10.0
- Livability +4.0/5.0
- Schools +2.8/10.0
- Condition / age +2.5/5.0
- Rent growth +1.8/5.0
$499,000
🖨 Deal sheet (PDF) 📄 Offer letter ✓ Due diligence
Multi-family units
County records classify this as Multi-Family (5+ Unit). Listing-text estimate: 1 unit. estimate disagrees with records
5+ unit building — per-unit beds/baths from public records are typically unavailable; the breakdown below (if shown) is an estimate from the listing text.
Listing remarks MLS
Discover a fantastic investment opportunity in the heart of Dallas! This former quadruplex has been thoughtfully reimagined and remodeled into an 8-bedroom, 4-bathroom residence, complete with a shared kitchen area. Each floor includes a convenient laundry area, and the property features modern updates such as durable laminate and tile flooring throughout. The exterior boasts a gated and fenced front yard, offering privacy and security, along with a gated gravel parking lot at the rear for added convenience. Situated just a few blocks away from the vibrant Bishop Arts District and the iconic Dallas Zoo, this property offers prime access to some of Dallas' most popular attractions, dining, and shopping options. Whether you're looking for a rental property with strong income potential or a unique residential space, this versatile building delivers exceptional value and location!
Key facts
- Laundry area
- Prime access
- Shared kitchen area
Tags
Neighborhood map
What this means for you Summary
Snapshot
- This is a 7-bed/4.0-bath multifamily listed at $499k.
Deal economics
- At list price, monthly cash flow is $461 ($6k/yr) — positive.
- The deal already cash-flows at list — no discount required.
- Meets the 1% rule at list price ($6k rent vs $499k).
- Recommended offer: $439k (12.0% below list) — sets the bar for market timing.
- Cap rate 7.4% vs local median 2.3% in Dallas — top-decile yield for the area; either an underpriced asset or a hidden risk that comps aren't pricing in. Stress-test before assuming the spread holds.
Location & tenants
- Location reads 81/100 on livability (#24 in TX, #1,380 nationally) — a professional / high-income tenant draw. Strengths: amenities A+, commute A+, housing A+; Watch: schools C-, crime F.
- Dallas ISD (urban): math 31% / reading 36% proficiency, ranked #559 of 826 in TX (top 68%) — families likely to look elsewhere, expect single-tenant / working-renter base with shorter leases; 83% free/reduced lunch — lower-income household profile, screen leases tightly.
- Market conditions: Rents soft (-2.7%/yr); 147 active listings in the ZIP; 12,577 units permitted in Dallas County in 2024 (6,829 in 5+ unit buildings).
- At $5,728/mo this rent would consume 146% of the median local household income ($47k/yr) (locally 948% of renters already pay >50% of income on rent) — very limited rent-growth headroom before tenants either downsize or default.
Forward outlook
- In year one you build about $53k of equity ($3k loan paydown + $50k appreciation (10.0% local appreciation)).
- Dallas County population projected at +35% by 2050 — long-run rental-demand tailwind backs the buy-and-hold thesis.
- At projected returns (10.0% appreciation + 0.0% rent growth), your $140k cash investment doubles in ~3 years — after that, you're playing with house money.
- By year 2, paydown + projected appreciation supports a ~$86k cash-out refi (75% LTV) — recoverable capital for the next deal without selling this one.
Negotiation context
- It's been on market 158 days — a 12% lower offer ($439k) is reasonable based on typical stale-listing flexibility.
- 5 sale attempts since 10y ago with the ask held roughly flat each time — persistent listings suggest the price (not the market) is what's stuck; bring a comps-based counter.
Risks & watch-outs
- Watch-outs: property tax is 3.0% of price; built in 1951 — expect roof / HVAC / electrical / plumbing capex.
- Climate carrying-cost: major wind risk, 27% chance of damaging wind over 30y; extreme-heat days projected 7→24/yr by 2055 (HVAC capex compounding) — expect insurance premiums to compound above CPI over the hold.
Questions for the listing agent
- It's been on market 158 days. Have you received any prior offers? Is the seller open to a 12% concession, seller financing, or rate buy-down credit?
- Built in 1951 — when were the roof, HVAC, electrical panel, plumbing, and water heater last replaced?
- Property tax is high relative to price — has the assessment been appealed recently, and will the sale trigger a re-assessment?
- Why hasn't it sold? Are there any deal-killer items the seller is aware of (foundation, flood, title, zoning, code violations)?
- Is there a deadline driving the sale (1031 exchange, divorce, estate, relocation)? That informs how much negotiation room exists.
- Crime grade is F in this area — have there been break-ins, vandalism, or insurance claims at this property in the last 3 years? What carrier currently insures it and at what premium?
- What's the average days-on-market for RENTAL listings here right now (not sales)? A rising rental-DOM trend means longer vacancies and softer asking-rent achievability than the comps imply.
- What's the recent tenant-quality profile in this submarket — average credit score on applications, eviction rate, late-payment / NSF rate, and stable-employment percentage? A property-management company in the area should have these aggregated.
- How much new apartment / multifamily construction is in the pipeline within 1–3 miles? Heavy new supply (>2% of stock underway) typically softens rents 12–24 months out; light construction supports rent growth.
Investment metrics
- 1% rule
- 1.15% ✓
- Cap rate
- 7.40%
- Cash-on-cash
- 3.96%
- DSCR
- 1.18
- GRM
- 7.3
CMA / ARV
- ARV (median comp)
- $584,338
- List price
- $499,000
- Delta
- -14.60%
- Verdict
- UNDERPRICED
- Comps
- 18 within 1.0 mi
Projected returns pro-forma
10.0% appreciation · 0.0% rent growth · sell at horizon
- IRR
- 25.9%
- Equity multiple
- 3.04×
- Total profit
- $284,777
- Equity at exit
- $449,539
- IRR
- 21.9%
- Equity multiple
- 6.63×
- Total profit
- $786,424
- Equity at exit
- $969,447
Cash invested: $139,720 (down + closing). Projections, not guarantees.
Landlord ↔ Tenant lean methodology
- Overall (STATE)
- 87 Strongly Landlord-Friendly
- State Texas
- 87 Strongly Landlord-Friendly · R+5
- County
- — inherits STATE
- City
- — inherits STATE
ZIP-level market 75203
- Home prices YoY
- 31.8%
- Rents YoY
- -2.7%
- Active inventory
- 147
- Price-to-rent
- 29.0×
Monthly cashflow live
- Estimated rent
- $5,728 high interval (Pro) →
- Mortgage (P&I)
- −$2,617
- Tax from tax record
- −$1,240 /mo · $14,879/yr
- Insurance
- −$208
- HOA
- −$0
- Vacancy / Maint / Mgmt
- −$1,203
- Net cashflow
- $461
Break-even live
Sensitivity live
| Price | -10% $743 | -5% $602 | +0% $461 | +5% $319 | +10% $178 |
|---|---|---|---|---|---|
| Rent | -10% $8 | -5% $234 | +0% $461 | +5% $687 | +10% $913 |
| Rate | -1.0pp $712 | -0.5pp $587 | base $461 | +0.5pp $331 | +1.0pp $200 |
4-unit breakdown (identical units grouped — click to expand)
| Units | Beds | Baths | Est. rent |
|---|---|---|---|
| 4× units | 2 | 1 | $5,728 |
| #1 | 2 | 1 | $1,432 |
| #2 | 2 | 1 | $1,432 |
| #3 | 2 | 1 | $1,432 |
| #4 | 2 | 1 | $1,432 |
| Total (4 units) | $5,728 | ||
UW: 25.0% down · 7.5% · 30yr · 1.5% tax · 5.0% vac · 8.0% maint · 8.0% mgmt
Financing live
Cash to close
- Down payment
- $124,750
- Closing costs
- $14,970
- Reserves months
- —
- Total cash needed
- —
Loan-product check · same deal, 3 products live
Conventional
25% down · 7.5% · 30yr
- Down + closing
- —
- Monthly P&I
- —
- Monthly cashflow
- —
- DSCR
- —
- Eligible?
- —
Personal DTI + credit; lowest rate.
DSCR
20% down · 8.5% · 30yr
- Down + closing
- —
- Monthly P&I
- —
- Monthly cashflow
- —
- DSCR
- —
- Eligible?
- —
No personal income docs; deal must DSCR.
Hard money
10% down · 12.0% · 12mo
- Down + closing
- —
- Monthly P&I
- —
- Monthly cashflow
- —
- DSCR
- —
- Eligible?
- —
Short-term bridge; refi at stabilization.
Listing history 17 events
-
2026-05-31days on market $499,000 Active 158 DOM
-
2025-12-24$499,000 Active 892-char remark
Show marketing remark (892 chars)
Discover a fantastic investment opportunity in the heart of Dallas! This former quadruplex has been thoughtfully reimagined and remodeled into an 8-bedroom, 4-bathroom residence, complete with a shared kitchen area. Each floor includes a convenient laundry area, and the property features modern updates such as durable laminate and tile flooring throughout. The exterior boasts a gated and fenced front yard, offering privacy and security, along with a gated gravel parking lot at the rear for added convenience. Situated just a few blocks away from the vibrant Bishop Arts District and the iconic Dallas Zoo, this property offers prime access to some of Dallas' most popular attractions, dining, and shopping options. Whether you're looking for a rental property with strong income potential or a unique residential space, this versatile building delivers exceptional value and location!
-
2025-06-30historical
-
2025-03-28price $590,000
-
2025-01-23$650,000 Active
-
2025-01-17historical
-
2025-01-17$650,000 Active
-
2025-01-17$650,000 Active
-
2025-01-17historical
-
2016-07-22soldstatus
-
2016-07-20soldstatus Sold
-
2016-06-24historical
-
2016-06-01$399,900 Active
-
2015-01-12soldstatus
-
2008-01-11soldstatus
-
2008-01-11soldstatus
-
1999-09-20soldstatus
ⓘ Source: listings_history table (triggers on properties + properties_extension) + one-shot
backfill from property_details.listing_events for pre-trigger history.
Tax reassessment forecast TX · Resets to sale price
- Current annual tax
- $14,879 · $1,240/mo
- Projected year-2 tax
- $14,879 · $1,240/mo
- Expected delta
- $0/yr ($0/mo · 0.0%)
ⓘ Screening estimate from a state-policy table — verify with the county assessor before closing.
Climate risk First Street
- Flood 1/10 Low FEMA zone X (unshaded) · 0% chance over 30 yrs
- Wildfire 1/10 Low
- Heat 7/10 Severe 7 d/yr ≥109°F today · 24 d/yr by 30 yrs out
- Wind 6/10 Major 27% chance of damaging wind over 30 yrs
- Air quality 2/10 Low 1 unhealthy d/yr today · 2 by 30 yrs out
Nearby sold comps map
Loading sold comps map…
Walkable amenities ~0.75 mi
Loading nearby amenities…
Taxation est. · year 1
- Rental income
- $68,736
- − Mortgage interest
- −$27,952
- − Property taxes
- −$14,879
- − Insurance
- −$2,495
- − Repairs & maintenance
- −$5,499
- − Management
- −$5,499
- − Depreciation
- −$14,516
- Taxable loss
- −$2,104
- Est. tax savings @ 24.0%
- +$505
- After-tax cash flow
- $6,031/yr
For passive investors: Depreciation is non-cash, so a rental often shows a tax loss while cash-flowing — sheltering income. Rental losses are passive: they offset passive income freely, and up to $25,000/yr can offset ordinary (W-2) income if you actively participate and your MAGI is under $100k (phasing out to $0 by $150k); unused losses carry forward. On sale, claimed depreciation is recaptured at up to 25%, and gains may owe capital-gains tax (a 1031 exchange can defer both). Figures are a year-1 estimate at your 24.0% rate — not tax advice; consult a CPA.
Schools (NCES district)
- District
- Dallas ISD
- NCES district ID
- 4816230
- Math proficiency
- 31% ▼ -16.00%
- Reading proficiency
- 36% ▼ -4.00%
- Median HH income
- $42,881
- Composite
- 28.41/100
- National rank
- #6763
- State rank
- #559 of 826 in TX
Livability — Dallas
- Score
- 81/100
- State rank
- #24
- US rank
- #1380
Category grades
Schools grade is shown separately in the Schools card above.
Census & demographics
- Census place
- Dallas, TX
- County
- Dallas County · 2,612,404 people
- City population
- 1,168,437
- Metro
- Dallas-Fort Worth-Arlington, TX
- Population (ZIP)
- 15,775
- Household income
- $46,989
- Rent vs Own
- Severe rent burden
- 948.0
Population outlook (Dallas County) Hauer SSP2
- Today (2025)
- 2,979,839 people
- By 2030
- 3,191,823 · +7.1%
- By 2040
- 3,619,611 · +21.5%
- By 2050
- 4,026,915 · +35.1%
- By 2075
- 4,957,073 · +66.4%
- By 2100
- 5,508,725 · +84.9%
Race, ethnicity, and origin ACS 2023
- Neighborhood character
- Diverse neighborhood (Simpson 0.55)
- Race & ethnicity
- Hispanic / Latino 59% Black 31% Two or more races 17% White 7% Native American 2%
- Hispanic origin (detail)
- Mexican 53%
- Common ancestry
- Lithuanian 1% Swiss 1%
- Foreign-born
- 29% · Canada, China, Jamaica
- Languages at home
- 47% English-only · Spanish 51% French/Haitian/Cajun 1%
Political lean MEDSL · Dallas
- 2024 margin
- Strong D (+22.2) · D 60.2% · R 38.0% · Other 1.8%
- 2008→2024 swing
- +6.9pp toward D · 2008: 15.3pp · 2024: 22.2pp
- All cycles
- 2024: D+22.2 2020: D+31.6 2016: D+26.2 2012: D+15.4 2008: D+15.3
Not yet ingested
- Civics
- —
Market trends
- HPI YoY
- ▲ 86.64%
- Current HPI
- 358.9507
- Rent YoY
- ▼ -2.72%
- Metro
- Dallas-Fort Worth-Arlington, TX
- State GDP YoY
- ▲ 3.95%
- F500 in state
- 110
Industry mix (Fortune 500 HQ in TX)
| Industry | F500 HQs | Revenue |
|---|---|---|
| Energy | 16 | $1,198B |
|
||
| Technology | 5 | $198B |
|
||
| Engineering / Construction | 4 | $72B |
|
||
| Energy Services | 3 | $60B |
|
||
| Utilities | 3 | $41B |
|
||
| Healthcare | 2 | $330B |
|
||
Price history
+24.8% since first listed16 events — show timeline
- 2025-12-24 Listed $499,000 NTREIS
- 2025-06-30 Listing Removed — NTREIS
- 2025-03-28 Price Changed $590,000 NTREIS
- 2025-01-23 Listed $650,000 NTREIS
- 2025-01-17 Listing Removed — NTREIS
- 2025-01-17 Listed $650,000 NTREIS
- 2025-01-17 Listed $650,000 NTREIS
- 2025-01-17 Listing Removed — NTREIS
- 2016-07-22 Sold (Public Records) — Public Records
- 2016-07-20 Sold (MLS) — NTREIS
- 2016-06-24 Listing Removed — NTREIS
- 2016-06-01 Listed $399,900 NTREIS
- 2015-01-12 Sold (Public Records) — Public Records
- 2008-01-11 Sold (Public Records) — Public Records
- 2008-01-11 Sold (Public Records) — Public Records
- 1999-09-20 Sold (Public Records) — Public Records
Property tax history
+11.2%/yrLatest (2025): $14,879 · -14.8% YoY. Source: county tax records.
Cash-flow waterfall
monthlySold comps — $/sqft
last 12 mo · ≤1 miLoading sold comps…