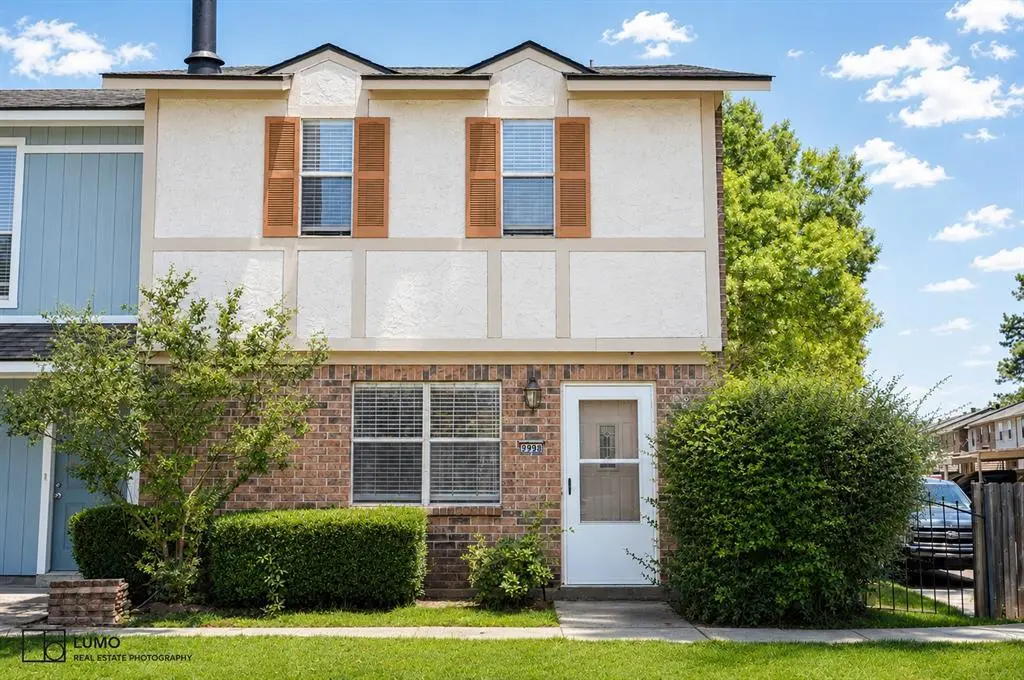
9998 Smugglers Cove Ln · Shreveport, LA
Flood risk 1/10 · Minimal
- FEMA flood zone
- X
- Chance of flooding over 30 yrs
- 0.0%
- Est. flood insurance / yr
- $507 – $1,088
Fire risk 3/10 · Minor
- Est. fire insurance / yr
- $1,269 – $2,357
Heat risk 7/10 · Major
- Hot days now (above 110°F)
- 7 days/yr
- Hot days in 30 yrs
- 22 days/yr
Wind risk 6/10 · Moderate
- Chance of severe wind over 30 yrs
- 68.0%
Air-quality risk 2/10 · Minimal
- Unhealthy air days now
- 0 days/yr
- Unhealthy air days in 30 yrs
- 1 days/yr
Risk factors via First Street. Map © Google.
Why this score? — see what drove the C- grade
The composite is a weighted blend of 9 inputs, each scored 0–100. Each bar is that input's sub-score; the figure is the points it added to the 100-point composite (weight × sub-score).
- Cash flow +19.6/30.0
- ARV discount +10.6/15.0
- DSCR +6.2/10.0
- 1% rule +6.0/10.0
- Livability +3.0/5.0
- Rent growth +2.5/5.0
- Condition / age +2.5/5.0
- Schools +2.2/10.0
- Appreciation +0.0/10.0
$137,900
🖨 Deal sheet 📄 Offer letter ✓ Due diligence
Listing remarks
Great location and gated community with community pool. Two story townhouse offers two spacious bedrooms and a full bathroom upstairs. Living room, dining room, kitchen, laundry and a half bathroom is located at down stairs. Living room has a cozy wood-burning fireplace. Roof was replace in 2024. Freshly painted. Two car carport is located at the back. And guest parking offers plenty of space. Refrigerator in kitchen will remain with the property.
Key facts
- $95 HOA
- 2 parking spots
- Built 1982
Property features AI
Finance
- HOA & community: Mandatory HOA; HOA fee $95 monthly; HOA covers front yard maintenance and full use of facilities; HOA management: Harts Landing HOA
Exterior
- Parking: Assigned covered parking (2 covered spaces / 2 carport spaces)
- Utilities: City water; City sewer; Located in a municipal utility district
- Home design: Attached townhouse; Residential property; Built in 1982; Two-story
- Construction: Preowned
- Exterior features: Front yard maintenance included with association; Subdivision: Harts Landing
Interior
- Kitchen: Dishwasher; Disposal; Electric cooktop; Electric oven; Electric range
- Bedrooms: 2 bedrooms (primary bedroom on 2nd floor)
- Bathrooms: 1 full bathroom; 1 half bathroom
- Heating & cooling: Central air conditioning (electric); Electric heating
- Interior features: Pantry; Fireplace in the living room; Two levels
- Laundry & utility: Electric water heater
Neighborhood map
What this means for you Summary
Snapshot
- This is a 2-bed/3.0-bath townhouse listed at $138k.
Deal economics
- At list price, monthly cash flow is $159 ($2k/yr) — positive.
- The deal already cash-flows at list — no discount required.
- Meets the 1% rule at list price ($2k rent vs $138k).
- Cap rate 7.7% vs local median 5.7% in Shreveport — top-decile yield for the area; either an underpriced asset or a hidden risk that comps aren't pricing in. Stress-test before assuming the spread holds.
Location & tenants
- Location reads 59/100 on livability (#270 in LA) — a working-class tenant base; expect higher turnover. Strengths: cost of living A+, housing A; Watch: schools D+, crime F, amenities F.
- Caddo Parish (urban): math 21% / reading 32% proficiency, ranked #53 of 98 in LA (top 54%) — low school quality limits family demand, transient renter base, plan for 1-2y turnover; 64% free/reduced lunch — lower-income household profile, screen leases tightly.
- Market conditions: Rents flat; 105 active listings in the ZIP; 19 comparable units currently listed for rent nearby; rentals at typical pace (median 21d on market — plan ~3-4 weeks tenant-placement turnaround); 221 units permitted in Caddo Parish in 2024 (0 in 5+ unit buildings).
Forward outlook
- Local home prices are declining (-3.0%/yr); year-one equity from $953 of loan paydown is wiped out by about $4k of value loss. Plan a longer hold.
- Caddo County population projected at -15% by 2050 — secular population decline; favor cash flow + early exit over multi-decade hold.
Negotiation context
- Only 10 days on market — expect competitive offers; lowballing is unlikely to land.
- Current owner paid $104k; 33% above their basis — modest negotiation headroom, anchor on the comps not their cost.
Risks & watch-outs
- Climate carrying-cost: major wind risk, 68% chance of damaging wind over 30y; extreme-heat days projected 7→22/yr by 2055 (HVAC capex compounding) — expect insurance premiums to compound above CPI over the hold.
Questions for the listing agent
- What does the HOA fee cover, when was the last increase, and are there any pending special assessments or reserve-fund shortfalls?
- Is there a deadline driving the sale (1031 exchange, divorce, estate, relocation)? That informs how much negotiation room exists.
- Schools are D-rated, which usually means shorter tenancies and higher turnover. Who's the typical renter profile here, and what's been the actual vacancy rate?
- Crime grade is F in this area — have there been break-ins, vandalism, or insurance claims at this property in the last 3 years? What carrier currently insures it and at what premium?
- What's the average days-on-market for RENTAL listings here right now (not sales)? A rising rental-DOM trend means longer vacancies and softer asking-rent achievability than the comps imply.
- What's the recent tenant-quality profile in this submarket — average credit score on applications, eviction rate, late-payment / NSF rate, and stable-employment percentage? A property-management company in the area should have these aggregated.
- How much new for-sale + rental construction is in the pipeline within 1–3 miles? Heavy new supply typically softens prices + rents 12–24 months out; constrained supply supports both.
Investment metrics
- 1% rule
- 1.10% ✓
- Cap rate
- 7.68%
- Cash-on-cash
- 4.95%
- DSCR
- 1.22
- GRM
- 7.6
CMA / ARV
- ARV (median comp)
- $148,091
- List price
- $137,900
- Delta
- -6.88%
- Verdict
- FAIR
- Comps
- 20 within 1.0 mi
Show comp detail 12 sales within ~0.75 mi
| Address | Dist | Beds/Ba | Sqft | Sold | Price | $/sf | Match |
|---|---|---|---|---|---|---|---|
| 113 Harts Landing Ln | 0.03mi | 2/2.5 | 1,320 (0%) | 4mo | $114,900 | $87 | 93 |
| 9993 Smugglers Cove Ln | 0.02mi | 2/1.5 | 1,339 (+1%) | 1mo | $137,500 | $103 | 90 |
| 10014 Carlsbad Dr | 0.32mi | 3/2.5 (+1) | 1,335 (+1%) | 1mo | $122,000 | $91 | 75 |
| 103 Harts Landing Ln | 0.02mi | 3/2.5 (+1) | 1,497 (+13%) | 5mo | $139,900 | $93 | 65 |
| 10003 Stratmore Cir | 0.16mi | 2/1.5 | 1,160 (-12%) | 2mo | $118,000 | $102 | 65 |
| 10008 Hanover Dr | 0.28mi | 3/1.5 (+1) | 1,255 (-5%) | 5mo | $138,900 | $111 | 64 |
| 10110 Salinas Dr | 0.25mi | 3/1.5 (+1) | 1,435 (+9%) | 1mo | $150,000 | $105 | 62 |
| 10119 Carlsbad Dr | 0.34mi | 3/1.5 (+1) | 1,410 (+7%) | 4mo | $148,500 | $105 | 58 |
| 11 Chimney Stone Way | 0.21mi | 3/2.0 (+1) | 1,490 (+13%) | 2mo | $168,500 | $113 | 58 |
| 10322 Monet Dr | 0.37mi | 2/1.5 | 1,180 (-11%) | 1mo | $130,000 | $110 | 58 |
| 10302 Loma Vista Dr | 0.33mi | 3/2.0 (+1) | 1,464 (+11%) | 3mo | $150,000 | $102 | 55 |
| 10323 Monet Dr | 0.37mi | 3/2.0 (+1) | 1,487 (+13%) | 1mo | $143,000 | $96 | 52 |
Match score weights: distance 35% · size 25% · config 20% · recency 20%. Top-matched comps best support the ARV.
Projected returns pro-forma
-3.0% appreciation · 0.07% rent growth · sell at horizon
- IRR
- -12.2%
- Equity multiple
- 0.57×
- Total profit
- $-16,485
- Equity at exit
- $20,561
- IRR
- -8.6%
- Equity multiple
- 0.54×
- Total profit
- $-17,830
- Equity at exit
- $11,923
Cash invested: $38,612 (down + closing). Projections, not guarantees.
Landlord ↔ Tenant lean methodology
- Overall (STATE)
- 90 Strongly Landlord-Friendly
- State Louisiana
- 90 Strongly Landlord-Friendly · R+12
- County
- — inherits STATE
- City
- — inherits STATE
ZIP-level market 71115
- Home prices YoY
- -26.5%
- Rents YoY
- 0.1%
- Active inventory
- 105
- Price-to-rent
- 7.6×
Monthly cashflow live
- Estimated rent
- $1,519 high interval (Pro) →
- Mortgage (P&I)
- −$723
- Tax from tax record
- −$165 /mo · $1,985/yr
- Insurance
- −$57
- HOA
- −$95
- Vacancy / Maint / Mgmt
- −$319
- Net cashflow
- $159
Break-even live
UW: 25.0% down · 7.5% · 30yr · 1.5% tax · 5.0% vac · 8.0% maint · 8.0% mgmt
Financing live
Cash to close
- Down payment
- $34,475
- Closing costs
- $4,137
- Reserves months
- —
- Total cash needed
- —
Loan-product check · same deal, 3 products live
Conventional
25% down · 7.5% · 30yr
- Down + closing
- —
- Monthly P&I
- —
- Monthly cashflow
- —
- DSCR
- —
- Eligible?
- —
Personal DTI + credit; lowest rate.
DSCR
20% down · 8.5% · 30yr
- Down + closing
- —
- Monthly P&I
- —
- Monthly cashflow
- —
- DSCR
- —
- Eligible?
- —
No personal income docs; deal must DSCR.
Hard money
10% down · 12.0% · 12mo
- Down + closing
- —
- Monthly P&I
- —
- Monthly cashflow
- —
- DSCR
- —
- Eligible?
- —
Short-term bridge; refi at stabilization.
Rent comps 19 comps
| Address | Beds | Baths | Sqft | Rent | $/sqft | DOM | Units | Dist |
|---|---|---|---|---|---|---|---|---|
| 9993 Smugglers Cove Ln Shreveport, LA | 2.0 | 1.5 | 1339 | $1,500 | $1.12 | 13d | 1 | 0.04mi |
| 9990 Smugglers Cove Ln Shreveport, LA | 2.0 | 1.5 | 1267 | $1,550 | $1.22 | 43d | 1 | 0.05mi |
| 9913 Dagger Point Ln Shreveport, LA | 2.0 | 2.5 | 1296 | $1,350 | $1.04 | 43d | 1 | 0.06mi |
| 10018 Artesia Dr Shreveport, LA | 3.0 | 2.5 | 1875 | $1,500 | $0.80 | 43d | 1 | 0.13mi |
| 10014 Stratmore Cir Unit 10014 Shreveport, LA | 3.0 | 2.5 | 1824 | $1,600 | $0.88 | 13d | 1 | 0.20mi |
| 184 Riverbrooke Dr Shreveport, LA | 3.0 | 2.0 | 1620 | $2,000 | $1.23 | 21d | 1 | 0.24mi |
| 176 Settlers Bnd Shreveport, LA | 2.0 | 1.5 | 958 | $1,175 | $1.23 | 43d | 1 | 0.25mi |
| 409 Persimmon Dr Shreveport, LA | 3.0 | 2.0 | 1800 | $1,900 | $1.06 | 21d | 1 | 0.30mi |
| 10305 Monet Dr Shreveport, LA | 3.0 | 2.5 | 1533 | $1,600 | $1.04 | 21d | 1 | 0.31mi |
| 10139 Carlsbad Dr Shreveport, LA | 3.0 | 2.0 | 1464 | $1,800 | $1.23 | 43d | 1 | 0.34mi |
| 10327 Loma Vista Dr Unit 10327 Shreveport, LA | 3.0 | 2.5 | 1474 | $1,590 | $1.08 | 21d | 1 | 0.34mi |
| 236 Settlers Park Dr Shreveport, LA | 2.0 | 1.5 | 958 | $1,300 | $1.36 | 21d | 1 | 0.36mi |
| 10142 Carlsbad Dr Shreveport, LA | 3.0 | 2.5 | 1500 | $1,400 | $0.93 | 21d | 1 | 0.36mi |
| 9505 Balsa Dr Shreveport, LA | 3.0 | 2.5 | 1744 | $1,900 | $1.09 | 13d | 1 | 0.45mi |
| 8525 Chalmette Dr Shreveport, LA | 1.0–2.0 | 1.0–1.5 | 686 | $955 | $1.39 | 13d | 8 | 0.60mi |
| 8117 Captain Mary Miller Dr Shreveport, LA | 3.0 | 2.0 | 1780 | $2,200 | $1.24 | 43d | 1 | 1.06mi |
| 8700 Millicent Way Shreveport, LA | 1.0–2.0 | 1.0–2.0 | 802 | $1,715 | $2.14 | 13d | 6 | 1.22mi |
| 293 Eagle Bend Way Shreveport, LA | 3.0 | 2.0 | 1800 | $2,025 | $1.12 | 43d | 1 | 1.32mi |
| 8501 Millicent Way Shreveport, LA | 1.0–2.0 | 1.0–2.0 | 766 | $1,500 | $1.96 | 13d | 9 | 1.40mi |
HOA detail
- Monthly dues
- $95 · $1,140/yr
- Likely covers
- poolsecurity
Listing history 5 events
-
2026-05-16status Pending 455-char remark
-
2026-05-05$137,900 Active 455-char remark
-
2016-04-25soldstatus $103,500
-
2007-05-21soldstatus
-
2002-10-14soldstatus
ⓘ Source: listings_history table (triggers on properties + properties_extension) + one-shot
backfill from property_details.listing_events for pre-trigger history.
Tax reassessment forecast LA · Resets to sale price
- Current annual tax
- $1,985 · $165/mo
- Projected year-2 tax
- $1,985 · $165/mo
- Expected delta
- $0/yr ($0/mo · 0.0%)
ⓘ Screening estimate from a state-policy table — verify with the county assessor before closing.
Climate risk First Street
- Flood 1/10 Low FEMA zone X · 0% chance over 30 yrs
- Wildfire 3/10 Moderate
- Heat 7/10 Severe 7 d/yr ≥110°F today · 22 d/yr by 30 yrs out
- Wind 6/10 Major 68% chance of damaging wind over 30 yrs
- Air quality 2/10 Low 0 unhealthy d/yr today · 1 by 30 yrs out
Nearby sold comps map
Loading sold comps map…
Walkable amenities ~0.75 mi
Loading nearby amenities…
Taxation est. · year 1
- Rental income
- $18,231
- − Mortgage interest
- −$7,725
- − Property taxes
- −$1,985
- − Insurance
- −$690
- − Repairs & maintenance
- −$1,458
- − Management
- −$1,458
- − HOA
- −$1,140
- − Depreciation
- −$4,012
- Taxable loss
- −$237
- Est. tax savings @ 24.0%
- +$57
- After-tax cash flow
- $1,967/yr
For passive investors: Depreciation is non-cash, so a rental often shows a tax loss while cash-flowing — sheltering income. Rental losses are passive: they offset passive income freely, and up to $25,000/yr can offset ordinary (W-2) income if you actively participate and your MAGI is under $100k (phasing out to $0 by $150k); unused losses carry forward. On sale, claimed depreciation is recaptured at up to 25%, and gains may owe capital-gains tax (a 1031 exchange can defer both). Figures are a year-1 estimate at your 24.0% rate — not tax advice; consult a CPA.
Schools (NCES district)
- District
- Caddo Parish
- NCES district ID
- 2200300
- Math proficiency
- 21% ▼ -33.00%
- Reading proficiency
- 32% ▼ -30.00%
- Median HH income
- $39,227
- Composite
- 22.23/100
- National rank
- #8148
- State rank
- #53 of 98 in LA
Livability — Shreveport
- Score
- 59/100
- State rank
- #270
- US rank
- #19730
Category grades
Schools grade is shown separately in the Schools card above.
Census & demographics
- Census place
- Shreveport, LA
- County
- Caddo Parish · 178,536 people
- City population
- 164,123
- Metro
- Shreveport-Bossier City, LA
- Population (ZIP)
- 14,413
- Household income
- $65,509
- Rent vs Own
- Severe rent burden
- 582.0
Population outlook (Caddo County) Hauer SSP2
- Today (2025)
- 243,190 people
- By 2030
- 237,231 · -2.5%
- By 2040
- 222,502 · -8.5%
- By 2050
- 206,516 · -15.1%
- By 2075
- 165,706 · -31.9%
- By 2100
- 122,262 · -49.7%
Race, ethnicity, and origin ACS 2023
- Neighborhood character
- Predominantly White (66%)
- Race & ethnicity
- White 66% Black 21% Two or more races 5% Asian 5% Hispanic / Latino 3%
- Common ancestry
- Lithuanian 5% Italian 2% Slovak 1%
- Foreign-born
- 6% · China, Canada, Vietnam
- Languages at home
- 91% English-only · Spanish 4% Chinese 2% Other Indo-European 2%
Political lean MEDSL · Caddo
- 2024 margin
- Toss-up / Even · D 51.6% · R 47.0% · Other 1.4%
- 2008→2024 swing
- +1.6pp toward D · 2008: 3.0pp · 2024: 4.6pp
- All cycles
- 2024: D+4.6 2020: D+6.8 2016: D+4.2 2012: D+4.9 2008: D+3.0
Not yet ingested
- Civics
- —
Market trends
- HPI YoY
- ▼ -45.95%
- Current HPI
- 127.4874
- Rent YoY
- ▲ 0.07%
- Metro
- Shreveport-Bossier City, LA
- State GDP YoY
- ▲ 3.29%
- F500 in state
- 10
Industry mix (Fortune 500 HQ in LA)
| Industry | F500 HQs | Revenue |
|---|---|---|
| Telecommunications | 2 | $23B |
|
||
| Utilities | 1 | $12B |
|
||
| Wholesale / Distribution | 1 | $5B |
|
||
| Advertising | 1 | $2B |
|
||
Price history
+33.2% since first listed5 events — show timeline
- 2026-05-16 Pending — NTREIS
- 2026-05-05 Listed $137,900 NTREIS
- 2016-04-25 Sold (Public Records) $103,500 Public Records
- 2007-05-21 Sold (Public Records) — Public Records
- 2002-10-14 Sold (Public Records) — Public Records
Property tax history
+1.3%/yrLatest (2025): $1,985 · +0.4% YoY. Source: county tax records.
Cash-flow waterfall
monthlySold comps — $/sqft
last 12 mo · ≤1 miLoading sold comps…