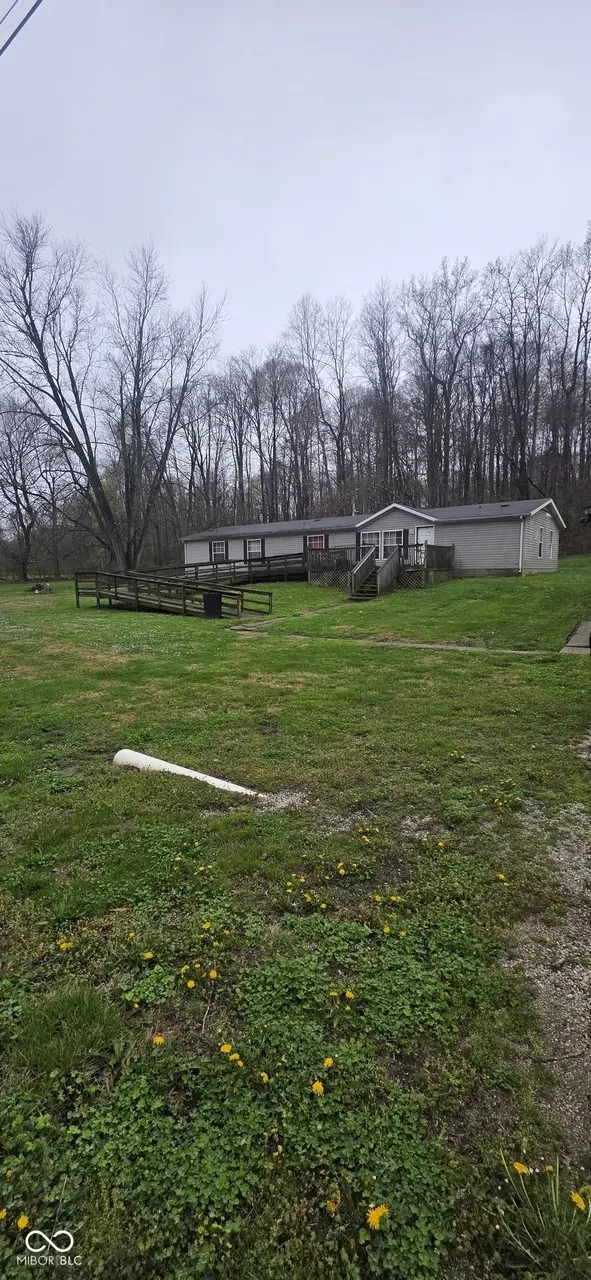
1562 S Bridgeton Rd · Rockville, IN
Flood risk 4/10 · Minor
- FEMA flood zone
- A
- Chance of flooding over 30 yrs
- 0.22%
- Est. flood insurance / yr
- $1,009 – $1,996
Fire risk 1/10 · Minimal
- Est. fire insurance / yr
- $717 – $1,331
Heat risk 3/10 · Minor
- Hot days now (above 104°F)
- 7 days/yr
- Hot days in 30 yrs
- 18 days/yr
Wind risk 2/10 · Minimal
- Chance of severe wind over 30 yrs
- 1.0%
Air-quality risk 3/10 · Minor
- Unhealthy air days now
- 2 days/yr
- Unhealthy air days in 30 yrs
- 3 days/yr
Risk factors via First Street. Map © Google.
Why this score? — see what drove the C+ grade
The composite is a weighted blend of 9 inputs, each scored 0–100. Each bar is that input's sub-score; the figure is the points it added to the 100-point composite (weight × sub-score).
- Cash flow +28.8/30.0
- DSCR +10.0/10.0
- ARV discount +7.5/15.0
- 1% rule +6.8/10.0
- Livability +3.2/5.0
- Schools +2.9/10.0
- Rent growth +2.5/5.0
- Condition / age +2.5/5.0
- Appreciation +0.0/10.0
$130,000
🖨 Deal sheet (PDF) 📄 Offer letter ✓ Due diligence
Listing remarks
Spacious 4 bedroom, 3 bath home set on 2 beautiful acres, offering plenty of room to make it your own! This property includes a detached 2 car garage and a convenient storage shed. The home is a fixer upper and ready for a full remodel. Bring your ideas and imagination to restore it to its full potential. With comparable homes in the area valued around $250K after renovation, this could be a great opportunity for investors or anyone looking for a project home. Features include a newer roof and ample outdoor space. So much potential here. Come see the possibilities!
Key facts
- Ample outdoor space
- Newer roof
- 2 acre lot
Tags
Property features AI
Exterior
- Parking: Detached gravel driveway; 2-car garage
- Utilities: Private water; Septic
- Home design: Single family residence; One story
- Construction: Vinyl siding; Crawl space foundation
- Exterior features: Deck; Mini barn; Not in a subdivision; Mature trees; Wooded lot; Approximately 2 acres
Interior
- Kitchen: Dishwasher; Gas oven; Refrigerator; Electric water heater
- Bedrooms: 4 bedrooms (all on the main level); Bedroom sizes include 14x13, 12x11, 12x11, 12x10
- Bathrooms: 3 full bathrooms (all on the main level)
- Heating & cooling: Forced air heating (Propane); Central air conditioning
- Interior features: Breakfast bar; Handicap accessible interior; Accessible approach with ramp; Accessible full bath
- Laundry & utility: In-unit laundry
Neighborhood map
What this means for you Summary
Snapshot
- This is a 4-bed/2.0-bath single-family listed at $130k.
Deal economics
- At list price, monthly cash flow is $311 ($4k/yr) — positive.
- The deal already cash-flows at list — no discount required.
- Meets the 1% rule at list price ($2k rent vs $130k).
- Recommended offer: $122k (6.0% below list) — sets the bar for market timing.
Location & tenants
- Location reads 64/100 on livability (#372 in IN) — a middle-class / working-renter tenant base. Strengths: crime A+, cost of living A+, housing A+; Watch: employment D+, amenities F, commute F.
- North Central Parke Comm School Corporation (town): math 30% / reading 39% proficiency, ranked #198 of 301 in IN (top 66%) — families likely to look elsewhere, expect single-tenant / working-renter base with shorter leases.
- Zoned schools: Parke Heritage High School (math 12% / reading 57%, grade F, #270 of 369 statewide, top 77%, 341 students, 57% FRL).
- Market conditions: 84 active listings in the ZIP; 61 units permitted in Parke County in 2024 (0 in 5+ unit buildings).
Forward outlook
- Local home prices are declining (-3.0%/yr); year-one equity from $899 of loan paydown is wiped out by about $4k of value loss. Plan a longer hold.
- Parke County population projected at -10% by 2050 — secular population decline; favor cash flow + early exit over multi-decade hold.
Negotiation context
- It's been on market 64 days — a 6% lower offer ($122k) is reasonable based on typical stale-listing flexibility.
Risks & watch-outs
- Watch-outs: flood insurance adds $125/mo.
- Climate carrying-cost: in FEMA flood zone A (mandatory federal flood insurance) — expect insurance premiums to compound above CPI over the hold.
Questions for the listing agent
- It's been on market 64 days. Have you received any prior offers? Is the seller open to a 6% concession, seller financing, or rate buy-down credit?
- What's the actual annual flood-insurance premium (NFIP or private), and is the property in a SFHA with mandatory coverage?
- Why hasn't it sold? Are there any deal-killer items the seller is aware of (foundation, flood, title, zoning, code violations)?
- Is there a deadline driving the sale (1031 exchange, divorce, estate, relocation)? That informs how much negotiation room exists.
- What's the average days-on-market for RENTAL listings here right now (not sales)? A rising rental-DOM trend means longer vacancies and softer asking-rent achievability than the comps imply.
- What's the recent tenant-quality profile in this submarket — average credit score on applications, eviction rate, late-payment / NSF rate, and stable-employment percentage? A property-management company in the area should have these aggregated.
- How much new for-sale + rental construction is in the pipeline within 1–3 miles? Heavy new supply typically softens prices + rents 12–24 months out; constrained supply supports both.
Investment metrics
- 1% rule
- 1.18% ✓
- Cap rate
- 10.32%
- Cash-on-cash
- 14.38%
- DSCR
- 1.64
- GRM
- 7.1
CMA / ARV
No comps found within radius.
Projected returns pro-forma
-3.0% appreciation · 3.0% rent growth · sell at horizon
- IRR
- -0.9%
- Equity multiple
- 0.97×
- Total profit
- $-1,228
- Equity at exit
- $19,383
- IRR
- 8.8%
- Equity multiple
- 1.67×
- Total profit
- $24,539
- Equity at exit
- $11,240
Cash invested: $36,400 (down + closing). Projections, not guarantees.
Landlord ↔ Tenant lean methodology
- Overall (STATE)
- 90 Strongly Landlord-Friendly
- State Indiana
- 90 Strongly Landlord-Friendly · R+11
- County
- — inherits STATE
- City
- — inherits STATE
ZIP-level market 47872
- Home prices YoY
- -7.8%
- Active inventory
- 84
- Price-to-rent
- 7.1×
Monthly cashflow live
- Estimated rent
- $1,531 medium interval (Pro) →
- Mortgage (P&I)
- −$682
- Tax from tax record
- −$37 /mo · $448/yr
- Insurance
- −$54
- Flood insurance flood zone
- −$125 /mo · $1,502/yr
- HOA
- −$0
- Vacancy / Maint / Mgmt
- −$322
- Net cashflow
- $311
Break-even live
Sensitivity live
| Price | -10% $385 | -5% $348 | +0% $311 | +5% $274 | +10% $238 |
|---|---|---|---|---|---|
| Rent | -10% $190 | -5% $251 | +0% $311 | +5% $372 | +10% $432 |
| Rate | -1.0pp $377 | -0.5pp $344 | base $311 | +0.5pp $277 | +1.0pp $243 |
UW: 25.0% down · 7.5% · 30yr · 1.5% tax · 5.0% vac · 8.0% maint · 8.0% mgmt
Financing live
Cash to close
- Down payment
- $32,500
- Closing costs
- $3,900
- Reserves months
- —
- Total cash needed
- —
Loan-product check · same deal, 3 products live
Conventional
25% down · 7.5% · 30yr
- Down + closing
- —
- Monthly P&I
- —
- Monthly cashflow
- —
- DSCR
- —
- Eligible?
- —
Personal DTI + credit; lowest rate.
DSCR
20% down · 8.5% · 30yr
- Down + closing
- —
- Monthly P&I
- —
- Monthly cashflow
- —
- DSCR
- —
- Eligible?
- —
No personal income docs; deal must DSCR.
Hard money
10% down · 12.0% · 12mo
- Down + closing
- —
- Monthly P&I
- —
- Monthly cashflow
- —
- DSCR
- —
- Eligible?
- —
Short-term bridge; refi at stabilization.
Listing history 20 events
-
2026-06-19days on market $130,000 Active 64 DOM
-
2026-06-18days on market $130,000 Active 63 DOM
-
2026-06-17days on market $130,000 Active 62 DOM
-
2026-06-16days on market $130,000 Active 61 DOM
-
2026-06-15days on market $130,000 Active 60 DOM
-
2026-06-14days on market $130,000 Active 58 DOM
-
2026-06-12days on market $130,000 Active 57 DOM
-
2026-06-09days on market $130,000 Active 54 DOM
-
2026-06-08days on market $130,000 Active 53 DOM
-
2026-06-07days on market $130,000 Active 52 DOM
-
2026-06-05days on market $130,000 Active 49 DOM
-
2026-06-03days on market $130,000 Active 48 DOM
-
2026-06-02days on market $130,000 Active 47 DOM
-
2026-06-01days on market $130,000 Active 46 DOM
-
2026-05-31days on market $130,000 Active 45 DOM
-
2026-05-30days on market $130,000 Active 44 DOM
-
2026-05-15price $130,000
-
2026-04-29price $150,000
-
2026-04-24price $155,000
-
2026-04-15$160,000 Active
ⓘ Source: listings_history table (triggers on properties + properties_extension) + one-shot
backfill from property_details.listing_events for pre-trigger history.
Tax reassessment forecast IN · Partial reset (capped growth)
- Current annual tax
- $448 · $37/mo
- Projected year-2 tax
- $776 · $65/mo
- Expected delta
- +$329/yr (+$27/mo · 73.4%)
ⓘ Screening estimate from a state-policy table — verify with the county assessor before closing.
Climate risk First Street
- Flood 4/10 Moderate FEMA zone A · 22% chance over 30 yrs
- Wildfire 1/10 Low
- Heat 3/10 Moderate 7 d/yr ≥104°F today · 18 d/yr by 30 yrs out
- Wind 2/10 Low 100% chance of damaging wind over 30 yrs
- Air quality 3/10 Moderate 2 unhealthy d/yr today · 3 by 30 yrs out
Nearby sold comps map
Loading sold comps map…
Walkable amenities ~0.75 mi
Loading nearby amenities…
Taxation est. · year 1
- Rental income
- $18,372
- − Mortgage interest
- −$7,282
- − Property taxes
- −$448
- − Insurance
- −$2,152
- − Repairs & maintenance
- −$1,470
- − Management
- −$1,470
- − Depreciation
- −$3,782
- Taxable income
- $1,769
- Est. tax owed @ 24.0%
- −$425
- After-tax cash flow
- $3,309/yr
For passive investors: Depreciation is non-cash, so a rental often shows a tax loss while cash-flowing — sheltering income. Rental losses are passive: they offset passive income freely, and up to $25,000/yr can offset ordinary (W-2) income if you actively participate and your MAGI is under $100k (phasing out to $0 by $150k); unused losses carry forward. On sale, claimed depreciation is recaptured at up to 25%, and gains may owe capital-gains tax (a 1031 exchange can defer both). Figures are a year-1 estimate at your 24.0% rate — not tax advice; consult a CPA.
Schools (NCES district)
- District
- North Central Parke Comm School Corporation
- NCES district ID
- 1800118
- Math proficiency
- 30% ▼ -8.00%
- Reading proficiency
- 39% ▼ -4.00%
- Median HH income
- $43,739
- Composite
- 29.31/100
- National rank
- #6553
- State rank
- #198 of 301 in IN
Livability — Rockville
- Score
- 64/100
- State rank
- #372
- US rank
- #13880
Category grades
Schools grade is shown separately in the Schools card above.
Census & demographics
- Population (ZIP)
- 8,641
Population outlook (Parke County) Hauer SSP2
- Today (2025)
- 15,937 people
- By 2030
- 15,467 · -2.9%
- By 2040
- 14,793 · -7.2%
- By 2050
- 14,318 · -10.2%
- By 2075
- 13,484 · -15.4%
- By 2100
- 12,236 · -23.2%
Race, ethnicity, and origin ACS 2023
- Neighborhood character
- Predominantly White (93%)
- Race & ethnicity
- White 93% Black 3% Two or more races 3% Hispanic / Latino 2%
- Common ancestry
- Iranian 3% Lithuanian 2% Slovak 2%
- Foreign-born
- 0%
- Languages at home
- 92% English-only · German/W. Germanic 5% Spanish 2% French/Haitian/Cajun 1%
Political lean MEDSL · Parke
- 2024 margin
- Solid R (+56.9) · D 20.6% · R 77.5% · Other 1.9%
- 2008→2024 swing
- -42.8pp toward R · 2008: -14.1pp · 2024: -56.9pp
- All cycles
- 2024: R+56.9 2020: R+55.5 2016: R+52.0 2012: R+32.6 2008: R+14.1
Not yet ingested
- Civics
- —
Market trends
- HPI YoY
- ▼ -19.85%
- Current HPI
- 234.3039
- Rent YoY
- —
- Metro
- —
- State GDP YoY
- ▲ 2.90%
- F500 in state
- 18
Industry mix (Fortune 500 HQ in IN)
| Industry | F500 HQs | Revenue |
|---|---|---|
| Industrial Machinery | 2 | $37B |
|
||
| Healthcare | 1 | $177B |
|
||
| Pharmaceuticals | 1 | $45B |
|
||
| Metals / Steel | 1 | $18B |
|
||
| Agriculture | 1 | $17B |
|
||
| Packaging | 1 | $12B |
|
||
Price history
-18.8% since first listed4 events — show timeline
- 2026-05-15 Price Changed $130,000 MIBOR as Distributed by MLS Grid
- 2026-04-29 Price Changed $150,000 MIBOR as Distributed by MLS Grid
- 2026-04-24 Price Changed $155,000 MIBOR as Distributed by MLS Grid
- 2026-04-15 Listed $160,000 MIBOR as Distributed by MLS Grid
Property tax history
+4.2%/yrLatest (2024): $448 · -8.8% YoY. Source: county tax records.
Cash-flow waterfall
monthlySold comps — $/sqft
last 12 mo · ≤1 miLoading sold comps…