 6-Plex
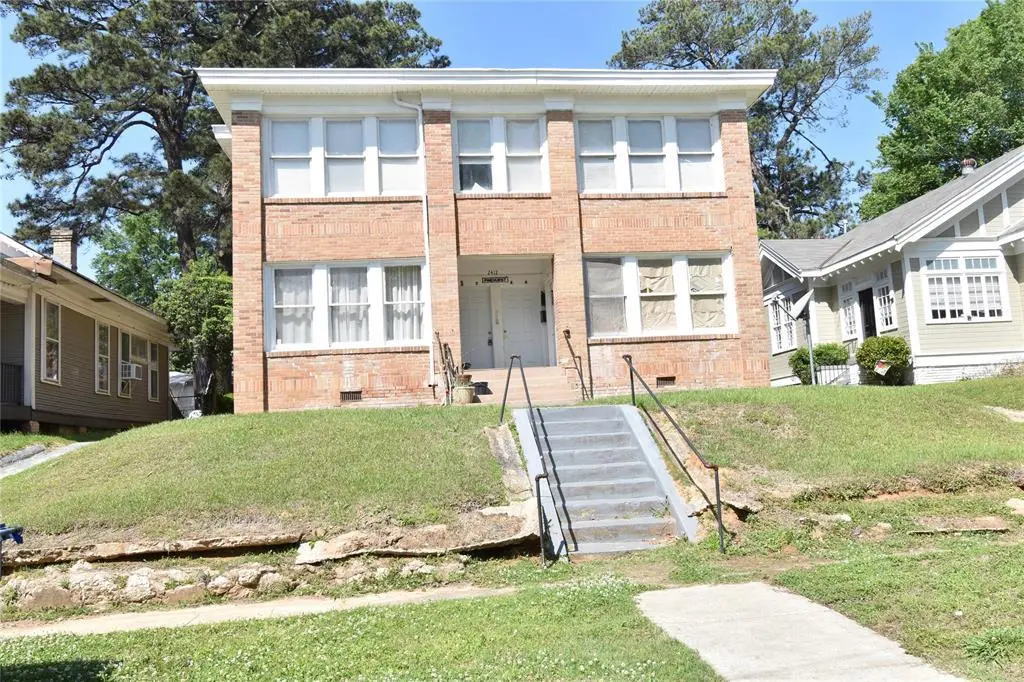
2412 Pinehurst Blvd · Shreveport, LA
Flood risk 1/10 · Minimal
- FEMA flood zone
- X (unshaded)
- Chance of flooding over 30 yrs
- 0.0%
- Est. flood insurance / yr
- $507 – $1,088
Fire risk 1/10 · Minimal
- Est. fire insurance / yr
- $1,269 – $2,357
Heat risk 7/10 · Major
- Hot days now (above 110°F)
- 7 days/yr
- Hot days in 30 yrs
- 22 days/yr
Wind risk 6/10 · Moderate
- Chance of severe wind over 30 yrs
- 66.0%
Air-quality risk 2/10 · Minimal
- Unhealthy air days now
- 1 days/yr
- Unhealthy air days in 30 yrs
- 2 days/yr
Risk factors via First Street. Map © Google.
Why this score? — see what drove the C+ grade
The composite is a weighted blend of 9 inputs, each scored 0–100. Each bar is that input's sub-score; the figure is the points it added to the 100-point composite (weight × sub-score).
- Cash flow +30.0/30.0
- 1% rule +10.0/10.0
- DSCR +10.0/10.0
- Rent growth +3.4/5.0
- Livability +3.0/5.0
- Condition / age +2.5/5.0
- Schools +2.2/10.0
- ARV discount +1.0/15.0
- Appreciation +0.0/10.0
$205,000
🖨 Deal sheet 📄 Offer letter ✓ Due diligence
Multi-family units
County records classify this as Multi-Family (5+ Unit). Listing-text estimate: 6 units. confirmed
5+ unit building — per-unit beds/baths from public records are typically unavailable; the breakdown below (if shown) is an estimate from the listing text.
Listing remarks MLS
Want some mailbox money??? I have what you need to kick back and collect!!! Highland 6-plex. Downstairs contains two 2BR,1BA units and four upstairs 1BR,1BA units. Upstairs units are all bills paid. Downstairs, the tenant pays electric. Two units are occupied, 4 are vacant, with a little TLC, you could be the savvy investor you have always aspired to be!!! This property could be sold independently or as a package for $545K, MLS#21239279 313 Wilkinson Street Tri-Plex, MLS# 21238502,2024 Highland Ave 4Plex
Key facts
- 7,536 sq ft lot
- 6 parking spots
- Built 1940
Neighborhood map
What this means for you Summary
Snapshot
- This is a 6 × 8-bed/6.0-bath units multifamily listed at $205k.
Deal economics
- At list price, monthly cash flow is $5k ($60k/yr) — positive. Per door: $828/mo.
- The deal already cash-flows at list — no discount required.
- Meets the 1% rule at list price ($8k rent vs $205k).
- Recommended offer: $193k (6.0% below list) — sets the bar for market timing.
- Cap rate 35.4% vs local median 5.7% in Shreveport — top-decile yield for the area; either an underpriced asset or a hidden risk that comps aren't pricing in. Stress-test before assuming the spread holds.
Location & tenants
- Location reads 59/100 on livability (#270 in LA) — a working-class tenant base; expect higher turnover. Strengths: cost of living A+, housing A; Watch: schools D+, crime F, amenities F.
- Caddo Parish (urban): math 21% / reading 32% proficiency, ranked #53 of 98 in LA (top 54%) — low school quality limits family demand, transient renter base, plan for 1-2y turnover; 64% free/reduced lunch — lower-income household profile, screen leases tightly.
- Market conditions: Rents rising (+3.6%/yr); 146 active listings in the ZIP; 221 units permitted in Caddo Parish in 2024 (0 in 5+ unit buildings).
- At $8,033/mo this rent would consume 170% of the median local household income ($57k/yr) (locally 759% of renters already pay >50% of income on rent) — very limited rent-growth headroom before tenants either downsize or default.
Forward outlook
- Local home prices are declining (-3.0%/yr); year-one equity from $1k of loan paydown is wiped out by about $6k of value loss. Plan a longer hold.
- Caddo County population projected at -15% by 2050 — secular population decline; favor cash flow + early exit over multi-decade hold.
- At projected returns (-3.0% appreciation + 3.6% rent growth), your $57k cash investment doubles in ~2 years — after that, you're playing with house money.
Negotiation context
- It's been on market 61 days — a 6% lower offer ($193k) is reasonable based on typical stale-listing flexibility.
- 5 sale attempts since 4y ago with the ask held roughly flat each time — persistent listings suggest the price (not the market) is what's stuck; bring a comps-based counter.
Risks & watch-outs
- Watch-outs: built in 1940 — expect roof / HVAC / electrical / plumbing capex.
- Climate carrying-cost: major wind risk, 66% chance of damaging wind over 30y; extreme-heat days projected 7→22/yr by 2055 (HVAC capex compounding) — expect insurance premiums to compound above CPI over the hold.
Questions for the listing agent
- It's been on market 61 days. Have you received any prior offers? Is the seller open to a 6% concession, seller financing, or rate buy-down credit?
- Can we see the unit-by-unit rent roll, current vacancy, and any below-market leases? What's the average tenancy length?
- What capital expenditures (roof, boiler, parking lot, exteriors) have been made in the last 5 years, and what's planned in the next 2?
- Built in 1940 — when were the roof, HVAC, electrical panel, plumbing, and water heater last replaced?
- Why hasn't it sold? Are there any deal-killer items the seller is aware of (foundation, flood, title, zoning, code violations)?
- Is there a deadline driving the sale (1031 exchange, divorce, estate, relocation)? That informs how much negotiation room exists.
- Schools are D-rated, which usually means shorter tenancies and higher turnover. Who's the typical renter profile here, and what's been the actual vacancy rate?
- Crime grade is F in this area — have there been break-ins, vandalism, or insurance claims at this property in the last 3 years? What carrier currently insures it and at what premium?
- What's the average days-on-market for RENTAL listings here right now (not sales)? A rising rental-DOM trend means longer vacancies and softer asking-rent achievability than the comps imply.
- What's the recent tenant-quality profile in this submarket — average credit score on applications, eviction rate, late-payment / NSF rate, and stable-employment percentage? A property-management company in the area should have these aggregated.
- How much new apartment / multifamily construction is in the pipeline within 1–3 miles? Heavy new supply (>2% of stock underway) typically softens rents 12–24 months out; light construction supports rent growth.
Investment metrics
- 1% rule
- 3.92% ✓
- Cap rate
- 35.37%
- Cash-on-cash
- 103.85%
- DSCR
- 5.62
- GRM
- 2.1
CMA / ARV
- ARV (median comp)
- $178,953
- List price
- $205,000
- Delta
- 14.55%
- Verdict
- OVERPRICED
- Comps
- 20 within 1.0 mi
Projected returns pro-forma
-3.0% appreciation · 3.56% rent growth · sell at horizon
- IRR
- —
- Equity multiple
- 6.01×
- Total profit
- $287,801
- Equity at exit
- $30,566
- IRR
- —
- Equity multiple
- 12.80×
- Total profit
- $677,277
- Equity at exit
- $17,725
Cash invested: $57,400 (down + closing). Projections, not guarantees.
Landlord ↔ Tenant lean methodology
- Overall (STATE)
- 90 Strongly Landlord-Friendly
- State Louisiana
- 90 Strongly Landlord-Friendly · R+12
- County
- — inherits STATE
- City
- — inherits STATE
ZIP-level market 71104
- Home prices YoY
- -32.2%
- Rents YoY
- 3.6%
- Active inventory
- 146
- Price-to-rent
- 12.8×
Monthly cashflow live
- Estimated rent
- $8,033 medium interval (Pro) →
- Mortgage (P&I)
- −$1,075
- Tax from tax record
- −$218 /mo · $2,620/yr
- Insurance
- −$85
- HOA
- −$0
- Vacancy / Maint / Mgmt
- −$1,687
- Net cashflow
- $4,967
Break-even live
6-unit breakdown (identical units grouped — click to expand)
| Units | Beds | Baths | Est. rent |
|---|---|---|---|
| 6× units | 8 | 6 | $8,034 |
| #1 | 8 | 6 | $1,339 |
| #2 | 8 | 6 | $1,339 |
| #3 | 8 | 6 | $1,339 |
| #4 | 8 | 6 | $1,339 |
| #5 | 8 | 6 | $1,339 |
| #6 | 8 | 6 | $1,339 |
| Total (6 units) | $8,033 | ||
UW: 25.0% down · 7.5% · 30yr · 1.5% tax · 5.0% vac · 8.0% maint · 8.0% mgmt
Financing live
Cash to close
- Down payment
- $51,250
- Closing costs
- $6,150
- Reserves months
- —
- Total cash needed
- —
Loan-product check · same deal, 3 products live
Conventional
25% down · 7.5% · 30yr
- Down + closing
- —
- Monthly P&I
- —
- Monthly cashflow
- —
- DSCR
- —
- Eligible?
- —
Personal DTI + credit; lowest rate.
DSCR
20% down · 8.5% · 30yr
- Down + closing
- —
- Monthly P&I
- —
- Monthly cashflow
- —
- DSCR
- —
- Eligible?
- —
No personal income docs; deal must DSCR.
Hard money
10% down · 12.0% · 12mo
- Down + closing
- —
- Monthly P&I
- —
- Monthly cashflow
- —
- DSCR
- —
- Eligible?
- —
Short-term bridge; refi at stabilization.
Listing history 28 events
-
2026-06-16status $205,000 Pending 61 DOM
-
2026-06-16days on market $205,000 Active Contingent 61 DOM
-
2026-06-15days on market $205,000 Active Contingent 60 DOM
-
2026-06-14days on market $205,000 Active Contingent 58 DOM
-
2026-06-13days on market $205,000 Active Contingent 57 DOM
-
2026-06-10days on market $205,000 Active Contingent 55 DOM
-
2026-06-09days on market $205,000 Active Contingent 54 DOM
-
2026-06-08days on market $205,000 Active Contingent 53 DOM
-
2026-06-07days on market $205,000 Active Contingent 52 DOM
-
2026-06-05statusdays on market $205,000 Active Contingent 49 DOM
-
2026-06-03days on market $205,000 Active 48 DOM
-
2026-06-02days on market $205,000 Active 47 DOM
-
2026-06-01days on market $205,000 Active 46 DOM
-
2026-05-31days on market $205,000 Active 45 DOM
-
2026-05-30days on market $205,000 Active 44 DOM
-
2026-04-16$205,000 Active 509-char remark
Show marketing remark (509 chars)
Want some mailbox money??? I have what you need to kick back and collect!!! Highland 6-plex. Downstairs contains two 2BR,1BA units and four upstairs 1BR,1BA units. Upstairs units are all bills paid. Downstairs, the tenant pays electric. Two units are occupied, 4 are vacant, with a little TLC, you could be the savvy investor you have always aspired to be!!! This property could be sold independently or as a package for $545K, MLS#21239279 313 Wilkinson Street Tri-Plex, MLS# 21238502,2024 Highland Ave 4Plex
-
2025-10-01historical $775
-
2025-07-31$775
-
2025-07-03historical $775
-
2024-03-05$775
-
2022-04-14soldstatus Closed 83-char remark
Show marketing remark (83 chars)
Highland 6-plex. Downstairs contains two 2bd 1ba & upstairs four 1bd 1ba units.
-
2022-04-14soldstatus $255,000
Show marketing remark (83 chars)
Highland 6-plex. Downstairs contains two 2bd 1ba & upstairs four 1bd 1ba units.
-
2022-03-02status Pending 83-char remark
Show marketing remark (83 chars)
Highland 6-plex. Downstairs contains two 2bd 1ba & upstairs four 1bd 1ba units.
-
2022-02-11status Pending 83-char remark
Show marketing remark (83 chars)
Highland 6-plex. Downstairs contains two 2bd 1ba & upstairs four 1bd 1ba units.
-
2022-02-07status Active 83-char remark
Show marketing remark (83 chars)
Highland 6-plex. Downstairs contains two 2bd 1ba & upstairs four 1bd 1ba units.
-
2022-01-26status Pending 83-char remark
Show marketing remark (83 chars)
Highland 6-plex. Downstairs contains two 2bd 1ba & upstairs four 1bd 1ba units.
-
2022-01-05$175,000 Active 83-char remark
Show marketing remark (83 chars)
Highland 6-plex. Downstairs contains two 2bd 1ba & upstairs four 1bd 1ba units.
-
2013-04-01soldstatus $120,000
ⓘ Source: listings_history table (triggers on properties + properties_extension) + one-shot
backfill from property_details.listing_events for pre-trigger history.
Tax reassessment forecast LA · Resets to sale price
- Current annual tax
- $2,620 · $218/mo
- Projected year-2 tax
- $2,620 · $218/mo
- Expected delta
- $0/yr ($0/mo · 0.0%)
ⓘ Screening estimate from a state-policy table — verify with the county assessor before closing.
Climate risk First Street
- Flood 1/10 Low FEMA zone X (unshaded) · 0% chance over 30 yrs
- Wildfire 1/10 Low
- Heat 7/10 Severe 7 d/yr ≥110°F today · 22 d/yr by 30 yrs out
- Wind 6/10 Major 66% chance of damaging wind over 30 yrs
- Air quality 2/10 Low 1 unhealthy d/yr today · 2 by 30 yrs out
Nearby sold comps map
Loading sold comps map…
Walkable amenities ~0.75 mi
Loading nearby amenities…
Taxation est. · year 1
- Rental income
- $96,396
- − Mortgage interest
- −$11,483
- − Property taxes
- −$2,620
- − Insurance
- −$1,025
- − Repairs & maintenance
- −$7,712
- − Management
- −$7,712
- − Depreciation
- −$5,964
- Taxable income
- $59,881
- Est. tax owed @ 24.0%
- −$14,371
- After-tax cash flow
- $45,236/yr
For passive investors: Depreciation is non-cash, so a rental often shows a tax loss while cash-flowing — sheltering income. Rental losses are passive: they offset passive income freely, and up to $25,000/yr can offset ordinary (W-2) income if you actively participate and your MAGI is under $100k (phasing out to $0 by $150k); unused losses carry forward. On sale, claimed depreciation is recaptured at up to 25%, and gains may owe capital-gains tax (a 1031 exchange can defer both). Figures are a year-1 estimate at your 24.0% rate — not tax advice; consult a CPA.
Schools (NCES district)
- District
- Caddo Parish
- NCES district ID
- 2200300
- Math proficiency
- 21% ▼ -33.00%
- Reading proficiency
- 32% ▼ -30.00%
- Median HH income
- $39,227
- Composite
- 22.23/100
- National rank
- #8148
- State rank
- #53 of 98 in LA
Livability — Shreveport
- Score
- 59/100
- State rank
- #270
- US rank
- #19730
Category grades
Schools grade is shown separately in the Schools card above.
Census & demographics
- Census place
- Shreveport, LA
- County
- Caddo Parish · 178,536 people
- City population
- 164,123
- Metro
- Shreveport-Bossier City, LA
- Population (ZIP)
- 12,975
- Household income
- $56,833
- Rent vs Own
- Severe rent burden
- 759.0
Population outlook (Caddo County) Hauer SSP2
- Today (2025)
- 243,190 people
- By 2030
- 237,231 · -2.5%
- By 2040
- 222,502 · -8.5%
- By 2050
- 206,516 · -15.1%
- By 2075
- 165,706 · -31.9%
- By 2100
- 122,262 · -49.7%
Race, ethnicity, and origin ACS 2023
- Neighborhood character
- Diverse neighborhood (Simpson 0.63)
- Race & ethnicity
- White 53% Black 28% Two or more races 10% Hispanic / Latino 10% Asian 3%
- Hispanic origin (detail)
- Mexican 7%
- Common ancestry
- Slovak 6% Lithuanian 4% Scottish 2%
- Foreign-born
- 5% · Canada, Vietnam
- Languages at home
- 90% English-only · Spanish 5% French/Haitian/Cajun 1% Tagalog/Filipino 1%
Political lean MEDSL · Caddo
- 2024 margin
- Toss-up / Even · D 51.6% · R 47.0% · Other 1.4%
- 2008→2024 swing
- +1.6pp toward D · 2008: 3.0pp · 2024: 4.6pp
- All cycles
- 2024: D+4.6 2020: D+6.8 2016: D+4.2 2012: D+4.9 2008: D+3.0
Not yet ingested
- Civics
- —
Market trends
- HPI YoY
- ▼ -49.61%
- Current HPI
- 104.3781
- Rent YoY
- ▲ 3.56%
- Metro
- Shreveport-Bossier City, LA
- State GDP YoY
- ▲ 3.29%
- F500 in state
- 10
Industry mix (Fortune 500 HQ in LA)
| Industry | F500 HQs | Revenue |
|---|---|---|
| Telecommunications | 2 | $23B |
|
||
| Utilities | 1 | $12B |
|
||
| Wholesale / Distribution | 1 | $5B |
|
||
| Advertising | 1 | $2B |
|
||
Price history
+70.8% since first listed13 events — show timeline
- 2026-04-16 Listed $205,000 NTREIS
- 2025-10-01 Rental Removed $775 NTREIS
- 2025-07-31 Listed for Rent $775 NTREIS
- 2025-07-03 Rental Removed $775 NTREIS
- 2024-03-05 Listed for Rent $775 NTREIS
- 2022-04-14 Sold (Public Records) $255,000 Public Records
- 2022-04-14 Sold (MLS) — NTREIS
- 2022-03-02 Pending — NTREIS
- 2022-02-11 Pending — NTREIS
- 2022-02-07 Relisted — NTREIS
- 2022-01-26 Pending — NTREIS
- 2022-01-05 Listed $175,000 NTREIS
- 2013-04-01 Sold (Public Records) $120,000 Public Records
Property tax history
+5.0%/yrLatest (2025): $2,620 · +0.1% YoY. Source: county tax records.
Cash-flow waterfall
monthlySold comps — $/sqft
last 12 mo · ≤1 miLoading sold comps…