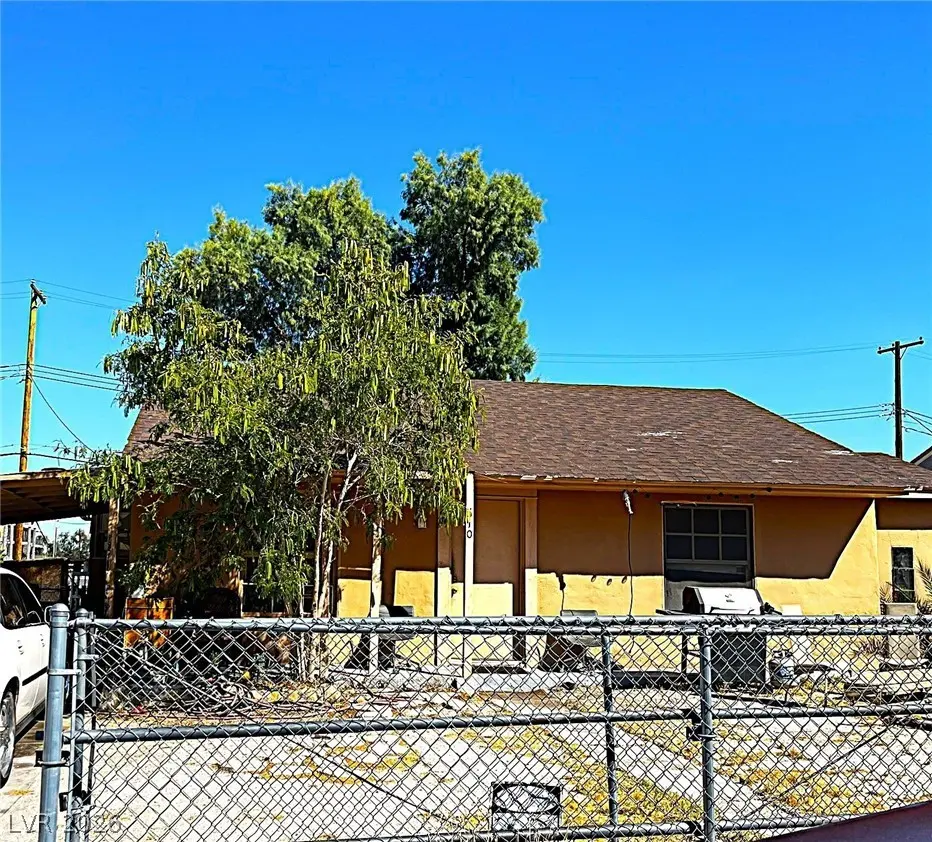
610 N 4th St · Las Vegas, NV
Flood risk 1/10 · Minimal
- FEMA flood zone
- X (unshaded)
- Chance of flooding over 30 yrs
- 0.0%
- Est. flood insurance / yr
- $507 – $1,088
Fire risk 1/10 · Minimal
- Est. fire insurance / yr
- $490 – $910
Heat risk 8/10 · Major
- Hot days now (above 107°F)
- 7 days/yr
- Hot days in 30 yrs
- 18 days/yr
Wind risk 1/10 · Minimal
- Chance of severe wind over 30 yrs
- —
Air-quality risk 4/10 · Minor
- Unhealthy air days now
- 4 days/yr
- Unhealthy air days in 30 yrs
- 5 days/yr
Risk factors via First Street. Map © Google.
Why this score? — see what drove the C- grade
The composite is a weighted blend of 9 inputs, each scored 0–100. Each bar is that input's sub-score; the figure is the points it added to the 100-point composite (weight × sub-score).
- Cash flow +22.9/30.0
- ARV discount +7.5/15.0
- DSCR +7.3/10.0
- 1% rule +4.8/10.0
- Livability +4.0/5.0
- Rent growth +3.1/5.0
- Schools +2.6/10.0
- Condition / age +2.5/5.0
- Appreciation +0.0/10.0
$160,000
🖨 Deal sheet 📄 Offer letter ✓ Due diligence
Listing remarks MLS
DOWNTOWN BUNGALOW NEAR NEW ZAPPO'S. .. CERAMIC 16" TILE IN KITCHEN/BATH. ORIGINAL TURQUOISE TILE IN BATHROOM. EZ CARE YARD. BUYER WILL NEED TO INSTALL CARPET IN BEDROOMS/LIVING ROOM. FRESH PAINT, HOUSE IS CLEAN AND READY. NEW UNDERGROUND DRAIN & WATER LINES RECENTLY INSTALLED.
Key facts
- 5,663 sq ft lot
- Built 1943
- Listed 31 days
Tags
Property features AI
Finance
- Other: Annual taxes listed
- Financial info: Current lease in place ($1,000 monthly, expires 2026-05-30)
Exterior
- Parking: Open parking
- Utilities: Public water; Public sewer; Electricity available
- Home design: Single-family property; Single-story; Faces east; Resale (fixer condition)
- Construction: Frame and stucco construction; Composition/shingle pitched roof
- Exterior features: Private yard; Partial chain link fencing; Paved road access; Residential use
Interior
- Kitchen: Laminate countertops; Linoleum/vinyl flooring in kitchen; Electric range
- Bedrooms: Space for 2 possible bedrooms; Bedroom 2 with closet (10 x 10); Additional bedroom/room with closet (12 x 14)
- Flooring: Carpet; Linoleum; Vinyl
- Bathrooms: 1 full bathroom
- Heating & cooling: Central heating (electric); Central refrigerated/electric cooling
- Interior features: Blinds; Window treatments; Unfurnished; Primary bedroom on main level; Bedroom on main level
- Laundry & utility: Electric dryer hookup on main level; Electric water heater
Neighborhood map
What this means for you Summary
Snapshot
- This is a 2-bed/1.0-bath single-family listed at $160k.
Deal economics
- At list price, monthly cash flow is $280 ($3k/yr) — positive.
- The deal already cash-flows at list — no discount required.
- To meet the 1% rule (rent ≥ 1% of price), the offer needs to be $157k (2.0% below list).
- Recommended offer: $155k (3.0% below list) — sets the bar for market timing.
Location & tenants
- Location reads 80/100 on livability (#2 in NV, #1,723 nationally) — a professional / high-income tenant draw. Strengths: amenities A+, commute A+, housing A+; Watch: crime F.
- Clark County School District (urban): math 21% / reading 39% proficiency, ranked #11 of 17 in NV (top 65%) — families likely to look elsewhere, expect single-tenant / working-renter base with shorter leases.
- Market conditions: Rents rising (+2.5%/yr); 188 active listings in the ZIP; 40 comparable units currently listed for rent nearby; rentals lingering (median 44d on market — plan ~5-8 weeks vacancy on turnover, expect pricing pressure); 70% of comp listings sitting > 30 days — soft ceiling on asking rent; lower-income renter base — watch delinquency; 14,754 units permitted in Clark County in 2024 (2,301 in 5+ unit buildings).
- At $1,568/mo this rent would consume 48% of the median local household income ($39k/yr) (locally 3814% of renters already pay >50% of income on rent) — very limited rent-growth headroom before tenants either downsize or default.
Forward outlook
- Local home prices are declining (-3.0%/yr); year-one equity from $1k of loan paydown is wiped out by about $5k of value loss. Plan a longer hold.
- Clark County population projected at +36% by 2050 — long-run rental-demand tailwind backs the buy-and-hold thesis.
Negotiation context
- It's been on market 31 days — a 3% lower offer ($155k) is reasonable based on typical stale-listing flexibility.
- 2 sale attempts since 13y ago; this cycle's ask has dropped $125k (44%) from the opening price — seller is motivated, your offer sets the floor, not the list.
- Current owner paid $60k; list at $160k implies a 167% gain — meaningful room to come down on a strong offer.
Risks & watch-outs
- Watch-outs: built in 1943 — expect roof / HVAC / electrical / plumbing capex.
- Climate carrying-cost: extreme-heat days projected 7→18/yr by 2055 (HVAC capex compounding) — expect insurance premiums to compound above CPI over the hold.
Questions for the listing agent
- It's been on market 31 days. Have you received any prior offers? Is the seller open to a 3% concession, seller financing, or rate buy-down credit?
- Built in 1943 — when were the roof, HVAC, electrical panel, plumbing, and water heater last replaced?
- Is there a deadline driving the sale (1031 exchange, divorce, estate, relocation)? That informs how much negotiation room exists.
- Crime grade is F in this area — have there been break-ins, vandalism, or insurance claims at this property in the last 3 years? What carrier currently insures it and at what premium?
- What's the average days-on-market for RENTAL listings here right now (not sales)? A rising rental-DOM trend means longer vacancies and softer asking-rent achievability than the comps imply.
- What's the recent tenant-quality profile in this submarket — average credit score on applications, eviction rate, late-payment / NSF rate, and stable-employment percentage? A property-management company in the area should have these aggregated.
- How much new for-sale + rental construction is in the pipeline within 1–3 miles? Heavy new supply typically softens prices + rents 12–24 months out; constrained supply supports both.
Investment metrics
- 1% rule
- 0.98% ✗
- Cap rate
- 8.39%
- Cash-on-cash
- 7.50%
- DSCR
- 1.33
- GRM
- 8.5
CMA / ARV
No comps found within radius.
Projected returns pro-forma
-3.0% appreciation · 2.51% rent growth · sell at horizon
- IRR
- -5.4%
- Equity multiple
- 0.80×
- Total profit
- $-8,925
- Equity at exit
- $23,857
- IRR
- 3.7%
- Equity multiple
- 1.26×
- Total profit
- $11,801
- Equity at exit
- $13,834
Cash invested: $44,800 (down + closing). Projections, not guarantees.
Landlord ↔ Tenant lean methodology
- Overall (STATE)
- 71 Landlord-Friendly
- State Nevada
- 71 Landlord-Friendly · R+1
- County
- — inherits STATE
- City
- — inherits STATE
ZIP-level market 89101
- Home prices YoY
- -22.8%
- Rents YoY
- 2.5%
- Active inventory
- 188
- Price-to-rent
- 8.5×
Monthly cashflow live
- Estimated rent
- $1,568 high interval (Pro) →
- Mortgage (P&I)
- −$839
- Tax from tax record
- −$53 /mo · $636/yr
- Insurance
- −$67
- HOA
- −$0
- Vacancy / Maint / Mgmt
- −$329
- Net cashflow
- $280
Break-even live
UW: 25.0% down · 7.5% · 30yr · 1.5% tax · 5.0% vac · 8.0% maint · 8.0% mgmt
Financing live
Cash to close
- Down payment
- $40,000
- Closing costs
- $4,800
- Reserves months
- —
- Total cash needed
- —
Loan-product check · same deal, 3 products live
Conventional
25% down · 7.5% · 30yr
- Down + closing
- —
- Monthly P&I
- —
- Monthly cashflow
- —
- DSCR
- —
- Eligible?
- —
Personal DTI + credit; lowest rate.
DSCR
20% down · 8.5% · 30yr
- Down + closing
- —
- Monthly P&I
- —
- Monthly cashflow
- —
- DSCR
- —
- Eligible?
- —
No personal income docs; deal must DSCR.
Hard money
10% down · 12.0% · 12mo
- Down + closing
- —
- Monthly P&I
- —
- Monthly cashflow
- —
- DSCR
- —
- Eligible?
- —
Short-term bridge; refi at stabilization.
Rent comps 40 comps
| Address | Beds | Baths | Sqft | Rent | $/sqft | DOM | Units | Dist |
|---|---|---|---|---|---|---|---|---|
| 611 Bell Dr Las Vegas, NV | 3.0 | 1.0 | 832 | $1,850 | $2.22 | 43d | 1 | 0.12mi |
| 904 Biltmore Dr Las Vegas, NV | 2.0 | 1.0 | 984 | $1,470 | $1.49 | 43d | 1 | 0.26mi |
| 625 N 12th St Unit 1 Las Vegas, NV | 2.0 | 2.0 | 874 | $1,195 | $1.37 | 43d | 1 | 0.38mi |
| 701 N 13th St Las Vegas, NV | 1.0–2.0 | 1.0 | 591 | $1,285 | $2.17 | 43d | 15 | 0.40mi |
| 150 Las Vegas Blvd N Las Vegas, NV | 1.0–3.0 | 1.5–2.5 | 1347 | $2,650 | $1.97 | 43d | 7 | 0.44mi |
| 150 Las Vegas Blvd N Las Vegas, NV | 1.0–3.0 | 1.5–2.5 | 1405 | $2,932 | $2.09 | 7d | 6 | 0.44mi |
| 320 N 10th St Unit A Las Vegas, NV | 3.0 | 2.0 | 996 | $1,750 | $1.76 | 43d | 1 | 0.49mi |
| 1011 N 4th St Las Vegas, NV | 1.0 | 1.0 | 750 | $1,250 | $1.67 | 43d | 1 | 0.52mi |
| 311 N 11th St Unit D Las Vegas, NV | 1.0 | 1.0 | 657 | $995 | $1.51 | 43d | 1 | 0.53mi |
| 210 N 10th St Unit 3 Las Vegas, NV | 1.0 | 1.0 | 576 | $775 | $1.35 | 43d | 1 | 0.57mi |
| 416 N 14th St Las Vegas, NV | 2.0 | 1.0 | 771 | $1,250 | $1.62 | 43d | 1 | 0.59mi |
| 1400 E Mesquite Ave Unit 5 Las Vegas, NV | 2.0 | 1.0 | 800 | $1,000 | $1.25 | 43d | 1 | 0.60mi |
| 1404 E Mesquite Ave Unit 8 Las Vegas, NV | 2.0 | 1.0 | 1000 | $1,000 | $1.00 | 43d | 1 | 0.61mi |
| 901 Fremont St Las Vegas, NV | 3.0 | 1.0–2.0 | 862 | $2,304 | $2.67 | 2d | 34 | 0.66mi |
| 383 N 15th St Las Vegas, NV | 2.0 | 1.0 | 770 | $1,200 | $1.56 | 43d | 1 | 0.67mi |
| 203 N 13th St Unit 203 Las Vegas, NV | 1.0 | 1.0 | 720 | $1,180 | $1.64 | 43d | 1 | 0.71mi |
| 205 N 13th St Unit 205 Las Vegas, NV | 1.0 | 1.0 | 628 | $1,180 | $1.88 | 43d | 1 | 0.72mi |
| 368 N 15th St Unit B Las Vegas, NV | 2.0 | 1.0 | 837 | $1,250 | $1.49 | 43d | 1 | 0.72mi |
| 224 N 13th St Las Vegas, NV | 2.0 | 1.0 | 817 | $1,110 | $1.36 | 43d | 2 | 0.72mi |
| 218 N 13th St Las Vegas, NV | 1.0 | 1.0 | 650 | $950 | $1.46 | 43d | 1 | 0.73mi |
| 312 N 14th St Apt A Las Vegas, NV | 2.0 | 1.0 | 833 | $1,025 | $1.23 | 43d | 1 | 0.76mi |
| 119 N 14th St Unit A Las Vegas, NV | 1.0 | 1.0 | 575 | $1,155 | $2.01 | 43d | 1 | 0.80mi |
| 119 N 14th St Unit B Las Vegas, NV | 1.0 | 1.0 | 575 | $1,055 | $1.83 | 43d | 1 | 0.80mi |
| 308 S 10th St #1 Las Vegas, NV | 2.0 | 1.0 | 1050 | $2,175 | $2.07 | 23d | 1 | 0.81mi |
| 250 S City Pkwy Las Vegas, NV | 2.0 | 1.0–3.0 | 1207 | $3,452 | $2.86 | 2d | 27 | 0.82mi |
| 250 Promenade Pl Las Vegas, NV | 1.0–2.0 | 1.0–2.5 | 984 | $3,230 | $3.28 | 2d | 48 | 0.89mi |
| 214 S 14th St Unit 210 Las Vegas, NV | 1.0 | 1.0 | 546 | $1,095 | $2.01 | 43d | 1 | 0.92mi |
| 255 Promenade Pl Las Vegas, NV | 3.0 | 1.0–3.5 | 1850 | $2,730 | $1.48 | 3d | 266 | 0.93mi |
| 353 E Bonneville Ave Las Vegas, NV | 2.0 | 1.0–2.0 | 958 | $4,000 | $4.17 | 43d | 20 | 0.98mi |
| 353 E Bonneville Ave Las Vegas, NV | 1.0–2.0 | 1.0–2.5 | 1190 | $4,000 | $3.36 | 2d | 13 | 0.98mi |
| 353 E Bonneville Ave Las Vegas, NV | 1.0–2.0 | 1.0–2.5 | 1190 | $4,000 | $3.36 | 4d | 12 | 0.98mi |
| 1209 H St Las Vegas, NV | 3.0 | 2.0 | 1125 | $2,200 | $1.96 | 22d | 1 | 1.03mi |
| 1209 H St Las Vegas, NV | 3.0 | 2.0 | 1125 | $2,200 | $1.96 | 20d | 1 | 1.03mi |
| 424 S 13th St Las Vegas, NV | 1.0 | 1.0 | 650 | $998 | $1.54 | 43d | 3 | 1.04mi |
| 405 S 15th St Las Vegas, NV | 1.0 | 1.0 | 596 | $1,040 | $1.74 | 43d | 1 | 1.09mi |
| 521 S Maryland Pkwy Apt A16 Las Vegas, NV | 1.0 | 1.0 | 550 | $750 | $1.36 | 43d | 1 | 1.10mi |
| 1309 N 22nd St Las Vegas, NV | 1.0 | 1.0 | 701 | $850 | $1.21 | 23d | 1 | 1.16mi |
| 1309 N 23rd St Las Vegas, NV | 2.0 | 1.0 | 885 | $990 | $1.12 | 43d | 1 | 1.21mi |
| 200 Hoover Ave Las Vegas, NV | 1.0–2.0 | 1.0–2.0 | 1200 | $2,600 | $2.17 | 3d | 3 | 1.22mi |
| 200 Hoover Ave Las Vegas, NV | 2.0 | 1.0–2.0 | 1279 | $3,000 | $2.35 | 43d | 4 | 1.22mi |
Listing history 22 events
-
2026-06-19price $160,000 Active 31 DOM
-
2026-06-18days on market $285,000 Active 31 DOM
-
2026-06-17days on market $285,000 Active 30 DOM
-
2026-06-16statusdays on market $285,000 Active 29 DOM
-
2026-06-15days on market $285,000 Active Under Contract 28 DOM
-
2026-06-13days on market $285,000 Active Under Contract 26 DOM
-
2026-06-10status $285,000 Active Under Contract 22 DOM
-
2026-06-09days on market $285,000 Active 22 DOM
-
2026-06-08days on market $285,000 Active 21 DOM
-
2026-06-07days on market $285,000 Active 20 DOM
-
2026-06-03days on market $285,000 Active 16 DOM
-
2026-06-02days on market $285,000 Active 15 DOM
-
2026-06-01days on market $285,000 Active 14 DOM
-
2026-05-31days on market $285,000 Active 13 DOM
-
2026-05-14$285,000 Active
-
2013-06-04historical 288-char remark
Show marketing remark (288 chars)
DOWNTOWN BUNGALOW NEAR NEW ZAPPO'S. .. CERAMIC 16" TILE IN KITCHEN/BATH. ORIGINAL TURQUOISE TILE IN BATHROOM. EZ CARE YARD. BUYER WILL NEED TO INSTALL CARPET IN BEDROOMS/LIVING ROOM. FRESH PAINT, HOUSE IS CLEAN AND READY. NEW UNDERGROUND DRAIN & WATER LINES RECENTLY INSTALLED.
-
2013-06-03soldstatus $60,000 Sold 288-char remark
Show marketing remark (288 chars)
DOWNTOWN BUNGALOW NEAR NEW ZAPPO'S. .. CERAMIC 16" TILE IN KITCHEN/BATH. ORIGINAL TURQUOISE TILE IN BATHROOM. EZ CARE YARD. BUYER WILL NEED TO INSTALL CARPET IN BEDROOMS/LIVING ROOM. FRESH PAINT, HOUSE IS CLEAN AND READY. NEW UNDERGROUND DRAIN & WATER LINES RECENTLY INSTALLED.
-
2013-06-03soldstatus $60,000
Show marketing remark (288 chars)
DOWNTOWN BUNGALOW NEAR NEW ZAPPO'S. .. CERAMIC 16" TILE IN KITCHEN/BATH. ORIGINAL TURQUOISE TILE IN BATHROOM. EZ CARE YARD. BUYER WILL NEED TO INSTALL CARPET IN BEDROOMS/LIVING ROOM. FRESH PAINT, HOUSE IS CLEAN AND READY. NEW UNDERGROUND DRAIN & WATER LINES RECENTLY INSTALLED.
-
2013-05-23historical Contingent Offer 288-char remark
Show marketing remark (288 chars)
DOWNTOWN BUNGALOW NEAR NEW ZAPPO'S. .. CERAMIC 16" TILE IN KITCHEN/BATH. ORIGINAL TURQUOISE TILE IN BATHROOM. EZ CARE YARD. BUYER WILL NEED TO INSTALL CARPET IN BEDROOMS/LIVING ROOM. FRESH PAINT, HOUSE IS CLEAN AND READY. NEW UNDERGROUND DRAIN & WATER LINES RECENTLY INSTALLED.
-
2013-05-22$53,000 Exclusive Right 288-char remark
Show marketing remark (288 chars)
DOWNTOWN BUNGALOW NEAR NEW ZAPPO'S. .. CERAMIC 16" TILE IN KITCHEN/BATH. ORIGINAL TURQUOISE TILE IN BATHROOM. EZ CARE YARD. BUYER WILL NEED TO INSTALL CARPET IN BEDROOMS/LIVING ROOM. FRESH PAINT, HOUSE IS CLEAN AND READY. NEW UNDERGROUND DRAIN & WATER LINES RECENTLY INSTALLED.
-
1991-07-12soldstatus $15,500
-
1989-11-17soldstatus $15,500
ⓘ Source: listings_history table (triggers on properties + properties_extension) + one-shot
backfill from property_details.listing_events for pre-trigger history.
Tax reassessment forecast NV · Resets to sale price
- Current annual tax
- $636 · $53/mo
- Projected year-2 tax
- $944 · $79/mo
- Expected delta
- +$308/yr (+$26/mo · 48.3%)
ⓘ Screening estimate from a state-policy table — verify with the county assessor before closing.
Climate risk First Street
- Flood 1/10 Low FEMA zone X (unshaded) · 0% chance over 30 yrs
- Wildfire 1/10 Low
- Heat 8/10 Severe 7 d/yr ≥107°F today · 18 d/yr by 30 yrs out
- Wind 1/10 Low
- Air quality 4/10 Moderate 4 unhealthy d/yr today · 5 by 30 yrs out
Nearby sold comps map
Loading sold comps map…
Walkable amenities ~0.75 mi
Loading nearby amenities…
Taxation est. · year 1
- Rental income
- $18,818
- − Mortgage interest
- −$8,962
- − Property taxes
- −$636
- − Insurance
- −$800
- − Repairs & maintenance
- −$1,505
- − Management
- −$1,505
- − Depreciation
- −$4,655
- Taxable income
- $753
- Est. tax owed @ 24.0%
- −$181
- After-tax cash flow
- $3,180/yr
For passive investors: Depreciation is non-cash, so a rental often shows a tax loss while cash-flowing — sheltering income. Rental losses are passive: they offset passive income freely, and up to $25,000/yr can offset ordinary (W-2) income if you actively participate and your MAGI is under $100k (phasing out to $0 by $150k); unused losses carry forward. On sale, claimed depreciation is recaptured at up to 25%, and gains may owe capital-gains tax (a 1031 exchange can defer both). Figures are a year-1 estimate at your 24.0% rate — not tax advice; consult a CPA.
Schools (NCES district)
- District
- Clark County School District
- NCES district ID
- 3200060
- Math proficiency
- 21% ▼ -13.00%
- Reading proficiency
- 39% ▼ -8.00%
- Median HH income
- $53,611
- Composite
- 26.48/100
- National rank
- #7211
- State rank
- #11 of 17 in NV
Livability — Las Vegas
- Score
- 80/100
- State rank
- #2
- US rank
- #1723
Category grades
Schools grade is shown separately in the Schools card above.
Census & demographics
- Census place
- Las Vegas, NV
- County
- Clark County · 2,306,105 people
- City population
- 1,643,591
- Metro
- Las Vegas-Henderson-Paradise, NV
- Population (ZIP)
- 42,739
- Household income
- $39,459
- Rent vs Own
- Severe rent burden
- 3814.0
Population outlook (Clark County) Hauer SSP2
- Today (2025)
- 2,504,101 people
- By 2030
- 2,693,770 · +7.6%
- By 2040
- 3,061,208 · +22.2%
- By 2050
- 3,400,072 · +35.8%
- By 2075
- 4,139,522 · +65.3%
- By 2100
- 4,596,916 · +83.6%
Race, ethnicity, and origin ACS 2023
- Neighborhood character
- Diverse neighborhood (Simpson 0.61)
- Race & ethnicity
- Hispanic / Latino 57% Two or more races 19% White 19% Black 14% Asian 5% Native American 3%
- Hispanic origin (detail)
- Mexican 45% Puerto Rican 1% Cuban 1%
- Common ancestry
- Lithuanian 1% Slovak 1% Italian 1%
- Foreign-born
- 31% · Canada, China
- Languages at home
- 47% English-only · Spanish 48% Tagalog/Filipino 2% Chinese 1%
Political lean MEDSL · Clark
- 2024 margin
- Toss-up / Even · D 50.4% · R 47.8% · Other 1.7%
- 2008→2024 swing
- -16.5pp toward R · 2008: 19.1pp · 2024: 2.6pp
- All cycles
- 2024: D+2.6 2020: D+9.3 2016: D+10.7 2012: D+14.5 2008: D+19.1
Not yet ingested
- Civics
- —
Market trends
- HPI YoY
- ▼ -90.49%
- Current HPI
- 305.6227
- Rent YoY
- ▲ 2.51%
- Metro
- Las Vegas-Henderson-Paradise, NV
- State GDP YoY
- ▲ 3.08%
- F500 in state
- 6
Industry mix (Fortune 500 HQ in NV)
| Industry | F500 HQs | Revenue |
|---|---|---|
| Hotels / Casinos | 3 | $36B |
|
||
Price history
+1738.7% since first listed8 events — show timeline
- 2026-05-14 Listed $285,000 GLVAR
- 2013-06-04 Listing Removed — GLVAR
- 2013-06-03 Sold (Public Records) $60,000 Public Records
- 2013-06-03 Sold (MLS) $60,000 GLVAR
- 2013-05-23 Contingent — GLVAR
- 2013-05-22 Listed $53,000 GLVAR
- 1991-07-12 Sold (Public Records) $15,500 Public Records
- 1989-11-17 Sold (Public Records) $15,500 Public Records
Property tax history
+0.9%/yrLatest (2025): $636 · +7.5% YoY. Source: county tax records.
Cash-flow waterfall
monthlySold comps — $/sqft
last 12 mo · ≤1 miLoading sold comps…