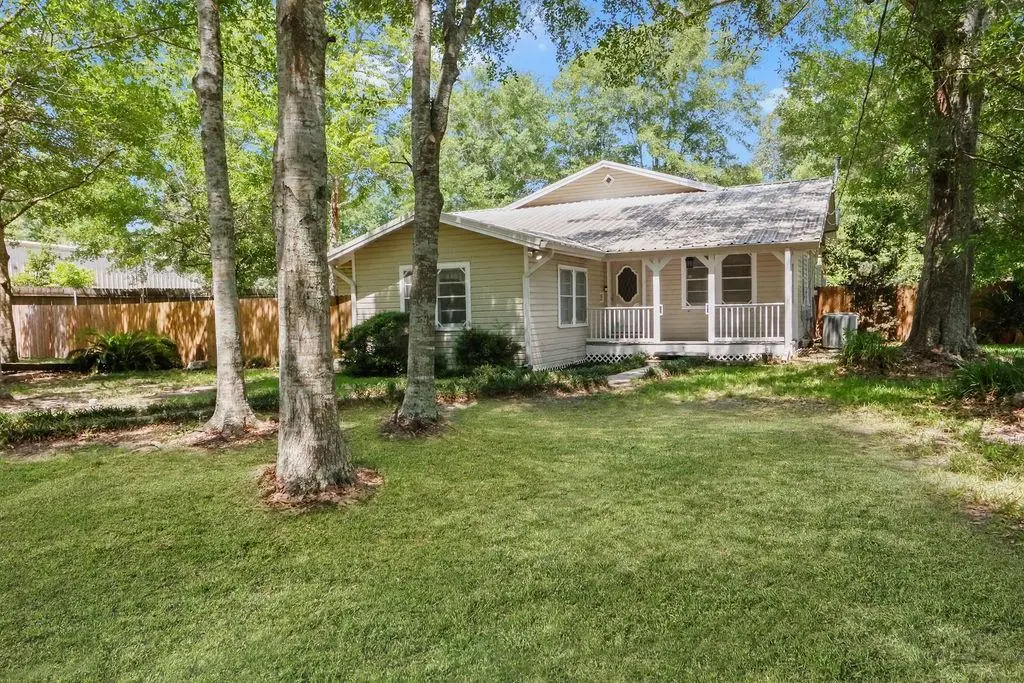
1220 S Hwy. 59 (girod) Hwy · Mandeville, LA
Flood risk 1/10 · Minimal
- FEMA flood zone
- X
- Chance of flooding over 30 yrs
- 0.0%
- Est. flood insurance / yr
- $507 – $1,088
Fire risk 2/10 · Minimal
- Est. fire insurance / yr
- $1,269 – $2,357
Heat risk 10/10 · Severe
- Hot days now (above 108°F)
- 7 days/yr
- Hot days in 30 yrs
- 21 days/yr
Wind risk 9/10 · Severe
- Chance of severe wind over 30 yrs
- 99.0%
Air-quality risk 2/10 · Minimal
- Unhealthy air days now
- 1 days/yr
- Unhealthy air days in 30 yrs
- 2 days/yr
Risk factors via First Street. Map © Google.
Why this score? — see what drove the C grade
The composite is a weighted blend of 9 inputs, each scored 0–100. Each bar is that input's sub-score; the figure is the points it added to the 100-point composite (weight × sub-score).
- Cash flow +19.4/30.0
- ARV discount +15.0/15.0
- DSCR +6.1/10.0
- 1% rule +4.4/10.0
- Schools +4.3/10.0
- Livability +3.9/5.0
- Rent growth +2.8/5.0
- Condition / age +2.5/5.0
- Appreciation +0.0/10.0
$299,900
🖨 Deal sheet 📄 Offer letter ✓ Due diligence
Listing remarks MLS
Zoned Neighborhood Commercial (Limited Use per St. Tammany use) or Residential, Priced To Sell, was adjusted and considered due to needed repairs and updating. Motivated Sellers, Easy to show, Make Appointment! Large lot size 102 x 175.
Key facts
- Large lot size
- Parking
- Built 1950
Tags
Neighborhood map
What this means for you Summary
Snapshot
- This is a 4-bed/3.5-bath single-family listed at $300k.
Deal economics
- At list price, monthly cash flow is $336 ($4k/yr) — positive.
- The deal already cash-flows at list — no discount required.
- To meet the 1% rule (rent ≥ 1% of price), the offer needs to be $281k (6.3% below list).
- Recommended offer: $264k (12.0% below list) — sets the bar for market timing.
- Cap rate 7.6% vs local median 3.5% in Mandeville — top-decile yield for the area; either an underpriced asset or a hidden risk that comps aren't pricing in. Stress-test before assuming the spread holds.
Location & tenants
- Location reads 77/100 on livability (#13 in LA, #3,224 nationally) — a middle-class / working-renter tenant base. Strengths: schools A+, employment A+, housing A+; Watch: amenities F, commute F.
- St. Tammany Parish (suburban): math 43% / reading 55% proficiency, ranked #11 of 98 in LA (top 11%) — families likely to look elsewhere, expect single-tenant / working-renter base with shorter leases.
- Market conditions: Rents rising (+1.1%/yr); 260 active listings in the ZIP; 8 comparable units currently listed for rent nearby; rentals at typical pace (median 24d on market — plan ~3-4 weeks tenant-placement turnaround); solid renter incomes; 1,064 units permitted in St. Tammany Parish in 2024 (0 in 5+ unit buildings).
- This rent runs 35% of the median local income ($96k/yr) — at the standard rent-burdened threshold; future hikes will face affordability resistance.
Forward outlook
- Local home prices are declining (-3.0%/yr); year-one equity from $2k of loan paydown is wiped out by about $9k of value loss. Plan a longer hold.
- St. Tammany County population projected at +27% by 2050 — long-run rental-demand tailwind backs the buy-and-hold thesis.
Negotiation context
- It's been on market 370 days — a 12% lower offer ($264k) is reasonable based on typical stale-listing flexibility.
- 5 sale attempts since 2y ago with the ask held roughly flat each time — persistent listings suggest the price (not the market) is what's stuck; bring a comps-based counter.
Risks & watch-outs
- Watch-outs: built in 1950 — expect roof / HVAC / electrical / plumbing capex.
- Climate carrying-cost: severe wind risk, 99% chance of damaging wind over 30y; extreme-heat days projected 7→21/yr by 2055 (HVAC capex compounding) — expect insurance premiums to compound above CPI over the hold.
Questions for the listing agent
- It's been on market 370 days. Have you received any prior offers? Is the seller open to a 12% concession, seller financing, or rate buy-down credit?
- Built in 1950 — when were the roof, HVAC, electrical panel, plumbing, and water heater last replaced?
- Why hasn't it sold? Are there any deal-killer items the seller is aware of (foundation, flood, title, zoning, code violations)?
- Is there a deadline driving the sale (1031 exchange, divorce, estate, relocation)? That informs how much negotiation room exists.
- Schools are A-rated — typically a magnet for longer-tenancy family renters. What's the average tenant stay here, and is there a school-zone premium baked into asking?
- What's the average days-on-market for RENTAL listings here right now (not sales)? A rising rental-DOM trend means longer vacancies and softer asking-rent achievability than the comps imply.
- What's the recent tenant-quality profile in this submarket — average credit score on applications, eviction rate, late-payment / NSF rate, and stable-employment percentage? A property-management company in the area should have these aggregated.
- How much new for-sale + rental construction is in the pipeline within 1–3 miles? Heavy new supply typically softens prices + rents 12–24 months out; constrained supply supports both.
Investment metrics
- 1% rule
- 0.94% ✗
- Cap rate
- 7.64%
- Cash-on-cash
- 4.81%
- DSCR
- 1.21
- GRM
- 8.9
CMA / ARV
- ARV (median comp)
- $549,854
- List price
- $299,900
- Delta
- -45.46%
- Verdict
- UNDERPRICED
- Comps
- 20 within 1.0 mi
Show comp detail 10 sales within ~0.75 mi
| Address | Dist | Beds/Ba | Sqft | Sold | Price | $/sf | Match |
|---|---|---|---|---|---|---|---|
| 1246 Carroll St | 0.21mi | 4/3.0 | 2,605 (+5%) | 6mo | $455,900 | $175 | 75 |
| 1533 Marigny Ave | 0.34mi | 4/3.0 | 2,387 (-4%) | 8mo | $440,000 | $184 | 69 |
| 1923 Destin St | 0.27mi | 3/2.5 (-1) | 2,191 (-12%) | 1mo | $424,000 | $194 | 58 |
| 1837 Livingston St | 0.72mi | 4/3.0 | 2,548 (+2%) | 12mo | $839,000 | $329 | 50 |
| 849 Penn St | 0.45mi | 3/3.5 (-1) | 2,700 (+9%) | 13mo | $559,000 | $207 | 49 |
| 109 Castine Oaks Dr | 0.74mi | 4/2.5 | 2,569 (+3%) | 10mo | $425,000 | $165 | 47 |
| 4057 Azalea Ct | 0.70mi | 4/2.5 | 2,700 (+9%) | 15mo | $490,000 | $181 | 37 |
| 1442 Carroll St | 0.31mi | 4/2.0 | 2,136 (-14%) | 24mo | $399,000 | $187 | 36 |
| 241 E Richland Dr | 0.69mi | 4/2.0 | 2,176 (-12%) | 16mo | $399,000 | $183 | 28 |
| 1611 Jackson St | 0.72mi | 4/2.0 | 2,197 (-12%) | 20mo | $415,000 | $189 | 24 |
Match score weights: distance 35% · size 25% · config 20% · recency 20%. Top-matched comps best support the ARV.
Projected returns pro-forma
-3.0% appreciation · 1.06% rent growth · sell at horizon
- IRR
- -10.9%
- Equity multiple
- 0.61×
- Total profit
- $-32,630
- Equity at exit
- $44,716
- IRR
- -4.4%
- Equity multiple
- 0.73×
- Total profit
- $-22,364
- Equity at exit
- $25,930
Cash invested: $83,972 (down + closing). Projections, not guarantees.
Landlord ↔ Tenant lean methodology
- Overall (STATE)
- 90 Strongly Landlord-Friendly
- State Louisiana
- 90 Strongly Landlord-Friendly · R+12
- County
- — inherits STATE
- City
- — inherits STATE
ZIP-level market 70448
- Rents YoY
- 1.1%
- Active inventory
- 260
- Price-to-rent
- 8.9×
Monthly cashflow live
- Estimated rent
- $2,809 high interval (Pro) →
- Mortgage (P&I)
- −$1,573
- Tax from tax record
- −$185 /mo · $2,225/yr
- Insurance
- −$125
- HOA
- −$0
- Vacancy / Maint / Mgmt
- −$590
- Net cashflow
- $336
Break-even live
UW: 25.0% down · 7.5% · 30yr · 1.5% tax · 5.0% vac · 8.0% maint · 8.0% mgmt
Financing live
Cash to close
- Down payment
- $74,975
- Closing costs
- $8,997
- Reserves months
- —
- Total cash needed
- —
Loan-product check · same deal, 3 products live
Conventional
25% down · 7.5% · 30yr
- Down + closing
- —
- Monthly P&I
- —
- Monthly cashflow
- —
- DSCR
- —
- Eligible?
- —
Personal DTI + credit; lowest rate.
DSCR
20% down · 8.5% · 30yr
- Down + closing
- —
- Monthly P&I
- —
- Monthly cashflow
- —
- DSCR
- —
- Eligible?
- —
No personal income docs; deal must DSCR.
Hard money
10% down · 12.0% · 12mo
- Down + closing
- —
- Monthly P&I
- —
- Monthly cashflow
- —
- DSCR
- —
- Eligible?
- —
Short-term bridge; refi at stabilization.
Rent comps 8 comps
| Address | Beds | Baths | Sqft | Rent | $/sqft | DOM | Units | Dist |
|---|---|---|---|---|---|---|---|---|
| 2225 Labarre St Mandeville, LA | 4.0 | 2.5 | 2100 | $4,200 | $2.00 | 3d | 1 | 0.40mi |
| 127 Oakwood Dr Mandeville, LA | 4.0 | 2.0 | 2000 | $2,000 | $1.00 | 43d | 1 | 0.76mi |
| 129 Mead Ct Mandeville, LA | 3.0 | 2.0 | 1580 | $1,850 | $1.17 | 3d | 1 | 0.83mi |
| 426 Lafitte St Mandeville, LA | 3.0 | 2.5 | 1660 | $2,700 | $1.63 | 3d | 1 | 0.87mi |
| 68 Trace Loop Mandeville, LA | 3.0 | 2.0 | 1747 | $2,000 | $1.14 | 23d | 1 | 0.90mi |
| 9 Trace Loop Mandeville, LA | 3.0 | 2.0 | 1660 | $2,300 | $1.39 | 23d | 1 | 1.02mi |
| 125 Leah Dr Mandeville, LA | 4.0 | 3.0 | 2106 | $2,900 | $1.38 | 3d | 1 | 1.14mi |
| 611 Magnolia Ridge Dr E Mandeville, LA | 4.0 | 2.0 | 2120 | $2,850 | $1.34 | 43d | 1 | 1.20mi |
Listing history 22 events
-
2026-06-18days on market $299,900 Active 370 DOM
-
2026-06-17days on market $299,900 Active 369 DOM
-
2026-06-16days on market $299,900 Active 368 DOM
-
2026-06-15days on market $299,900 Active 367 DOM
-
2026-06-13days on market $299,900 Active 365 DOM
-
2026-06-10days on market $299,900 Active 362 DOM
-
2026-06-09days on market $299,900 Active 361 DOM
-
2026-06-08days on market $299,900 Active 360 DOM
-
2026-06-07days on market $299,900 Active 359 DOM
-
2026-06-03days on market $299,900 Active 355 DOM
-
2026-06-02days on market $299,900 Active 354 DOM
-
2026-06-01days on market $299,900 Active 353 DOM
-
2026-05-31days on market $299,900 Active 352 DOM
-
2026-01-14price $299,900 236-char remark
Show marketing remark (236 chars)
Zoned Neighborhood Commercial (Limited Use per St. Tammany use) or Residential, Priced To Sell, was adjusted and considered due to needed repairs and updating. Motivated Sellers, Easy to show, Make Appointment! Large lot size 102 x 175.
-
2026-01-12status Active 236-char remark
Show marketing remark (236 chars)
Zoned Neighborhood Commercial (Limited Use per St. Tammany use) or Residential, Priced To Sell, was adjusted and considered due to needed repairs and updating. Motivated Sellers, Easy to show, Make Appointment! Large lot size 102 x 175.
-
2025-12-27historical 236-char remark
Show marketing remark (236 chars)
Zoned Neighborhood Commercial (Limited Use per St. Tammany use) or Residential, Priced To Sell, was adjusted and considered due to needed repairs and updating. Motivated Sellers, Easy to show, Make Appointment! Large lot size 102 x 175.
-
2025-07-14status Active 236-char remark
Show marketing remark (236 chars)
Zoned Neighborhood Commercial (Limited Use per St. Tammany use) or Residential, Priced To Sell, was adjusted and considered due to needed repairs and updating. Motivated Sellers, Easy to show, Make Appointment! Large lot size 102 x 175.
-
2025-06-16historical Active Under Contract 236-char remark
Show marketing remark (236 chars)
Zoned Neighborhood Commercial (Limited Use per St. Tammany use) or Residential, Priced To Sell, was adjusted and considered due to needed repairs and updating. Motivated Sellers, Easy to show, Make Appointment! Large lot size 102 x 175.
-
2025-05-27$310,000 Active 236-char remark
Show marketing remark (236 chars)
Zoned Neighborhood Commercial (Limited Use per St. Tammany use) or Residential, Priced To Sell, was adjusted and considered due to needed repairs and updating. Motivated Sellers, Easy to show, Make Appointment! Large lot size 102 x 175.
-
2024-12-30$290,000 Active
ⓘ Source: listings_history table (triggers on properties + properties_extension) + one-shot
backfill from property_details.listing_events for pre-trigger history.
Tax reassessment forecast LA · Resets to sale price
- Current annual tax
- $2,225 · $185/mo
- Projected year-2 tax
- $2,225 · $185/mo
- Expected delta
- $0/yr ($0/mo · 0.0%)
ⓘ Screening estimate from a state-policy table — verify with the county assessor before closing.
Climate risk First Street
- Flood 1/10 Low FEMA zone X · 0% chance over 30 yrs
- Wildfire 2/10 Low
- Heat 10/10 Extreme 7 d/yr ≥108°F today · 21 d/yr by 30 yrs out
- Wind 9/10 Extreme 99% chance of damaging wind over 30 yrs
- Air quality 2/10 Low 1 unhealthy d/yr today · 2 by 30 yrs out
Nearby sold comps map
Loading sold comps map…
Walkable amenities ~0.75 mi
Loading nearby amenities…
Taxation est. · year 1
- Rental income
- $33,712
- − Mortgage interest
- −$16,799
- − Property taxes
- −$2,225
- − Insurance
- −$1,500
- − Repairs & maintenance
- −$2,697
- − Management
- −$2,697
- − Depreciation
- −$8,724
- Taxable loss
- −$929
- Est. tax savings @ 24.0%
- +$223
- After-tax cash flow
- $4,259/yr
For passive investors: Depreciation is non-cash, so a rental often shows a tax loss while cash-flowing — sheltering income. Rental losses are passive: they offset passive income freely, and up to $25,000/yr can offset ordinary (W-2) income if you actively participate and your MAGI is under $100k (phasing out to $0 by $150k); unused losses carry forward. On sale, claimed depreciation is recaptured at up to 25%, and gains may owe capital-gains tax (a 1031 exchange can defer both). Figures are a year-1 estimate at your 24.0% rate — not tax advice; consult a CPA.
Schools (NCES district)
- District
- St. Tammany Parish
- NCES district ID
- 2201650
- Math proficiency
- 43% ▼ -32.00%
- Reading proficiency
- 55% ▼ -26.00%
- Median HH income
- $61,752
- Composite
- 43.04/100
- National rank
- #3098
- State rank
- #11 of 98 in LA
Livability — Mandeville
- Score
- 77/100
- State rank
- #13
- US rank
- #3224
Category grades
Schools grade is shown separately in the Schools card above.
Census & demographics
- County
- Saint Tammany Parish · 228,296 people
- City population
- 50,537
- Metro
- New Orleans-Metairie, LA
- Population (ZIP)
- 26,338
- Household income
- $95,682
- Rent vs Own
- Severe rent burden
- 320.0
Population outlook (St. Tammany County) Hauer SSP2
- Today (2025)
- 286,725 people
- By 2030
- 304,175 · +6.1%
- By 2040
- 336,203 · +17.3%
- By 2050
- 364,590 · +27.2%
- By 2075
- 433,362 · +51.1%
- By 2100
- 470,333 · +64.0%
Race, ethnicity, and origin ACS 2023
- Neighborhood character
- Predominantly White (82%)
- Race & ethnicity
- White 82% Two or more races 10% Hispanic / Latino 9% Black 5% Asian 1%
- Hispanic origin (detail)
- Mexican 3%
- Common ancestry
- Lithuanian 16% Italian 2% Slovak 2%
- Foreign-born
- 5% · Canada, Vietnam, Jamaica
- Languages at home
- 92% English-only · Spanish 4% Russian/Polish/Slavic 1% German/W. Germanic 1%
Political lean MEDSL · St. Tammany
- 2024 margin
- Solid R (+43.8) · D 27.3% · R 71.1% · Other 1.6%
- 2008→2024 swing
- +9.6pp toward D · 2008: -53.4pp · 2024: -43.8pp
- All cycles
- 2024: R+43.8 2020: R+44.2 2016: R+50.8 2012: R+52.2 2008: R+53.4
Not yet ingested
- Civics
- —
Market trends
- HPI YoY
- ▼ -113.97%
- Current HPI
- 179.9084
- Rent YoY
- ▲ 1.06%
- Metro
- New Orleans-Metairie, LA
- State GDP YoY
- ▲ 3.29%
- F500 in state
- 10
Industry mix (Fortune 500 HQ in LA)
| Industry | F500 HQs | Revenue |
|---|---|---|
| Telecommunications | 2 | $23B |
|
||
| Utilities | 1 | $12B |
|
||
| Wholesale / Distribution | 1 | $5B |
|
||
| Advertising | 1 | $2B |
|
||
Price history
+3.4% since first listed9 events — show timeline
- 2026-01-14 Price Changed $299,900 AcadianaMLS
- 2026-01-14 Price Changed $299,900 GSREIN
- 2026-01-12 Relisted — GSREIN
- 2025-12-27 Listing Removed — GSREIN
- 2025-07-14 Relisted — GSREIN
- 2025-06-16 Contingent — GSREIN
- 2025-05-27 Listed $310,000 GSREIN
- 2025-05-27 Listed $310,000 AcadianaMLS
- 2024-12-30 Listed $290,000 AcadianaMLS
Property tax history
+1.4%/yrLatest (2025): $2,225 · -3.6% YoY. Source: county tax records.
Cash-flow waterfall
monthlySold comps — $/sqft
last 12 mo · ≤1 miLoading sold comps…