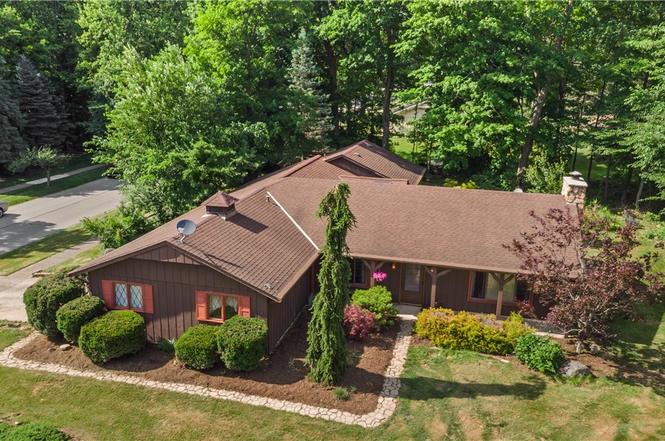
5911 Woodland Dr · North Ridgeville, OH
Flood risk 1/10 · Minimal
- FEMA flood zone
- X (unshaded)
- Chance of flooding over 30 yrs
- 0.0%
- Est. flood insurance / yr
- $473 – $860
Fire risk 1/10 · Minimal
- Est. fire insurance / yr
- $713 – $1,323
Heat risk 2/10 · Minimal
- Hot days now (above 96°F)
- 7 days/yr
- Hot days in 30 yrs
- 16 days/yr
Wind risk 1/10 · Minimal
- Chance of severe wind over 30 yrs
- —
Air-quality risk 2/10 · Minimal
- Unhealthy air days now
- 1 days/yr
- Unhealthy air days in 30 yrs
- 3 days/yr
Risk factors via First Street. Map © Google.
Why this score? — see what drove the D+ grade
The composite is a weighted blend of 9 inputs, each scored 0–100. Each bar is that input's sub-score; the figure is the points it added to the 100-point composite (weight × sub-score).
- ARV discount +15.0/15.0
- Cash flow +11.2/30.0
- Schools +4.8/10.0
- 1% rule +3.7/10.0
- Livability +3.7/5.0
- DSCR +3.3/10.0
- Rent growth +2.5/5.0
- Condition / age +2.5/5.0
- Appreciation +0.0/10.0
$279,900
🖨 Deal sheet (PDF) 📄 Offer letter ✓ Due diligence
Listing remarks MLS
House is move in ready. Neutral dcor, newer carpet (July 2013) throughout. House features fieldstone fireplace in large great room. Family room in teen/in-law suite. Enjoy quiet evenings in the sun room overlooking pond in park-like backyard. Lots of updates, see print out left at house. Very desirable floor plan with updated eat-in kitchen and nook area. Common areas, 2 pools, playground with tennis courts, basketball diamond, walking path and clubhouse. Easy to show. Call today!
Key facts
- Community amenities
- Walking paths
- Corner lot
Tags
Property features AI
Finance
- HOA & community: Part of Mill Creek homeowners association; Annual association fee of $550; Association covers common area maintenance, pools, and recreation facilities; Community playground and pool access
Exterior
- Parking: Attached garage; Two garage spaces
- Utilities: Public water; Public sewer
- Home design: Single-story home; Slab foundation; Shingle roof; Wood siding construction; Property attached
- Construction: Built (year per public records); Wood siding; Shingle roof; Slab foundation
- Exterior features: Private yard; Front porch; Patio; Outbuilding and storage; Corner lot
Interior
- Kitchen: Dishwasher; Range; Microwave; Refrigerator
- Bedrooms: Four main-level bedrooms
- Bathrooms: Three full bathrooms (all on the main level)
- Heating & cooling: Central air conditioning; Gas/propane heating with fireplace(s)
- Interior features: Fireplace in the den (propane/gas); Has view; Total of 7 rooms
- Laundry & utility: Dedicated laundry room; Dryer
Neighborhood map
What this means for you Summary
Snapshot
- This is a 4-bed/2.5-bath single-family listed at $280k.
Deal economics
- At list price, monthly cash flow is $-107 ($-1k/yr) — negative.
- To cash-flow at today's rent, offer at most $261k (6.7% below list).
- To meet the 1% rule (rent ≥ 1% of price), the offer needs to be $245k (12.6% below list).
- Recommended offer: $245k (12.6% below list) — sets the bar for 1% rule.
- Cap rate 5.8% vs local median 3.3% in North Ridgeville — top-decile yield for the area; either an underpriced asset or a hidden risk that comps aren't pricing in. Stress-test before assuming the spread holds.
Location & tenants
- Location reads 74/100 on livability (#305 in OH, #4,924 nationally) — a middle-class / working-renter tenant base. Strengths: employment A+, cost of living A+, housing A+; Watch: health & safety D, amenities F, commute F.
- North Ridgeville City (suburban): math 49% / reading 61% proficiency, ranked #339 of 656 in OH (top 52%) — acceptable for families but not a draw, mixed tenant base, ~2y average lease; only 20% free/reduced lunch — higher-income household profile.
- Zoned schools: Liberty Elementary School (591 students, 23% FRL); North Ridgeville Academic Center (math 49% / reading 57%, grade C+, #372 of 654 statewide, top 58%, 1,878 students, 22% FRL); North Ridgeville High School (math 39% / reading 72%, grade C, #296 of 781 statewide, top 39%, 1,268 students, 20% FRL) — zoned schools at 22% FRL track the district average.
- Market conditions: 202 active listings in the ZIP; 1 comparable units currently listed for rent nearby; solid renter incomes; 1,098 units permitted in Lorain County in 2024 (20 in 5+ unit buildings).
- This rent runs 30% of the median local income ($96k/yr) — at the standard rent-burdened threshold; future hikes will face affordability resistance.
Forward outlook
- Local home prices are declining (-3.0%/yr); year-one equity from $2k of loan paydown is wiped out by about $8k of value loss. Plan a longer hold.
Negotiation context
- Only 3 days on market — expect competitive offers; lowballing is unlikely to land.
- 3 sale attempts since 27y ago with the ask held roughly flat each time — persistent listings suggest the price (not the market) is what's stuck; bring a comps-based counter.
- Current owner paid $178k; list at $280k implies a 57% gain — meaningful room to come down on a strong offer.
Questions for the listing agent
- What do current leases actually rent for vs. the listed asking? Can we see a recent rent roll and the last 12 months of T-12 income?
- Built in 1974 — when were the roof, HVAC, electrical panel, plumbing, and water heater last replaced?
- What does the HOA fee cover, when was the last increase, and are there any pending special assessments or reserve-fund shortfalls?
- Is there a deadline driving the sale (1031 exchange, divorce, estate, relocation)? That informs how much negotiation room exists.
- Schools are A-rated — typically a magnet for longer-tenancy family renters. What's the average tenant stay here, and is there a school-zone premium baked into asking?
- The area grade is low — what's the realistic commute time and amenity access for the typical tenant pool here? Any planned neighborhood developments (good or bad) we should know about?
- What's the average days-on-market for RENTAL listings here right now (not sales)? A rising rental-DOM trend means longer vacancies and softer asking-rent achievability than the comps imply.
- What's the recent tenant-quality profile in this submarket — average credit score on applications, eviction rate, late-payment / NSF rate, and stable-employment percentage? A property-management company in the area should have these aggregated.
- How much new for-sale + rental construction is in the pipeline within 1–3 miles? Heavy new supply typically softens prices + rents 12–24 months out; constrained supply supports both.
Investment metrics
- 1% rule
- 0.87% ✗
- Cap rate
- 5.83%
- Cash-on-cash
- -1.64%
- DSCR
- 0.93
- GRM
- 9.5
CMA / ARV
- ARV (on-the-fly)
- $407,322
- Comps found
- 12
Show comp detail 12 sales within ~0.75 mi
| Address | Dist | Beds/Ba | Sqft | Sold | Price | $/sf | Match |
|---|---|---|---|---|---|---|---|
| 5721 Hickory Trl | 0.17mi | 4/2.5 | 2,414 (+1%) | 7mo | $335,000 | $139 | 84 |
| 5828 Tree Moss Ln | 0.36mi | 4/2.5 | 2,284 (-4%) | 7mo | $390,000 | $171 | 70 |
| 5476 Jacqueline Ln | 0.35mi | 4/2.5 | 2,137 (-10%) | 1mo | $470,000 | $220 | 66 |
| 5757 Hickory Trl | 0.14mi | 3/2.0 (-1) | 2,046 (-14%) | 2mo | $350,000 | $171 | 61 |
| 5790 Bayberry Cir | 0.11mi | 4/2.5 | 2,056 (-14%) | 20mo | $310,000 | $151 | 56 |
| 5550 Barton Rd | 0.29mi | 4/2.0 | 2,076 (-13%) | 11mo | $316,000 | $152 | 54 |
| 5964 Hickory Trl | 0.08mi | 3/2.0 (-1) | 2,106 (-12%) | 20mo | $381,000 | $181 | 53 |
| 6065 Brook Cir | 0.54mi | 4/2.5 | 2,044 (-14%) | 3mo | $315,000 | $154 | 48 |
| 32028 Chestnut Ridge Rd | 0.62mi | 3/2.5 (-1) | 2,311 (-3%) | 16mo | $733,174 | $317 | 48 |
| 32567 Oakhurst Dr | 0.74mi | 3/2.5 (-1) | 2,262 (-5%) | 8mo | $365,000 | $161 | 46 |
| 30875 Windy Hollow Ln | 0.66mi | 4/2.5 | 2,032 (-15%) | 15mo | $395,000 | $194 | 32 |
| 30824 Windy Hollow Ln | 0.65mi | 4/2.5 | 2,032 (-15%) | 17mo | $325,000 | $160 | 31 |
Match score weights: distance 35% · size 25% · config 20% · recency 20%. Top-matched comps best support the ARV.
Projected returns pro-forma
-3.0% appreciation · 3.0% rent growth · sell at horizon
- IRR
- -19.0%
- Equity multiple
- 0.34×
- Total profit
- $-52,060
- Equity at exit
- $41,734
- IRR
- -11.4%
- Equity multiple
- 0.32×
- Total profit
- $-53,684
- Equity at exit
- $24,201
Cash invested: $78,372 (down + closing). Projections, not guarantees.
Landlord ↔ Tenant lean methodology
- Overall (STATE)
- 73 Landlord-Friendly
- State Ohio
- 73 Landlord-Friendly · R+6
- County
- — inherits STATE
- City
- — inherits STATE
ZIP-level market 44039
- Active inventory
- 202
- Price-to-rent
- 9.5×
Monthly cashflow live
- Estimated rent
- $2,446 medium interval (Pro) →
- Mortgage (P&I)
- −$1,468
- Tax from tax record
- −$409 /mo · $4,909/yr
- Insurance
- −$117
- HOA
- −$46
- Vacancy / Maint / Mgmt
- −$514
- Net cashflow
- $-107
Break-even live
Sensitivity live
| Price | -10% $52 | -5% $-28 | +0% $-107 | +5% $-186 | +10% $-265 |
|---|---|---|---|---|---|
| Rent | -10% $-300 | -5% $-203 | +0% $-107 | +5% $-10 | +10% $86 |
| Rate | -1.0pp $34 | -0.5pp $-36 | base $-107 | +0.5pp $-179 | +1.0pp $-253 |
UW: 25.0% down · 7.5% · 30yr · 1.5% tax · 5.0% vac · 8.0% maint · 8.0% mgmt
Financing live
Cash to close
- Down payment
- $69,975
- Closing costs
- $8,397
- Reserves months
- —
- Total cash needed
- —
Loan-product check · same deal, 3 products live
Conventional
25% down · 7.5% · 30yr
- Down + closing
- —
- Monthly P&I
- —
- Monthly cashflow
- —
- DSCR
- —
- Eligible?
- —
Personal DTI + credit; lowest rate.
DSCR
20% down · 8.5% · 30yr
- Down + closing
- —
- Monthly P&I
- —
- Monthly cashflow
- —
- DSCR
- —
- Eligible?
- —
No personal income docs; deal must DSCR.
Hard money
10% down · 12.0% · 12mo
- Down + closing
- —
- Monthly P&I
- —
- Monthly cashflow
- —
- DSCR
- —
- Eligible?
- —
Short-term bridge; refi at stabilization.
Rent comps 1 comps
| Address | Beds | Baths | Sqft | Rent | $/sqft | DOM | Units | Dist |
|---|---|---|---|---|---|---|---|---|
| 30871 Lorain Rd North Olmsted, OH | 4.0 | 2.0 | 1999 | $2,750 | $1.38 | 18d | 1 | 0.89mi |
HOA detail
- Monthly dues
- $46 · $552/yr
- Likely covers
- pool
Listing history 3 events
-
2026-06-21days on market $279,900 Active 3 DOM
-
2026-06-18remarks 699-char remark
-
2026-06-18$279,900 Active 1 DOM
ⓘ Source: listings_history table (triggers on properties + properties_extension) + one-shot
backfill from property_details.listing_events for pre-trigger history.
Tax reassessment forecast OH · Partial reset (capped growth)
- Current annual tax
- $4,909 · $409/mo
- Projected year-2 tax
- $4,909 · $409/mo
- Expected delta
- $0/yr ($0/mo · 0.0%)
ⓘ Screening estimate from a state-policy table — verify with the county assessor before closing.
Climate risk First Street
- Flood 1/10 Low FEMA zone X (unshaded) · 0% chance over 30 yrs
- Wildfire 1/10 Low
- Heat 2/10 Low 7 d/yr ≥96°F today · 16 d/yr by 30 yrs out
- Wind 1/10 Low
- Air quality 2/10 Low 1 unhealthy d/yr today · 3 by 30 yrs out
Nearby sold comps map
Loading sold comps map…
Walkable amenities ~0.75 mi
Loading nearby amenities…
Taxation est. · year 1
- Rental income
- $29,357
- − Mortgage interest
- −$15,679
- − Property taxes
- −$4,909
- − Insurance
- −$1,400
- − Repairs & maintenance
- −$2,349
- − Management
- −$2,349
- − HOA
- −$552
- − Depreciation
- −$8,143
- Taxable loss
- −$6,022
- Est. tax savings @ 24.0%
- +$1,445
- After-tax cash flow
- $163/yr
For passive investors: Depreciation is non-cash, so a rental often shows a tax loss while cash-flowing — sheltering income. Rental losses are passive: they offset passive income freely, and up to $25,000/yr can offset ordinary (W-2) income if you actively participate and your MAGI is under $100k (phasing out to $0 by $150k); unused losses carry forward. On sale, claimed depreciation is recaptured at up to 25%, and gains may owe capital-gains tax (a 1031 exchange can defer both). Figures are a year-1 estimate at your 24.0% rate — not tax advice; consult a CPA.
Schools (NCES district)
- District
- North Ridgeville City
- NCES district ID
- 3904453
- Math proficiency
- 49% ▼ -21.00%
- Reading proficiency
- 61% ▼ -11.00%
- Median HH income
- $66,437
- Composite
- 48.46/100
- National rank
- #2130
- State rank
- #339 of 656 in OH
Livability — North Ridgeville
- Score
- 74/100
- State rank
- #305
- US rank
- #4924
Category grades
Schools grade is shown separately in the Schools card above.
Census & demographics
- Census place
- North Ridgeville, OH
- County
- Lorain County · 219,437 people
- City population
- 36,780
- Metro
- Cleveland-Elyria, OH
- Population (ZIP)
- 36,780
- Household income
- $96,485
- Rent vs Own
- Severe rent burden
- 207.0
Population outlook (Lorain County) Hauer SSP2
- Today (2025)
- 314,924 people
- By 2030
- 317,546 · +0.8%
- By 2040
- 317,962 · +1.0%
- By 2050
- 312,872 · -0.7%
- By 2075
- 301,806 · -4.2%
- By 2100
- 278,271 · -11.6%
Race, ethnicity, and origin ACS 2023
- Neighborhood character
- Predominantly White (87%)
- Race & ethnicity
- White 87% Hispanic / Latino 7% Two or more races 6% Black 2% Asian 1%
- Hispanic origin (detail)
- Mexican 2% Puerto Rican 3%
- Common ancestry
- Romanian 9% Slovak 3% Lithuanian 3%
- Foreign-born
- 5% · Canada
- Languages at home
- 94% English-only · Spanish 4% Other Indo-European 1%
Political lean MEDSL · Lorain
- 2024 margin
- Lean R (+5.7) · D 46.7% · R 52.4%
- 2008→2024 swing
- -23.6pp toward R · 2008: 17.9pp · 2024: -5.7pp
- All cycles
- 2024: R+5.7 2020: R+2.5 2016: R+0.3 2012: D+14.4 2008: D+17.9
Not yet ingested
- Civics
- —
Market trends
- HPI YoY
- ▼ -160.14%
- Current HPI
- 210.6074
- Rent YoY
- —
- Metro
- Cleveland-Elyria, OH
- State GDP YoY
- ▲ 1.98%
- F500 in state
- 48
Industry mix (Fortune 500 HQ in OH)
| Industry | F500 HQs | Revenue |
|---|---|---|
| Insurance | 3 | $145B |
|
||
| Industrial Machinery | 3 | $49B |
|
||
| Financial Services | 3 | $24B |
|
||
| Consumer Goods | 2 | $93B |
|
||
| Aerospace / Defense | 2 | $47B |
|
||
| Utilities | 2 | $33B |
|
||
Price history
+47.4% since first listed7 events — show timeline
- 2026-06-18 Listed $279,900 MLSNOW
- 2014-06-18 Sold (Public Records) $178,000 Public Records
- 2014-06-18 Sold (MLS) $178,000 MLSNOW
- 2014-05-07 Listing Removed — MLSNOW
- 2013-07-17 Listed $184,900 MLSNOW
- 2000-04-05 Sold (MLS) $176,900 MLSNOW
- 1999-08-09 Listed $189,900 MLSNOW
Property tax history
+4.7%/yrLatest (2025): $4,909 · -4.3% YoY. Source: county tax records.
Cash-flow waterfall
monthlySold comps — $/sqft
last 12 mo · ≤1 miLoading sold comps…