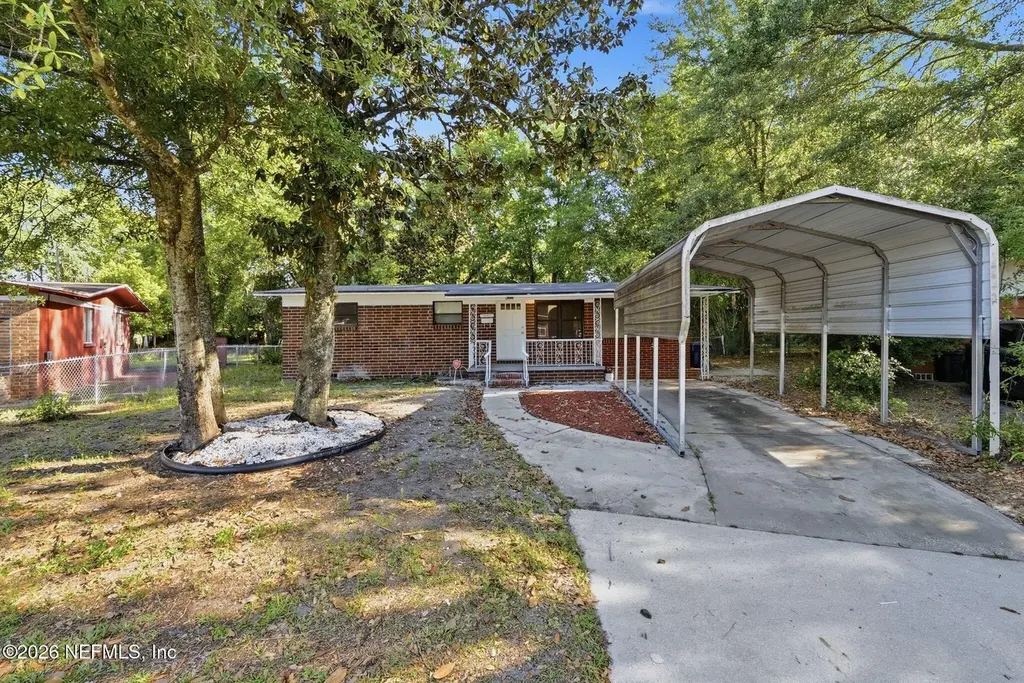
4207 Francis Rd · Jacksonville, FL
Flood risk 8/10 · Major
- FEMA flood zone
- X (unshaded)
- Chance of flooding over 30 yrs
- 0.99%
- Est. flood insurance / yr
- $507 – $1,088
Fire risk 2/10 · Minimal
- Est. fire insurance / yr
- $947 – $1,759
Heat risk 9/10 · Severe
- Hot days now (above 107°F)
- 7 days/yr
- Hot days in 30 yrs
- 20 days/yr
Wind risk 9/10 · Severe
- Chance of severe wind over 30 yrs
- 99.0%
Air-quality risk 4/10 · Minor
- Unhealthy air days now
- 6 days/yr
- Unhealthy air days in 30 yrs
- 6 days/yr
Risk factors via First Street. Map © Google.
Why this score? — see what drove the D- grade
The composite is a weighted blend of 9 inputs, each scored 0–100. Each bar is that input's sub-score; the figure is the points it added to the 100-point composite (weight × sub-score).
- Cash flow +14.8/30.0
- DSCR +4.5/10.0
- Livability +4.2/5.0
- 1% rule +4.0/10.0
- Schools +3.9/10.0
- Rent growth +3.0/5.0
- Condition / age +2.5/5.0
- ARV discount +0.2/15.0
- Appreciation +0.0/10.0
$148,000
🖨 Deal sheet (PDF) 📄 Offer letter ✓ Due diligence
Listing remarks MLS
BRICK OFF-GRADE; POSSIBLE 3RD BEDROOM; POSSIBLE HOOK-UP (AT BUYER'S COST) TO CITY WATER/SEWER. SELLING AS-IS; SPECIAL ADDENDUM REQ'D W/ ALL OFFERS; FULL CONTRACTS ONLY--NO VERBALS OR LOI'S; NO REPAIRS; NO FHA/VA; NO SURVEY CALL L.A. FOR FAX COPY OF ADDENDUM; CALL L.A. OR L.O. FOR LOCK-BOX COMBO TO SHOW!!
Key facts
- Parking
- Built 1965
- Listed 49 days
Property features AI
Finance
- HOA & community: Not a senior community
Exterior
- Parking: Carport (1 space)
- Utilities: Electricity available; Sewer available
- Home design: Single Family Residence; One level
- Exterior features: No private pool; Single-family use
Interior
- Kitchen: Electric oven; Refrigerator; Electric water heater
- Bedrooms: 2 bedrooms on the main level
- Bathrooms: 1 full bathroom
- Heating & cooling: Central heating; Central air conditioning
- Interior features: Five total rooms; Unfurnished
Neighborhood map
What this means for you Summary
Snapshot
- This is a 3-bed/1.0-bath single-family listed at $148k.
Deal economics
- At list price, monthly cash flow is $-25 ($-295/yr) — negative.
- To cash-flow at today's rent, offer at most $144k (2.9% below list).
- To meet the 1% rule (rent ≥ 1% of price), the offer needs to be $133k (10.3% below list).
- Recommended offer: $133k (10.3% below list) — sets the bar for 1% rule.
- Cap rate 6.6% vs local median 3.9% in Jacksonville — top-decile yield for the area; either an underpriced asset or a hidden risk that comps aren't pricing in. Stress-test before assuming the spread holds.
Location & tenants
- Location reads 83/100 on livability (#50 in FL, #911 nationally) — a professional / high-income tenant draw. Strengths: amenities A+, commute A+, housing A+.
- Duval (urban): math 46% / reading 45% proficiency, ranked #48 of 73 in FL (top 66%) — families likely to look elsewhere, expect single-tenant / working-renter base with shorter leases.
- Zoned schools: George Washington Carver Elementary (math 37% / reading 22%, grade F, #1,896 of 2,144 statewide, top 90%, 290 students, 87% FRL); Joseph Stilwell Middle School (math 31% / reading 33%, grade F, #448 of 571 statewide, top 79%, 612 students, 68% FRL); William M. Raines High School (math 14% / reading 13%, grade F, #616 of 667 statewide, top 92%, 1,217 students, 78% FRL) — zoned schools average 78% FRL vs 49% district-wide (29 pts higher); higher-poverty schools than district average — tighter screening recommended.
- Zoned-school proficiency averages 25% at this address vs 46% district-wide (-20 pts) — the specific schools serving this property underperform the Duval average; the district grade overstates school quality for this exact location.
- Market conditions: Rents rising (+1.8%/yr); 399 active listings in the ZIP; 40 comparable units currently listed for rent nearby; rentals at typical pace (median 26d on market — plan ~3-4 weeks tenant-placement turnaround); lower-income renter base — watch delinquency; 6,503 units permitted in Duval County in 2024 (1,131 in 5+ unit buildings).
Forward outlook
- Local home prices are declining (-3.0%/yr); year-one equity from $1k of loan paydown is wiped out by about $4k of value loss. Plan a longer hold.
- Duval County population projected at +19% by 2050 — long-run rental-demand tailwind backs the buy-and-hold thesis.
Negotiation context
- It's been on market 49 days — a 3% lower offer ($144k) is reasonable based on typical stale-listing flexibility.
- 2 sale attempts since 23y ago; this cycle's ask has dropped $8k (5%) from the opening price — seller is motivated, your offer sets the floor, not the list.
- Current owner paid $70k; list at $148k implies a 111% gain — meaningful room to come down on a strong offer.
Risks & watch-outs
- Watch-outs: flood insurance adds $66/mo.
- Climate carrying-cost: severe flood risk; severe wind risk, 99% chance of damaging wind over 30y; extreme-heat days projected 7→20/yr by 2055 (HVAC capex compounding) — expect insurance premiums to compound above CPI over the hold.
Questions for the listing agent
- What do current leases actually rent for vs. the listed asking? Can we see a recent rent roll and the last 12 months of T-12 income?
- It's been on market 49 days. Have you received any prior offers? Is the seller open to a 10% concession, seller financing, or rate buy-down credit?
- Built in 1965 — when were the roof, HVAC, electrical panel, plumbing, and water heater last replaced?
- What's the actual annual flood-insurance premium (NFIP or private), and is the property in a SFHA with mandatory coverage?
- Is there a deadline driving the sale (1031 exchange, divorce, estate, relocation)? That informs how much negotiation room exists.
- Schools are B-rated — typically a magnet for longer-tenancy family renters. What's the average tenant stay here, and is there a school-zone premium baked into asking?
- The area grade is low — what's the realistic commute time and amenity access for the typical tenant pool here? Any planned neighborhood developments (good or bad) we should know about?
- What's the average days-on-market for RENTAL listings here right now (not sales)? A rising rental-DOM trend means longer vacancies and softer asking-rent achievability than the comps imply.
- What's the recent tenant-quality profile in this submarket — average credit score on applications, eviction rate, late-payment / NSF rate, and stable-employment percentage? A property-management company in the area should have these aggregated.
- How much new for-sale + rental construction is in the pipeline within 1–3 miles? Heavy new supply typically softens prices + rents 12–24 months out; constrained supply supports both.
Investment metrics
- 1% rule
- 0.90% ✗
- Cap rate
- 6.63%
- Cash-on-cash
- 1.21%
- DSCR
- 1.05
- GRM
- 9.3
CMA / ARV
- ARV (on-the-fly)
- $127,440
- Comps found
- 12
Show comp detail 12 sales within ~0.75 mi
| Address | Dist | Beds/Ba | Sqft | Sold | Price | $/sf | Match |
|---|---|---|---|---|---|---|---|
| 4266 Carroll Dr | 0.10mi | 4/2.0 (+1) | 1,101 (+2%) | 4mo | $130,000 | $118 | 80 |
| 5846 Abelia Rd | 0.30mi | 3/1.5 | 1,058 (-2%) | 2mo | $60,000 | $57 | 80 |
| 5932 Floradale Dr | 0.20mi | 3/1.5 | 1,030 (-5%) | 10mo | $77,000 | $75 | 73 |
| 2548 Wisteria St | 0.52mi | 3/1.5 | 1,080 (0%) | 8mo | $45,000 | $42 | 67 |
| 5638 Vernon Rd | 0.46mi | 3/1.0 | 963 (-11%) | 2mo | $99,000 | $103 | 59 |
| 3140 Breve Dr | 0.71mi | 3/1.0 | 1,040 (-4%) | 3mo | $125,000 | $120 | 59 |
| 2904 Lippia Rd | 0.26mi | 4/1.0 (+1) | 964 (-11%) | 8mo | $68,000 | $71 | 58 |
| 3181 Brasque Dr | 0.51mi | 4/2.0 (+1) | 1,140 (+6%) | 2mo | $182,900 | $160 | 56 |
| 2936 Breve Dr | 0.58mi | 3/1.0 | 1,156 (+7%) | 7mo | $145,000 | $125 | 56 |
| 4225 Homer Rd | 0.59mi | 3/1.0 | 924 (-14%) | 1mo | $104,150 | $113 | 48 |
| 6217 Lobelia St | 0.58mi | 4/2.0 (+1) | 1,166 (+8%) | 9mo | $231,500 | $199 | 43 |
| 5319 Bunche Dr | 0.72mi | 3/1.0 | 940 (-13%) | 8mo | $138,000 | $147 | 38 |
Match score weights: distance 35% · size 25% · config 20% · recency 20%. Top-matched comps best support the ARV.
Projected returns pro-forma
-3.0% appreciation · 1.81% rent growth · sell at horizon
- IRR
- -18.8%
- Equity multiple
- 0.35×
- Total profit
- $-27,066
- Equity at exit
- $22,067
- IRR
- -14.0%
- Equity multiple
- 0.24×
- Total profit
- $-31,669
- Equity at exit
- $12,796
Cash invested: $41,440 (down + closing). Projections, not guarantees.
Landlord ↔ Tenant lean methodology
- Overall (STATE)
- 87 Strongly Landlord-Friendly
- State Florida
- 87 Strongly Landlord-Friendly · R+3
- County
- — inherits STATE
- City
- — inherits STATE
ZIP-level market 32209
- Home prices YoY
- -22.1%
- Rents YoY
- 1.8%
- Active inventory
- 399
- Price-to-rent
- 9.3×
Monthly cashflow live
- Estimated rent
- $1,328 high interval (Pro) →
- Mortgage (P&I)
- −$776
- Tax from tax record
- −$169 /mo · $2,030/yr
- Insurance
- −$62
- Flood insurance flood zone
- −$66 /mo · $798/yr
- HOA
- −$0
- Vacancy / Maint / Mgmt
- −$279
- Net cashflow
- $-25
Break-even live
Sensitivity live
| Price | -10% $59 | -5% $17 | +0% $-25 | +5% $-66 | +10% $-108 |
|---|---|---|---|---|---|
| Rent | -10% $-129 | -5% $-77 | +0% $-25 | +5% $28 | +10% $80 |
| Rate | -1.0pp $50 | -0.5pp $13 | base $-25 | +0.5pp $-63 | +1.0pp $-102 |
UW: 25.0% down · 7.5% · 30yr · 1.5% tax · 5.0% vac · 8.0% maint · 8.0% mgmt
Financing live
Cash to close
- Down payment
- $37,000
- Closing costs
- $4,440
- Reserves months
- —
- Total cash needed
- —
Loan-product check · same deal, 3 products live
Conventional
25% down · 7.5% · 30yr
- Down + closing
- —
- Monthly P&I
- —
- Monthly cashflow
- —
- DSCR
- —
- Eligible?
- —
Personal DTI + credit; lowest rate.
DSCR
20% down · 8.5% · 30yr
- Down + closing
- —
- Monthly P&I
- —
- Monthly cashflow
- —
- DSCR
- —
- Eligible?
- —
No personal income docs; deal must DSCR.
Hard money
10% down · 12.0% · 12mo
- Down + closing
- —
- Monthly P&I
- —
- Monthly cashflow
- —
- DSCR
- —
- Eligible?
- —
Short-term bridge; refi at stabilization.
Rent comps 40 comps
| Address | Beds | Baths | Sqft | Rent | $/sqft | DOM | Units | Dist |
|---|---|---|---|---|---|---|---|---|
| 4144 Katanga Dr N Jacksonville, FL | 3.0 | 1.0 | 1114 | $1,095 | $0.98 | 25d | 1 | 0.13mi |
| 4294 Katanga Dr N Jacksonville, FL | 3.0 | 1.0 | 864 | $1,450 | $1.68 | 25d | 1 | 0.19mi |
| 2904 Lippia Rd Jacksonville, FL | 4.0 | 1.0 | 964 | $1,400 | $1.45 | 25d | 1 | 0.28mi |
| 5838 Abelia Rd Jacksonville, FL | 3.0 | 1.0 | 1135 | $1,150 | $1.01 | 25d | 1 | 0.30mi |
| 5814 Begonia Rd Unit 1 Jacksonville, FL | 3.0 | 1.5 | 1500 | $1,655 | $1.10 | 25d | 1 | 0.36mi |
| 5821 Begonia Rd Jacksonville, FL | 3.0 | 2.0 | 1230 | $1,155 | $0.94 | 6d | 1 | 0.39mi |
| 6601 Cleveland Rd Jacksonville, FL | 3.0 | 1.0 | 896 | $1,400 | $1.56 | 25d | 1 | 0.40mi |
| 6188 Pettiford Dr W Jacksonville, FL | 3.0 | 2.0 | 1499 | $1,850 | $1.23 | 14d | 1 | 0.40mi |
| 4236 Homer Rd N Jacksonville, FL | 3.0 | 1.0 | 888 | $1,250 | $1.41 | 13d | 1 | 0.54mi |
| 3997 Leonnie Rd Unit 1 Jacksonville, FL | 2.0 | 1.0 | 840 | $950 | $1.13 | 9d | 1 | 0.63mi |
| 5565 Minosa Cir E Jacksonville, FL | 3.0 | 1.0 | 1227 | $1,400 | $1.14 | 6d | 1 | 0.63mi |
| 4211 Moncrief Rd W Unit 2 Jacksonville, FL | 2.0 | 1.0 | 840 | $995 | $1.18 | 25d | 1 | 0.64mi |
| 5428 Bunche Dr Jacksonville, FL | 3.0 | 1.0 | 900 | $1,600 | $1.78 | 25d | 1 | 0.66mi |
| 4253 Moncrief Rd W Unit 2 Jacksonville, FL | 2.0 | 1.0 | 840 | $975 | $1.16 | 25d | 1 | 0.70mi |
| 5531 Agra Ct Jacksonville, FL | 3.0 | 1.0 | 988 | $1,295 | $1.31 | 16d | 1 | 0.70mi |
| 6731 W Virginia Ct Jacksonville, FL | 3.0 | 1.0 | 1188 | $1,225 | $1.03 | 23d | 1 | 0.72mi |
| 4177 Lorenzo Ct Unit 4 Jacksonville, FL | 2.0 | 1.0 | 840 | $945 | $1.12 | 3d | 1 | 0.74mi |
| 5326 Mays Dr Jacksonville, FL | 3.0 | 1.0 | 900 | $1,200 | $1.33 | 25d | 1 | 0.76mi |
| 5217 Mays Dr Jacksonville, FL | 3.0 | 1.0 | 900 | $1,250 | $1.39 | 9d | 1 | 0.80mi |
| 6114 Strawflower Pl Jacksonville, FL | 3.0 | 1.0 | 1030 | $1,200 | $1.17 | 25d | 1 | 0.81mi |
| 4543 Moncrief Rd W Jacksonville, FL | 2.0 | 1.0 | 950 | $1,075 | $1.13 | 9d | 1 | 0.83mi |
| 5227 Bunche Dr Jacksonville, FL | 3.0 | 2.0 | 1174 | $1,450 | $1.24 | 25d | 1 | 0.84mi |
| 4910 Rhode Island Dr N Jacksonville, FL | 3.0 | 2.0 | 1300 | $1,696 | $1.30 | 25d | 1 | 0.85mi |
| 6412 New Kings Rd Unit 2 Jacksonville, FL | 3.0 | 2.0 | 1300 | $1,400 | $1.08 | 19d | 1 | 0.87mi |
| 6412 New Kings Rd Unit 1 Jacksonville, FL | 2.0 | 2.0 | 1200 | $1,200 | $1.00 | 19d | 1 | 0.87mi |
| 4440 Ken Knight Dr N Jacksonville, FL | 2.0 | 1.0 | 716 | $650 | $0.91 | 16d | 1 | 0.94mi |
| 5355 New Kings Rd Unit 21 Jacksonville, FL | 2.0 | 1.0 | 700 | $800 | $1.14 | 6d | 1 | 0.95mi |
| 2151 Wilberforce Rd Jacksonville, FL | 3.0 | 2.0 | 1166 | $1,249 | $1.07 | 25d | 1 | 0.95mi |
| 5035 Campenella Dr Jacksonville, FL | 3.0 | 1.0 | 875 | $1,095 | $1.25 | 25d | 1 | 0.97mi |
| 2268 W 44th St Jacksonville, FL | 3.0 | 2.0 | 1077 | $1,440 | $1.34 | 6d | 1 | 0.99mi |
| 2092 Benedict Rd Jacksonville, FL | 3.0 | 1.0 | 816 | $1,095 | $1.34 | 25d | 1 | 1.05mi |
| 2818 Palmdale St Jacksonville, FL | 4.0 | 2.5 | 1484 | $1,900 | $1.28 | 25d | 1 | 1.08mi |
| 2108 Talladega Rd Jacksonville, FL | 3.0 | 2.0 | 1160 | $1,579 | $1.36 | 6d | 1 | 1.08mi |
| 5306 Paris Ave Jacksonville, FL | 3.0 | 1.0 | 944 | $1,150 | $1.22 | 25d | 1 | 1.08mi |
| 2069 Talladega Rd Jacksonville, FL | 4.0 | 2.0 | 1152 | $1,298 | $1.13 | 6d | 1 | 1.12mi |
| 2171 W 40th St Jacksonville, FL | 2.0 | 1.0 | 700 | $950 | $1.36 | 25d | 1 | 1.18mi |
| 6705 Gaspar Cir E Jacksonville, FL | 3.0 | 1.5 | 1116 | $1,254 | $1.12 | 19d | 1 | 1.27mi |
| 2693 W 25th St Jacksonville, FL | 3.0 | 1.5 | 1300 | $1,450 | $1.12 | 25d | 1 | 1.28mi |
| 8509 Addison Rd Jacksonville, FL | 4.0 | 2.0 | 1494 | $1,675 | $1.12 | 25d | 1 | 1.28mi |
| 2661 W 25th St Jacksonville, FL | 4.0 | 2.0 | 1031 | $1,350 | $1.31 | 25d | 1 | 1.29mi |
Listing history 17 events
-
2026-06-21days on market $148,000 Active 49 DOM
-
2026-06-18days on market $148,000 Active 46 DOM
-
2026-06-17days on market $148,000 Active 45 DOM
-
2026-06-16days on market $148,000 Active 44 DOM
-
2026-06-15days on market $148,000 Active 43 DOM
-
2026-06-13pricedays on market $148,000 Active 40 DOM
-
2026-06-10days on market $150,990 Active 37 DOM
-
2026-06-08days on market $150,990 Active 36 DOM
-
2026-06-07days on market $150,990 Active 35 DOM
-
2026-06-05days on market $150,990 Active 32 DOM
-
2026-05-31days on market $150,990 Active 31 DOM
-
2026-05-14price $150,990
-
2026-03-22$155,990 Active
-
2003-08-25soldstatus $70,000
-
2003-04-30soldstatus $43,000
-
2003-03-21soldstatus $38,000 305-char remark
Show marketing remark (305 chars)
BRICK OFF-GRADE; POSSIBLE 3RD BEDROOM; POSSIBLE HOOK-UP (AT BUYER'S COST) TO CITY WATER/SEWER. SELLING AS-IS; SPECIAL ADDENDUM REQ'D W/ ALL OFFERS; FULL CONTRACTS ONLY--NO VERBALS OR LOI'S; NO REPAIRS; NO FHA/VA; NO SURVEY CALL L.A. FOR FAX COPY OF ADDENDUM; CALL L.A. OR L.O. FOR LOCK-BOX COMBO TO SHOW!!
-
2003-01-30$35,900 305-char remark
Show marketing remark (305 chars)
BRICK OFF-GRADE; POSSIBLE 3RD BEDROOM; POSSIBLE HOOK-UP (AT BUYER'S COST) TO CITY WATER/SEWER. SELLING AS-IS; SPECIAL ADDENDUM REQ'D W/ ALL OFFERS; FULL CONTRACTS ONLY--NO VERBALS OR LOI'S; NO REPAIRS; NO FHA/VA; NO SURVEY CALL L.A. FOR FAX COPY OF ADDENDUM; CALL L.A. OR L.O. FOR LOCK-BOX COMBO TO SHOW!!
ⓘ Source: listings_history table (triggers on properties + properties_extension) + one-shot
backfill from property_details.listing_events for pre-trigger history.
Tax reassessment forecast FL · Resets to sale price
- Current annual tax
- $2,030 · $169/mo
- Projected year-2 tax
- $2,030 · $169/mo
- Expected delta
- $0/yr ($0/mo · 0.0%)
ⓘ Screening estimate from a state-policy table — verify with the county assessor before closing.
Climate risk First Street
- Flood 8/10 Severe FEMA zone X (unshaded) · 99% chance over 30 yrs
- Wildfire 2/10 Low
- Heat 9/10 Extreme 7 d/yr ≥107°F today · 20 d/yr by 30 yrs out
- Wind 9/10 Extreme 99% chance of damaging wind over 30 yrs
- Air quality 4/10 Moderate 6 unhealthy d/yr today · 6 by 30 yrs out
Nearby sold comps map
Loading sold comps map…
Walkable amenities ~0.75 mi
Loading nearby amenities…
Taxation est. · year 1
- Rental income
- $15,933
- − Mortgage interest
- −$8,290
- − Property taxes
- −$2,030
- − Insurance
- −$1,538
- − Repairs & maintenance
- −$1,275
- − Management
- −$1,275
- − Depreciation
- −$4,305
- Taxable loss
- −$2,780
- Est. tax savings @ 24.0%
- +$667
- After-tax cash flow
- $373/yr
For passive investors: Depreciation is non-cash, so a rental often shows a tax loss while cash-flowing — sheltering income. Rental losses are passive: they offset passive income freely, and up to $25,000/yr can offset ordinary (W-2) income if you actively participate and your MAGI is under $100k (phasing out to $0 by $150k); unused losses carry forward. On sale, claimed depreciation is recaptured at up to 25%, and gains may owe capital-gains tax (a 1031 exchange can defer both). Figures are a year-1 estimate at your 24.0% rate — not tax advice; consult a CPA.
Schools (NCES district)
- District
- Duval
- NCES district ID
- 1200480
- Math proficiency
- 46% ▼ -11.00%
- Reading proficiency
- 45% ▼ -4.00%
- Median HH income
- $48,987
- Composite
- 38.97/100
- National rank
- #4076
- State rank
- #48 of 73 in FL
Livability — Jacksonville
- Score
- 83/100
- State rank
- #50
- US rank
- #911
Category grades
Schools grade is shown separately in the Schools card above.
Census & demographics
- Census place
- Jacksonville, FL
- County
- Duval County · 1,015,274 people
- City population
- 979,034
- Metro
- Jacksonville, FL
- Population (ZIP)
- 34,657
- Household income
- $30,514
- Rent vs Own
- Severe rent burden
- 2921.0
Population outlook (Duval County) Hauer SSP2
- Today (2025)
- 1,013,010 people
- By 2030
- 1,059,228 · +4.6%
- By 2040
- 1,141,439 · +12.7%
- By 2050
- 1,205,258 · +19.0%
- By 2075
- 1,324,282 · +30.7%
- By 2100
- 1,319,620 · +30.3%
Race, ethnicity, and origin ACS 2023
- Neighborhood character
- Predominantly Black (88%)
- Race & ethnicity
- Black 88% White 5% Hispanic / Latino 5% Two or more races 2%
- Hispanic origin (detail)
- Puerto Rican 3%
- Common ancestry
- Hispanic 1% Romanian 1%
- Foreign-born
- 3% · Canada
- Languages at home
- 95% English-only · Spanish 4% French/Haitian/Cajun 1%
Political lean MEDSL · Duval
- 2024 margin
- Toss-up / Even · D 48.7% · R 50.1% · Other 1.2%
- 2008→2024 swing
- +0.4pp no change · 2008: -1.9pp · 2024: -1.5pp
- All cycles
- 2024: R+1.5 2020: D+3.8 2016: R+1.5 2012: R+3.6 2008: R+1.9
Not yet ingested
- Civics
- —
Market trends
- HPI YoY
- ▼ -53.92%
- Current HPI
- 189.5977
- Rent YoY
- ▲ 1.81%
- Metro
- Jacksonville, FL
- State GDP YoY
- ▲ 3.28%
- F500 in state
- 36
Industry mix (Fortune 500 HQ in FL)
| Industry | F500 HQs | Revenue |
|---|---|---|
| Industrial Technology | 2 | $29B |
|
||
| Insurance | 2 | $17B |
|
||
| Retail | 1 | $60B |
|
||
| Technology Distribution | 1 | $58B |
|
||
| Homebuilding | 1 | $35B |
|
||
| Technology Manufacturing | 1 | $35B |
|
||
Price history
+320.6% since first listed6 events — show timeline
- 2026-05-14 Price Changed $150,990 realMLS
- 2026-03-22 Listed $155,990 realMLS
- 2003-08-25 Sold (Public Records) $70,000 Public Records
- 2003-04-30 Sold (Public Records) $43,000 Public Records
- 2003-03-21 Sold (MLS) $38,000 realMLS
- 2003-01-30 Listed $35,900 realMLS
Property tax history
+11.2%/yrLatest (2025): $2,030 · +11.3% YoY. Source: county tax records.
Cash-flow waterfall
monthlySold comps — $/sqft
last 12 mo · ≤1 miLoading sold comps…