21201 NE 58th St #49 · Camas, WA
Flood risk No data
- FEMA flood zone
- —
- Chance of flooding over 30 yrs
- —
- Est. flood insurance / yr
- —
Fire risk No data
- Est. fire insurance / yr
- —
Heat risk No data
- Hot days now (above threshold)
- —
- Hot days in 30 yrs
- —
Wind risk No data
- Chance of severe wind over 30 yrs
- —
Air-quality risk No data
- Unhealthy air days now
- —
- Unhealthy air days in 30 yrs
- —
Risk factors via First Street. Map © Google.
Why this score? — see what drove the B- grade
The composite is a weighted blend of 9 inputs, each scored 0–100. Each bar is that input's sub-score; the figure is the points it added to the 100-point composite (weight × sub-score).
- Cash flow +30.0/30.0
- 1% rule +10.0/10.0
- DSCR +10.0/10.0
- ARV discount +4.9/15.0
- Schools +4.3/10.0
- Livability +3.7/5.0
- Rent growth +2.7/5.0
- Condition / age +2.5/5.0
- Appreciation +0.0/10.0
$109,900
🖨 Deal sheet 📄 Offer letter ✓ Due diligence
Listing remarks
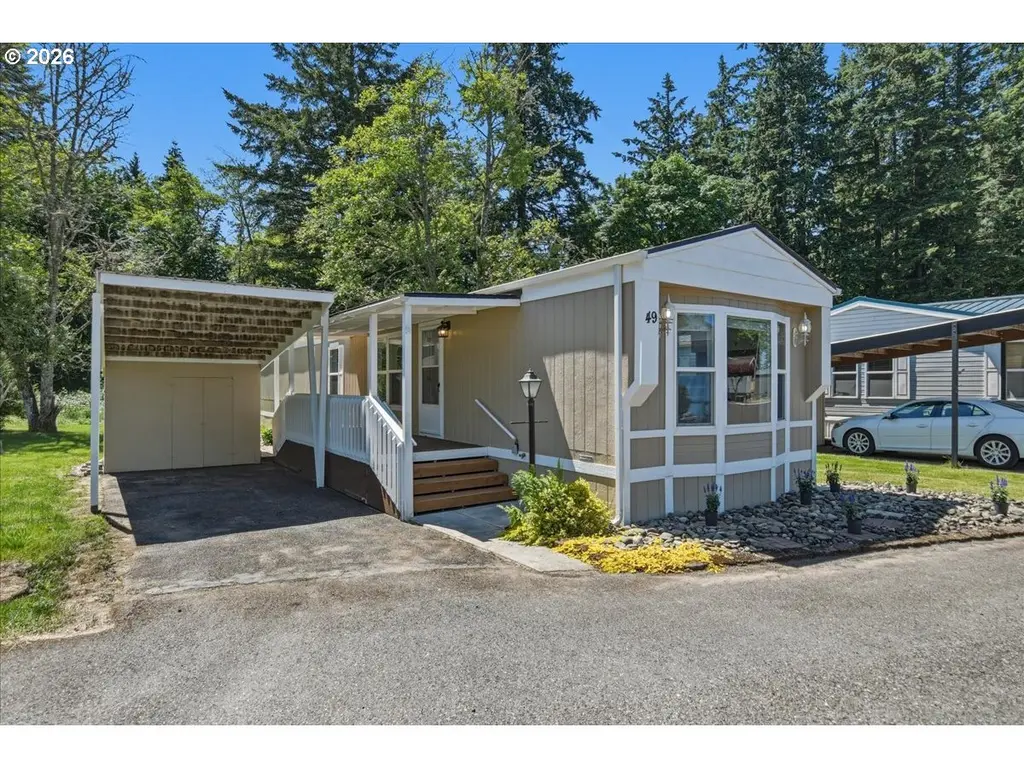
Enjoy this affordable and well-maintained manufactured home in Green Mountain Mobile Ranch, conveniently located just minutes from shopping, dining, and everyday amenities near 192nd Avenue and Fourth Plain Boulevard. Situated on an end lot at the back of the community, this 2-bedroom, 1.5-bath home offers an attractive setting with open space nearby and a greenspace backdrop. Recent updates make this home move-in ready, including new flooring, fresh interior and exterior paint, updated lighting, new interior doors, a new dishwasher, replacement of 11 window panes, smoke detectors, and more. A washer and dryer are included for added convenience. The home's location provides a pleasant outlo
Key facts
- New flooring
- End lot
- Greenspace backdrop
Tags
Property features AI
Finance
- Other: Land lease expires September 1, 2026
- Financial info: Monthly lot rent
- HOA & community: Park amenities include commons, sewer, and water; Located in Green Mountain Mobile Ranch (non-senior community); Land lease (monthly)
Exterior
- Parking: Carport
- Utilities: Public water; Septic tank sewer; Electric service; Cable and satellite internet available
- Home design: Manufactured home in park; Single-story; Model 14/70; Unit dimensions approximately 14 x 70; Home warranty included; Not attached
- Construction: Built in 1996; Cement and lap siding; Composition roof; Skirting foundation
- Exterior features: Covered deck; Deck; Tool shed; Yard; Level lot; Paved road access; Trees/woods view
Interior
- Kitchen: Dishwasher; Free-standing range; Microwave; Plumbed for ice maker; Solid surface countertops
- Bedrooms: Primary bedroom on main level; Second bedroom on main level
- Flooring: Luxury vinyl plank; Vinyl flooring
- Bathrooms: One full bathroom; One half bathroom (main level)
- Heating & cooling: Forced air heating; No central air
- Interior features: Laundry area; Vaulted ceilings; Wainscoting; Storage space (crawl space)
- Laundry & utility: Washer and dryer included; Electric hot water
Neighborhood map
What this means for you Summary
Snapshot
- This is a 3-bed/2.0-bath manufactured listed at $110k.
Deal economics
- At list price, monthly cash flow is $918 ($11k/yr) — positive.
- The deal already cash-flows at list — no discount required.
- Meets the 1% rule at list price ($2k rent vs $110k).
- Cap rate 16.3% vs local median 1.7% in Camas — top-decile yield for the area; either an underpriced asset or a hidden risk that comps aren't pricing in. Stress-test before assuming the spread holds.
Location & tenants
- Location reads 74/100 on livability (#181 in WA, #4,740 nationally) — a middle-class / working-renter tenant base. Strengths: crime A+, employment A+, housing A+; Watch: amenities F, commute F, cost of living F.
- Evergreen School District (Clark) (urban): math 41% / reading 51% proficiency, ranked #164 of 291 in WA (top 56%) — families likely to look elsewhere, expect single-tenant / working-renter base with shorter leases.
- Zoned schools: Pioneer Elementary School (546 students, 54% FRL); Frontier Middle School (800 students, 60% FRL); Union High School (2,021 students, 38% FRL).
- Market conditions: Rents flat; 461 active listings in the ZIP; solid renter incomes; 3,547 units permitted in Clark County in 2024 (1,361 in 5+ unit buildings).
Forward outlook
- Local home prices are declining (-3.0%/yr); year-one equity from $760 of loan paydown is wiped out by about $3k of value loss. Plan a longer hold.
- Clark County population projected at +29% by 2050 — long-run rental-demand tailwind backs the buy-and-hold thesis.
- At projected returns (-3.0% appreciation + 0.6% rent growth), your $31k cash investment doubles in ~4 years — after that, you're playing with house money.
Negotiation context
- Only 14 days on market — expect competitive offers; lowballing is unlikely to land.
Questions for the listing agent
- Is there a deadline driving the sale (1031 exchange, divorce, estate, relocation)? That informs how much negotiation room exists.
- Schools are A-rated — typically a magnet for longer-tenancy family renters. What's the average tenant stay here, and is there a school-zone premium baked into asking?
- What's the average days-on-market for RENTAL listings here right now (not sales)? A rising rental-DOM trend means longer vacancies and softer asking-rent achievability than the comps imply.
- What's the recent tenant-quality profile in this submarket — average credit score on applications, eviction rate, late-payment / NSF rate, and stable-employment percentage? A property-management company in the area should have these aggregated.
- How much new for-sale + rental construction is in the pipeline within 1–3 miles? Heavy new supply typically softens prices + rents 12–24 months out; constrained supply supports both.
Investment metrics
- 1% rule
- 1.93% ✓
- Cap rate
- 16.32%
- Cash-on-cash
- 35.81%
- DSCR
- 2.59
- GRM
- 4.3
CMA / ARV
- ARV (on-the-fly)
- $103,986
- Comps found
- 4
Show comp detail 4 sales within ~0.75 mi
| Address | Dist | Beds/Ba | Sqft | Sold | Price | $/sf | Match |
|---|---|---|---|---|---|---|---|
| 21201 NE 58th St #34 | 0.00mi | 2/1.0 (-1) | 975 (+2%) | 1mo | $75,000 | $77 | 87 |
| 21201 NE 58th St #26 | 0.00mi | 2/2.0 (-1) | 938 (-2%) | 13mo | $114,500 | $122 | 81 |
| 21201 NE 58th St #30 | 0.00mi | 2/1.0 (-1) | 966 (+1%) | 23mo | $105,000 | $109 | 70 |
| 21201 NE 58th St #10 | 0.00mi | 2/2.0 (-1) | 1,008 (+6%) | 19mo | $58,997 | $59 | 70 |
Match score weights: distance 35% · size 25% · config 20% · recency 20%. Top-matched comps best support the ARV.
Projected returns pro-forma
-3.0% appreciation · 0.63% rent growth · sell at horizon
- IRR
- 28.8%
- Equity multiple
- 2.16×
- Total profit
- $35,755
- Equity at exit
- $16,386
- IRR
- 34.8%
- Equity multiple
- 3.83×
- Total profit
- $87,207
- Equity at exit
- $9,502
Cash invested: $30,772 (down + closing). Projections, not guarantees.
Landlord ↔ Tenant lean methodology
- Overall (STATE)
- 28 Tenant-Leaning
- State Washington
- 28 Tenant-Leaning · D+8
- County
- — inherits STATE
- City
- — inherits STATE
ZIP-level market 98682
- Rents YoY
- 0.6%
- Active inventory
- 461
- Price-to-rent
- 4.3×
Monthly cashflow live
- Estimated rent
- $2,124 medium interval (Pro) →
- Mortgage (P&I)
- −$576
- Tax est. 1.5%
- −$137 /mo · $1,648/yr
- Insurance
- −$46
- HOA
- −$0
- Vacancy / Maint / Mgmt
- −$446
- Net cashflow
- $918
Break-even live
UW: 25.0% down · 7.5% · 30yr · 1.5% tax · 5.0% vac · 8.0% maint · 8.0% mgmt
Financing live
Cash to close
- Down payment
- $27,475
- Closing costs
- $3,297
- Reserves months
- —
- Total cash needed
- —
Loan-product check · same deal, 3 products live
Conventional
25% down · 7.5% · 30yr
- Down + closing
- —
- Monthly P&I
- —
- Monthly cashflow
- —
- DSCR
- —
- Eligible?
- —
Personal DTI + credit; lowest rate.
DSCR
20% down · 8.5% · 30yr
- Down + closing
- —
- Monthly P&I
- —
- Monthly cashflow
- —
- DSCR
- —
- Eligible?
- —
No personal income docs; deal must DSCR.
Hard money
10% down · 12.0% · 12mo
- Down + closing
- —
- Monthly P&I
- —
- Monthly cashflow
- —
- DSCR
- —
- Eligible?
- —
Short-term bridge; refi at stabilization.
Listing history 11 events
-
2026-06-19status $109,900 Pending 14 DOM
-
2026-06-18days on market $109,900 Active 14 DOM
-
2026-06-17days on market $109,900 Active 13 DOM
-
2026-06-16days on market $109,900 Active 12 DOM
-
2026-06-15days on market $109,900 Active 11 DOM
-
2026-06-13days on market $109,900 Active 9 DOM
-
2026-06-13days on market $109,900 Active 8 DOM
-
2026-06-09days on market $109,900 Active 5 DOM
-
2026-06-08days on market $109,900 Active 4 DOM
-
2026-06-07remarks 699-char remark
-
2026-06-07$109,900 Active 3 DOM
ⓘ Source: listings_history table (triggers on properties + properties_extension) + one-shot
backfill from property_details.listing_events for pre-trigger history.
Nearby sold comps map
Loading sold comps map…
Walkable amenities ~0.75 mi
Loading nearby amenities…
Taxation est. · year 1
- Rental income
- $25,483
- − Mortgage interest
- −$6,156
- − Property taxes
- −$1,648
- − Insurance
- −$550
- − Repairs & maintenance
- −$2,039
- − Management
- −$2,039
- − Depreciation
- −$3,197
- Taxable income
- $9,855
- Est. tax owed @ 24.0%
- −$2,365
- After-tax cash flow
- $8,653/yr
For passive investors: Depreciation is non-cash, so a rental often shows a tax loss while cash-flowing — sheltering income. Rental losses are passive: they offset passive income freely, and up to $25,000/yr can offset ordinary (W-2) income if you actively participate and your MAGI is under $100k (phasing out to $0 by $150k); unused losses carry forward. On sale, claimed depreciation is recaptured at up to 25%, and gains may owe capital-gains tax (a 1031 exchange can defer both). Figures are a year-1 estimate at your 24.0% rate — not tax advice; consult a CPA.
Schools (NCES district)
- District
- Evergreen School District (Clark)
- NCES district ID
- 5302700
- Math proficiency
- 41% ▼ -3.00%
- Reading proficiency
- 51% ▼ -3.00%
- Median HH income
- $59,418
- Composite
- 42.53/100
- National rank
- #6859
- State rank
- #164 of 291 in WA
Livability — Camas
- Score
- 74/100
- State rank
- #181
- US rank
- #4740
Category grades
Schools grade is shown separately in the Schools card above.
Census & demographics
- County
- Clark County · 513,189 people
- City population
- 35,867
- Metro
- Portland-Vancouver-Hillsboro, OR-WA
- Population (ZIP)
- 68,305
- Household income
- $99,918
- Rent vs Own
- Severe rent burden
- 1618.0
Population outlook (Clark County) Hauer SSP2
- Today (2025)
- 529,610 people
- By 2030
- 563,242 · +6.4%
- By 2040
- 625,905 · +18.2%
- By 2050
- 681,558 · +28.7%
- By 2075
- 805,967 · +52.2%
- By 2100
- 877,450 · +65.7%
Race, ethnicity, and origin ACS 2023
- Neighborhood character
- Predominantly White (69%)
- Race & ethnicity
- White 69% Hispanic / Latino 15% Two or more races 13% Asian 6% Black 2% Pacific Islander 1%
- Hispanic origin (detail)
- Mexican 12%
- Common ancestry
- Portuguese 3% Subsaharan African 3% Scotch-Irish 2%
- Foreign-born
- 13% · Canada, Vietnam, South Korea
- Languages at home
- 79% English-only · Spanish 8% Russian/Polish/Slavic 6% Other Asian/Pacific 2%
Political lean MEDSL · Clark
- 2024 margin
- Lean D (+7.0) · D 52.1% · R 45.1% · Other 2.8%
- 2008→2024 swing
- +0.9pp no change · 2008: 6.1pp · 2024: 7.0pp
- All cycles
- 2024: D+7.0 2020: D+5.1 2016: D+0.1 2012: D+0.1 2008: D+6.1
Not yet ingested
- Civics
- —
Market trends
- HPI YoY
- ▼ -303.95%
- Current HPI
- 307.0529
- Rent YoY
- ▲ 0.63%
- Metro
- Portland-Vancouver-Hillsboro, OR-WA
- State GDP YoY
- ▲ 4.65%
- F500 in state
- 22
Industry mix (Fortune 500 HQ in WA)
| Industry | F500 HQs | Revenue |
|---|---|---|
| Retail | 2 | $269B |
|
||
| Technology / Retail | 1 | $638B |
|
||
| Technology | 1 | $245B |
|
||
| Telecommunications | 1 | $38B |
|
||
| Food / Beverage | 1 | $36B |
|
||
| Automotive / Trucks | 1 | $34B |
|
||
Price history
1 event — show timeline
- 2026-06-04 Listed $109,900 RMLS
Cash-flow waterfall
monthlySold comps — $/sqft
last 12 mo · ≤1 miLoading sold comps…