 Multi-family
110 Squaw Valley Rd · McCloud, CA
Flood risk No data
- FEMA flood zone
- —
- Chance of flooding over 30 yrs
- —
- Est. flood insurance / yr
- —
Fire risk No data
- Est. fire insurance / yr
- —
Heat risk No data
- Hot days now (above threshold)
- —
- Hot days in 30 yrs
- —
Wind risk No data
- Chance of severe wind over 30 yrs
- —
Air-quality risk No data
- Unhealthy air days now
- —
- Unhealthy air days in 30 yrs
- —
Risk factors via First Street. Map © Google.
Why this score? — see what drove the C+ grade
The composite is a weighted blend of 9 inputs, each scored 0–100. Each bar is that input's sub-score; the figure is the points it added to the 100-point composite (weight × sub-score).
- Cash flow +22.5/30.0
- Appreciation +10.0/10.0
- ARV discount +7.5/15.0
- DSCR +7.2/10.0
- 1% rule +5.0/10.0
- Schools +3.6/10.0
- Livability +3.0/5.0
- Rent growth +2.5/5.0
- Condition / age +2.5/5.0
$699,000
🖨 Deal sheet 📄 Offer letter ✓ Due diligence
Multi-family units
County records classify this as Multi-Family (2-4 Unit). Listing-text estimate: 1 unit. estimate disagrees with records
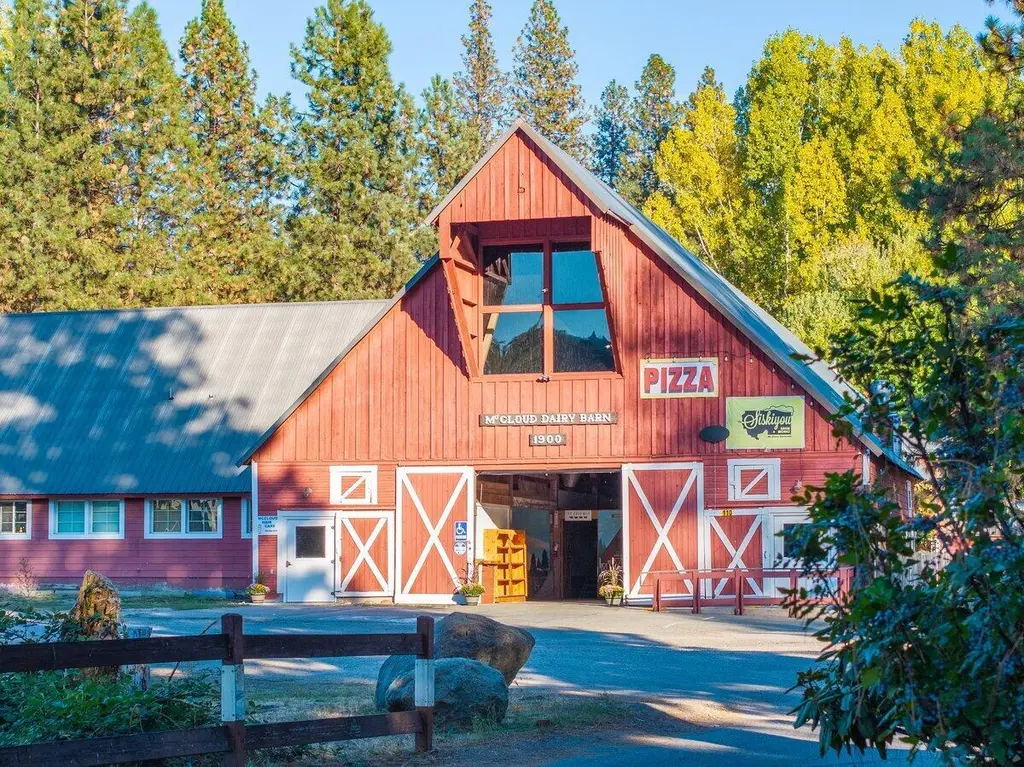
Listing remarks
Historic McCloud Barn- Mixed-Use Investment Property 20,000SF Commercial and Residential complex on two acres built in 1900. This beautifully preserved timber barn has been thoughtfully converted into a thriving mixed-use facility. Currently generating income from multiple tenants, this property offers significant potential for further development. Presently the property hosts two well-maintained residential apartments, each offering two bedrooms. The only year-round restaurant and brewpub operate on-site, alongside an established hair salon. Additional commercial spaces are available for immediate lease, not to mention the property maintains an active storage license providing steady suppl
Key facts
- Brewpub
- Timber barn
- Two acres
Tags
Property features AI
Exterior
- Parking: 20 total parking spaces; Guest parking; Boat parking; Oversized parking; RV access/parking
- Utilities: Utilities information not detailed
- Home design: Single-family residence; One and two story configuration
- Construction: Wood siding and fiber cement (HardiPlank-type) exterior; Slab foundation; Year built not provided
- Exterior features: Metal roof; Gravel road access; City lot, mostly level; Property has a view
Interior
- Kitchen: Cooktop; Refrigerator; Dishwasher not listed
- Flooring: Tile; Carpet; Laminate
- Bathrooms: Three full bathrooms; Two half bathrooms
- Heating & cooling: Heating present; No central cooling
- Interior features: Wood-burning fireplace; Tile, carpet, and laminate flooring
- Laundry & utility: Washer; Dryer
Neighborhood map
What this means for you Summary
Snapshot
- This is a ?-bed/4.0-bath multifamily listed at $699k.
Deal economics
- At list price, monthly cash flow is $1k ($14k/yr) — positive.
- The deal already cash-flows at list — no discount required.
- Meets the 1% rule at list price ($7k rent vs $699k).
- Recommended offer: $678k (3.0% below list) — sets the bar for market timing.
Location & tenants
- Location reads 59/100 on livability (#636 in CA) — a working-class tenant base; expect higher turnover. Strengths: health & safety A+, housing B+; Watch: crime F, amenities F, commute F.
- Siskiyou Union High (rural): math 25% / reading 55% proficiency, ranked #763 of 1,400 in CA (top 54%) — families likely to look elsewhere, expect single-tenant / working-renter base with shorter leases; only 12% free/reduced lunch — higher-income household profile.
- Market conditions: 135 active listings in the ZIP; 1 comparable units currently listed for rent nearby; 50 units permitted in Siskiyou County in 2024 (0 in 5+ unit buildings).
Forward outlook
- In year one you build about $75k of equity ($5k loan paydown + $70k appreciation (10.0% local appreciation)).
- Siskiyou County population projected at -26% by 2050 — secular population decline; favor cash flow + early exit over multi-decade hold.
- At projected returns (10.0% appreciation + 3.0% rent growth), your $196k cash investment doubles in ~3 years — after that, you're playing with house money.
- By year 2, paydown + projected appreciation supports a ~$120k cash-out refi (75% LTV) — recoverable capital for the next deal without selling this one.
Negotiation context
- It's been on market 50 days — a 3% lower offer ($678k) is reasonable based on typical stale-listing flexibility.
- 3 sale attempts since 2y ago with the ask held roughly flat each time — persistent listings suggest the price (not the market) is what's stuck; bring a comps-based counter.
Risks & watch-outs
- Watch-outs: built in 1900 — expect roof / HVAC / electrical / plumbing capex.
Questions for the listing agent
- It's been on market 50 days. Have you received any prior offers? Is the seller open to a 3% concession, seller financing, or rate buy-down credit?
- Built in 1900 — when were the roof, HVAC, electrical panel, plumbing, and water heater last replaced?
- Is there a deadline driving the sale (1031 exchange, divorce, estate, relocation)? That informs how much negotiation room exists.
- Crime grade is F in this area — have there been break-ins, vandalism, or insurance claims at this property in the last 3 years? What carrier currently insures it and at what premium?
- What's the average days-on-market for RENTAL listings here right now (not sales)? A rising rental-DOM trend means longer vacancies and softer asking-rent achievability than the comps imply.
- What's the recent tenant-quality profile in this submarket — average credit score on applications, eviction rate, late-payment / NSF rate, and stable-employment percentage? A property-management company in the area should have these aggregated.
- How much new apartment / multifamily construction is in the pipeline within 1–3 miles? Heavy new supply (>2% of stock underway) typically softens rents 12–24 months out; light construction supports rent growth.
Investment metrics
- 1% rule
- 1.00% ✓
- Cap rate
- 8.31%
- Cash-on-cash
- 7.19%
- DSCR
- 1.32
- GRM
- 8.3
CMA / ARV
No comps found within radius.
Show comp detail 2 sales within ~0.75 mi
| Address | Dist | Beds/Ba | Sqft | Sold | Price | $/sf | Match |
|---|---|---|---|---|---|---|---|
| 301-305 Main St | 0.29mi | —/3.0 | 1,100 | 4mo | $205,000 | $186 | 66 |
| 328 Main St | 0.32mi | —/2.0 | 4,000 | 21mo | $260,000 | $65 | 47 |
Match score weights: distance 35% · size 25% · config 20% · recency 20%. Top-matched comps best support the ARV.
Projected returns pro-forma
10.0% appreciation · 3.0% rent growth · sell at horizon
- IRR
- 29.5%
- Equity multiple
- 3.33×
- Total profit
- $455,178
- Equity at exit
- $629,715
- IRR
- 25.6%
- Equity multiple
- 7.55×
- Total profit
- $1,281,336
- Equity at exit
- $1,358,003
Cash invested: $195,720 (down + closing). Projections, not guarantees.
Landlord ↔ Tenant lean methodology
- Overall (STATE)
- 18 Strongly Tenant-Friendly
- State California
- 18 Strongly Tenant-Friendly · D+13
- County
- — inherits STATE
- City
- — inherits STATE
ZIP-level market 96057
- Active inventory
- 135
- Price-to-rent
- 16.6×
Monthly cashflow live
- Estimated rent
- $7,000 medium interval (Pro) →
- Mortgage (P&I)
- −$3,666
- Tax from tax record
- −$401 /mo · $4,809/yr
- Insurance
- −$291
- HOA
- −$0
- Vacancy / Maint / Mgmt
- −$1,470
- Net cashflow
- $1,172
Break-even live
2-unit breakdown (identical units grouped — click to expand)
| Units | Beds | Baths | Est. rent |
|---|---|---|---|
| 2× units | 2 | 1 | $7,000 |
| #1 | 2 | 1 | $3,500 |
| #2 | 2 | 1 | $3,500 |
| Total (2 units) | $7,000 | ||
UW: 25.0% down · 7.5% · 30yr · 1.5% tax · 5.0% vac · 8.0% maint · 8.0% mgmt
Financing live
Cash to close
- Down payment
- $174,750
- Closing costs
- $20,970
- Reserves months
- —
- Total cash needed
- —
Loan-product check · same deal, 3 products live
Conventional
25% down · 7.5% · 30yr
- Down + closing
- —
- Monthly P&I
- —
- Monthly cashflow
- —
- DSCR
- —
- Eligible?
- —
Personal DTI + credit; lowest rate.
DSCR
20% down · 8.5% · 30yr
- Down + closing
- —
- Monthly P&I
- —
- Monthly cashflow
- —
- DSCR
- —
- Eligible?
- —
No personal income docs; deal must DSCR.
Hard money
10% down · 12.0% · 12mo
- Down + closing
- —
- Monthly P&I
- —
- Monthly cashflow
- —
- DSCR
- —
- Eligible?
- —
Short-term bridge; refi at stabilization.
Rent comps 1 comps
| Address | Beds | Baths | Sqft | Rent | $/sqft | DOM | Units | Dist |
|---|---|---|---|---|---|---|---|---|
| 216 Shasta Ave McCloud, CA | 3.0 | 2.0 | 1344 | $3,500 | $2.60 | 13d | 1 | 0.34mi |
Listing history 22 events
-
2026-06-19days on market $699,000 Active 50 DOM
-
2026-06-18days on market $699,000 Active 49 DOM
-
2026-06-17days on market $699,000 Active 48 DOM
-
2026-06-16days on market $699,000 Active 47 DOM
-
2026-06-15days on market $699,000 Active 46 DOM
-
2026-06-14days on market $699,000 Active 44 DOM
-
2026-06-12days on market $699,000 Active 43 DOM
-
2026-06-09days on market $699,000 Active 40 DOM
-
2026-06-08days on market $699,000 Active 39 DOM
-
2026-06-07days on market $699,000 Active 38 DOM
-
2026-06-07days on market $699,000 Active 37 DOM
-
2026-06-04days on market $699,000 Active 34 DOM
-
2026-06-02days on market $699,000 Active 33 DOM
-
2026-06-01days on market $699,000 Active 32 DOM
-
2026-05-31days on market $699,000 Active 31 DOM
-
2026-05-31days on market $699,000 Active 30 DOM
-
2026-04-30$699,000 Active
-
2025-11-20$699,000 Active
-
2025-06-19price $695,000
-
2024-11-19$795,000 Active
-
2023-10-11price $975,000
-
2023-10-11price $975,000
ⓘ Source: listings_history table (triggers on properties + properties_extension) + one-shot
backfill from property_details.listing_events for pre-trigger history.
Tax reassessment forecast CA · Resets to sale price
- Current annual tax
- $4,809 · $401/mo
- Projected year-2 tax
- $5,312 · $443/mo
- Expected delta
- +$503/yr (+$42/mo · 10.5%)
ⓘ Screening estimate from a state-policy table — verify with the county assessor before closing.
Nearby sold comps map
Loading sold comps map…
Walkable amenities ~0.75 mi
Loading nearby amenities…
Taxation est. · year 1
- Rental income
- $84,000
- − Mortgage interest
- −$39,155
- − Property taxes
- −$4,809
- − Insurance
- −$3,495
- − Repairs & maintenance
- −$6,720
- − Management
- −$6,720
- − Depreciation
- −$20,335
- Taxable income
- $2,767
- Est. tax owed @ 24.0%
- −$664
- After-tax cash flow
- $13,404/yr
For passive investors: Depreciation is non-cash, so a rental often shows a tax loss while cash-flowing — sheltering income. Rental losses are passive: they offset passive income freely, and up to $25,000/yr can offset ordinary (W-2) income if you actively participate and your MAGI is under $100k (phasing out to $0 by $150k); unused losses carry forward. On sale, claimed depreciation is recaptured at up to 25%, and gains may owe capital-gains tax (a 1031 exchange can defer both). Figures are a year-1 estimate at your 24.0% rate — not tax advice; consult a CPA.
Schools (NCES district)
- District
- Siskiyou Union High
- NCES district ID
- 0636940
- Math proficiency
- 25% ▲ 5.00%
- Reading proficiency
- 55% ▲ 5.00%
- Median HH income
- $39,293
- Composite
- 35.84/100
- National rank
- #9605
- State rank
- #763 of 1400 in CA
Livability — McCloud
- Score
- 59/100
- State rank
- #636
- US rank
- #20040
Category grades
Schools grade is shown separately in the Schools card above.
Census & demographics
- Census place
- McCloud, CA
- Population (ZIP)
- 1,076
Population outlook (Siskiyou County) Hauer SSP2
- Today (2025)
- 39,337 people
- By 2030
- 36,930 · -6.1%
- By 2040
- 32,367 · -17.7%
- By 2050
- 29,030 · -26.2%
- By 2075
- 23,534 · -40.2%
- By 2100
- 19,312 · -50.9%
Race, ethnicity, and origin ACS 2023
- Neighborhood character
- Predominantly White (79%)
- Race & ethnicity
- White 79% Two or more races 13% Hispanic / Latino 6% Native American 3% Asian 1%
- Hispanic origin (detail)
- Mexican 5%
- Common ancestry
- Russian 6% Slovak 5% Lithuanian 3%
- Foreign-born
- 5% · Canada
- Languages at home
- 96% English-only · German/W. Germanic 1% Other Asian/Pacific 1% Spanish 1%
Political lean MEDSL · Siskiyou
- 2024 margin
- R (+19.2) · D 38.8% · R 58.0% · Other 3.2%
- 2008→2024 swing
- -8.8pp toward R · 2008: -10.4pp · 2024: -19.2pp
- All cycles
- 2024: R+19.2 2020: R+15.8 2016: R+20.7 2012: R+15.6 2008: R+10.4
Not yet ingested
- Civics
- —
Market trends
- HPI YoY
- ▲ 147.64%
- Current HPI
- 490.68
- Rent YoY
- —
- Metro
- —
- State GDP YoY
- ▲ 3.21%
- F500 in state
- 116
Industry mix (Fortune 500 HQ in CA)
| Industry | F500 HQs | Revenue |
|---|---|---|
| Technology | 27 | $1,492B |
|
||
| Financial Services | 3 | $174B |
|
||
| Retail | 3 | $44B |
|
||
| Insurance | 3 | $26B |
|
||
| Media / Entertainment | 2 | $115B |
|
||
| Pharmaceuticals / Biotech | 2 | $62B |
|
||
Price history
-28.3% since first listed6 events — show timeline
- 2026-04-30 Listed $699,000 SAOR
- 2025-11-20 Listed $699,000 SAOR
- 2025-06-19 Price Changed $695,000 SAOR
- 2024-11-19 Listed $795,000 SAOR
- 2023-10-11 Price Changed $975,000 SMLS
- 2023-10-11 Price Changed $975,000 SMLS
Cash-flow waterfall
monthlySold comps — $/sqft
last 12 mo · ≤1 miLoading sold comps…