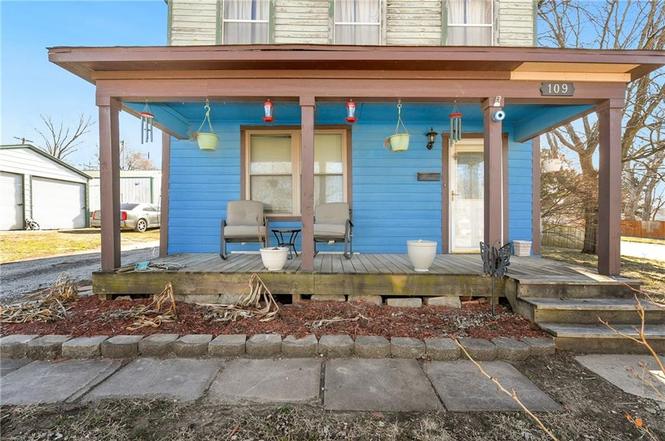
109 W Miami St NE · Paola, KS
Flood risk 1/10 · Minimal
- FEMA flood zone
- X (unshaded)
- Chance of flooding over 30 yrs
- 0.0%
- Est. flood insurance / yr
- $507 – $1,088
Fire risk 3/10 · Minor
- Est. fire insurance / yr
- $1,154 – $2,142
Heat risk 5/10 · Moderate
- Hot days now (above 108°F)
- 7 days/yr
- Hot days in 30 yrs
- 17 days/yr
Wind risk 2/10 · Minimal
- Chance of severe wind over 30 yrs
- —
Air-quality risk 2/10 · Minimal
- Unhealthy air days now
- 1 days/yr
- Unhealthy air days in 30 yrs
- 1 days/yr
Risk factors via First Street. Map © Google.
Why this score? — see what drove the C grade
The composite is a weighted blend of 9 inputs, each scored 0–100. Each bar is that input's sub-score; the figure is the points it added to the 100-point composite (weight × sub-score).
- Cash flow +24.8/30.0
- DSCR +8.0/10.0
- ARV discount +7.5/15.0
- 1% rule +6.7/10.0
- Livability +3.5/5.0
- Schools +3.3/10.0
- Rent growth +2.5/5.0
- Condition / age +2.5/5.0
- Appreciation +0.0/10.0
$125,000
🖨 Deal sheet (PDF) 📄 Offer letter ✓ Due diligence
Listing remarks
S H O R T S A L E _ O p p o r t u n i t y ! ! ! This spacious 1.5-story home features 4 bedrooms and 2 baths and is priced to sell. Located just one block from the square, it sits in the heart of Paola. The main level includes the laundry room, the primary bedroom and full bathroom. Upstairs you'll find three secondary bedrooms and an additional full bathroom. Enjoy plenty of off-street parking thanks to the pass-through driveway. The stove hookup is electric. The extra-large fenced backyard includes a shed and a clubhouse. Attractive brick hardscaping accents the patio and front sidewalks. The roof is approximately 10 years old, the HVAC system is about 12 years old, and the water heater i
Key facts
- Clubhouse
- Laundry room
- Brick hardscaping
Tags
Property features AI
Finance
- Other: Listing age description: 101 years or more
- HOA & community: No maintenance provided (per listing)
Exterior
- Parking: Other parking (unspecified)
- Utilities: Public water; Public sewer
- Home design: Single-family residence; Residential property; 1.5-story floor plan; Above-grade living area reported (public records)
- Construction: Wood siding exterior; Composition roof
- Exterior features: Wood fencing; Property not in a flood plain; Lot approximately 6,985 square feet
Interior
- Kitchen: Laminate counters; Linoleum flooring; Dishwasher included
- Bedrooms: 4 bedrooms total — two on the main level and two on the second level; At least one bedroom with walk-in closet
- Flooring: Wood floors in primary living areas and some bedrooms; Carpet in other bedrooms; Linoleum in kitchen and at least one bathroom
- Bathrooms: 2 full bathrooms; Main-level bathroom with built-in features, laminate counters and shower-over-tub; Second-level bathroom with tub only
- Heating & cooling: Heat pump for heating and cooling; Central cooling
- Interior features: Ceiling fans in living room, dining room and bedrooms; Wood floors in living room, dining room and two bedrooms; Carpet in some bedrooms; Crawl space basement
- Laundry & utility: Laundry on the main level
Neighborhood map
What this means for you Summary
Snapshot
- This is a 3-bed/2.0-bath single-family listed at $125k.
Deal economics
- At list price, monthly cash flow is $265 ($3k/yr) — positive.
- The deal already cash-flows at list — no discount required.
- Meets the 1% rule at list price ($1k rent vs $125k).
- Recommended offer: $114k (9.0% below list) — sets the bar for market timing.
- Cap rate 8.8% vs local median 2.1% in Paola — top-decile yield for the area; either an underpriced asset or a hidden risk that comps aren't pricing in. Stress-test before assuming the spread holds.
Location & tenants
- Location reads 69/100 on livability (#178 in KS) — a middle-class / working-renter tenant base. Strengths: cost of living A+, housing A+, crime A-; Watch: health & safety C-, amenities F, commute F.
- Paola (town): math 38% / reading 37% proficiency, ranked #40 of 169 in KS (top 24%) — families likely to look elsewhere, expect single-tenant / working-renter base with shorter leases.
- Zoned schools: Sunflower Elem (math 52% / reading 49%, grade D+, #160 of 684 statewide, top 23%, 403 students, 38% FRL); Paola Middle (math 34% / reading 31%, grade F, #57 of 219 statewide, top 26%, 430 students, 33% FRL); Paola High (math 12% / reading 22%, grade F, #235 of 327 statewide, top 74%, 558 students, 29% FRL) — zoned schools at 33% FRL track the district average.
- Market conditions: 130 active listings in the ZIP; 1 comparable units currently listed for rent nearby; 100 units permitted in Miami County in 2024 (0 in 5+ unit buildings).
Forward outlook
- Local home prices are declining (-3.0%/yr); year-one equity from $864 of loan paydown is wiped out by about $4k of value loss. Plan a longer hold.
- Miami County population projected at -15% by 2050 — secular population decline; favor cash flow + early exit over multi-decade hold.
Negotiation context
- It's been on market 105 days — a 9% lower offer ($114k) is reasonable based on typical stale-listing flexibility.
- 2 sale attempts; this cycle's ask has dropped $25k (17%) from the opening price — seller is motivated, your offer sets the floor, not the list.
Risks & watch-outs
- Watch-outs: built in 1915 — expect roof / HVAC / electrical / plumbing capex.
- Climate carrying-cost: extreme-heat days projected 7→17/yr by 2055 (HVAC capex compounding) — expect insurance premiums to compound above CPI over the hold.
Questions for the listing agent
- It's been on market 105 days. Have you received any prior offers? Is the seller open to a 9% concession, seller financing, or rate buy-down credit?
- Built in 1915 — when were the roof, HVAC, electrical panel, plumbing, and water heater last replaced?
- Why hasn't it sold? Are there any deal-killer items the seller is aware of (foundation, flood, title, zoning, code violations)?
- Is there a deadline driving the sale (1031 exchange, divorce, estate, relocation)? That informs how much negotiation room exists.
- What's the average days-on-market for RENTAL listings here right now (not sales)? A rising rental-DOM trend means longer vacancies and softer asking-rent achievability than the comps imply.
- What's the recent tenant-quality profile in this submarket — average credit score on applications, eviction rate, late-payment / NSF rate, and stable-employment percentage? A property-management company in the area should have these aggregated.
- How much new for-sale + rental construction is in the pipeline within 1–3 miles? Heavy new supply typically softens prices + rents 12–24 months out; constrained supply supports both.
Investment metrics
- 1% rule
- 1.17% ✓
- Cap rate
- 8.84%
- Cash-on-cash
- 9.09%
- DSCR
- 1.40
- GRM
- 7.1
CMA / ARV
- ARV (on-the-fly)
- $274,688
- Comps found
- 12
Show comp detail 12 sales within ~0.75 mi
| Address | Dist | Beds/Ba | Sqft | Sold | Price | $/sf | Match |
|---|---|---|---|---|---|---|---|
| 309 W Piankishaw St | 0.23mi | 3/2.0 | 1,772 (-4%) | 1mo | $249,900 | $141 | 81 |
| 308 E Ottawa St | 0.39mi | 4/2.0 (+1) | 1,920 (+3%) | 2mo | $250,000 | $130 | 69 |
| 403 W Peoria St | 0.21mi | 3/2.5 | 1,639 (-12%) | 2mo | $279,000 | $170 | 67 |
| 2 E Virginia St | 0.32mi | 4/3.0 (+1) | 1,864 (+0%) | 11mo | $275,000 | $148 | 66 |
| 301 S Castle St | 0.53mi | 4/2.0 (+1) | 1,740 (-6%) | 1mo | $250,000 | $144 | 59 |
| 101 S 5th St | 0.40mi | 4/2.0 (+1) | 2,027 (+9%) | 8mo | $275,000 | $136 | 55 |
| 407 S Paola St | 0.67mi | 3/2.0 | 1,809 (-2%) | 12mo | $394,900 | $218 | 54 |
| 715 S Silver St | 0.38mi | 3/1.0 | 1,610 (-13%) | 5mo | $260,000 | $161 | 52 |
| 506 N Walnut St | 0.56mi | 2/1.0 (-1) | 1,738 (-6%) | 4mo | $208,400 | $120 | 51 |
| 503 E Ottawa St | 0.51mi | 3/3.0 | 1,656 (-11%) | 6mo | $267,000 | $161 | 50 |
| 507 N Pearl St | 0.53mi | 4/1.5 (+1) | 2,036 (+10%) | 5mo | $264,000 | $130 | 48 |
| 606 E Miami St | 0.54mi | 3/1.5 | 1,588 (-14%) | 4mo | $299,000 | $188 | 45 |
Match score weights: distance 35% · size 25% · config 20% · recency 20%. Top-matched comps best support the ARV.
Projected returns pro-forma
-3.0% appreciation · 3.0% rent growth · sell at horizon
- IRR
- -2.5%
- Equity multiple
- 0.90×
- Total profit
- $-3,333
- Equity at exit
- $18,638
- IRR
- 7.2%
- Equity multiple
- 1.54×
- Total profit
- $19,002
- Equity at exit
- $10,808
Cash invested: $35,000 (down + closing). Projections, not guarantees.
Landlord ↔ Tenant lean methodology
- Overall (STATE)
- 83 Strongly Landlord-Friendly
- State Kansas
- 83 Strongly Landlord-Friendly · R+10
- County
- — inherits STATE
- City
- — inherits STATE
ZIP-level market 66071
- Home prices YoY
- -29.0%
- Active inventory
- 130
- Price-to-rent
- 7.1×
Monthly cashflow live
- Estimated rent
- $1,468 medium interval (Pro) →
- Mortgage (P&I)
- −$656
- Tax from tax record
- −$187 /mo · $2,240/yr
- Insurance
- −$52
- HOA
- −$0
- Vacancy / Maint / Mgmt
- −$308
- Net cashflow
- $265
Break-even live
Sensitivity live
| Price | -10% $336 | -5% $300 | +0% $265 | +5% $230 | +10% $194 |
|---|---|---|---|---|---|
| Rent | -10% $149 | -5% $207 | +0% $265 | +5% $323 | +10% $381 |
| Rate | -1.0pp $328 | -0.5pp $297 | base $265 | +0.5pp $233 | +1.0pp $200 |
UW: 25.0% down · 7.5% · 30yr · 1.5% tax · 5.0% vac · 8.0% maint · 8.0% mgmt
Financing live
Cash to close
- Down payment
- $31,250
- Closing costs
- $3,750
- Reserves months
- —
- Total cash needed
- —
Loan-product check · same deal, 3 products live
Conventional
25% down · 7.5% · 30yr
- Down + closing
- —
- Monthly P&I
- —
- Monthly cashflow
- —
- DSCR
- —
- Eligible?
- —
Personal DTI + credit; lowest rate.
DSCR
20% down · 8.5% · 30yr
- Down + closing
- —
- Monthly P&I
- —
- Monthly cashflow
- —
- DSCR
- —
- Eligible?
- —
No personal income docs; deal must DSCR.
Hard money
10% down · 12.0% · 12mo
- Down + closing
- —
- Monthly P&I
- —
- Monthly cashflow
- —
- DSCR
- —
- Eligible?
- —
Short-term bridge; refi at stabilization.
Rent comps 1 comps
| Address | Beds | Baths | Sqft | Rent | $/sqft | DOM | Units | Dist |
|---|---|---|---|---|---|---|---|---|
| 900 Prairie St Paola, KS | 2.0–4.0 | 2.0–4.0 | 1672 | $1,468 | $0.88 | 3d | 1 | 0.99mi |
Listing history 17 events
-
2026-06-16status $125,000 Pending 105 DOM
-
2026-06-15days on market $125,000 Active 105 DOM
-
2026-06-13days on market $125,000 Active 103 DOM
-
2026-06-13days on market $125,000 Active 102 DOM
-
2026-06-09days on market $125,000 Active 99 DOM
-
2026-06-08days on market $125,000 Active 98 DOM
-
2026-06-07days on market $125,000 Active 97 DOM
-
2026-06-05days on market $125,000 Active 94 DOM
-
2026-06-03days on market $125,000 Active 93 DOM
-
2026-06-02days on market $125,000 Active 92 DOM
-
2026-06-01days on market $125,000 Active 91 DOM
-
2026-05-31days on market $125,000 Active 90 DOM
-
2026-05-18status Active
-
2026-05-12status Pending
-
2026-04-06price $125,000
-
2026-03-18price $135,000
-
2026-02-24$150,000 Active
ⓘ Source: listings_history table (triggers on properties + properties_extension) + one-shot
backfill from property_details.listing_events for pre-trigger history.
Tax reassessment forecast KS · Resets to sale price
- Current annual tax
- $2,240 · $187/mo
- Projected year-2 tax
- $2,240 · $187/mo
- Expected delta
- $0/yr ($0/mo · 0.0%)
ⓘ Screening estimate from a state-policy table — verify with the county assessor before closing.
Climate risk First Street
- Flood 1/10 Low FEMA zone X (unshaded) · 0% chance over 30 yrs
- Wildfire 3/10 Moderate
- Heat 5/10 Major 7 d/yr ≥108°F today · 17 d/yr by 30 yrs out
- Wind 2/10 Low
- Air quality 2/10 Low 1 unhealthy d/yr today · 1 by 30 yrs out
Nearby sold comps map
Loading sold comps map…
Walkable amenities ~0.75 mi
Loading nearby amenities…
Taxation est. · year 1
- Rental income
- $17,610
- − Mortgage interest
- −$7,002
- − Property taxes
- −$2,240
- − Insurance
- −$625
- − Repairs & maintenance
- −$1,409
- − Management
- −$1,409
- − Depreciation
- −$3,636
- Taxable income
- $1,289
- Est. tax owed @ 24.0%
- −$309
- After-tax cash flow
- $2,871/yr
For passive investors: Depreciation is non-cash, so a rental often shows a tax loss while cash-flowing — sheltering income. Rental losses are passive: they offset passive income freely, and up to $25,000/yr can offset ordinary (W-2) income if you actively participate and your MAGI is under $100k (phasing out to $0 by $150k); unused losses carry forward. On sale, claimed depreciation is recaptured at up to 25%, and gains may owe capital-gains tax (a 1031 exchange can defer both). Figures are a year-1 estimate at your 24.0% rate — not tax advice; consult a CPA.
Schools (NCES district)
- District
- Paola
- NCES district ID
- 2010500
- Math proficiency
- 38% ▲ 3.00%
- Reading proficiency
- 37% ▲ 1.00%
- Median HH income
- $60,779
- Composite
- 33.47/100
- National rank
- #5451
- State rank
- #40 of 169 in KS
Livability — Paola
- Score
- 69/100
- State rank
- #178
- US rank
- #8183
Category grades
Schools grade is shown separately in the Schools card above.
Census & demographics
- Census place
- Paola, KS
- City population
- 12,425
- Population (ZIP)
- 12,425
Population outlook (Miami County) Hauer SSP2
- Today (2025)
- 32,162 people
- By 2030
- 31,472 · -2.1%
- By 2040
- 29,611 · -7.9%
- By 2050
- 27,277 · -15.2%
- By 2075
- 22,738 · -29.3%
- By 2100
- 18,479 · -42.5%
Race, ethnicity, and origin ACS 2023
- Neighborhood character
- Predominantly White (94%)
- Race & ethnicity
- White 94% Two or more races 3% Hispanic / Latino 2%
- Common ancestry
- Slovak 3% Romanian 3% Portuguese 1%
- Foreign-born
- 1%
- Languages at home
- 99% English-only · Spanish 1%
Political lean MEDSL · Miami
- 2024 margin
- Solid R (+39.5) · D 29.3% · R 68.8% · Other 1.9%
- 2008→2024 swing
- -15.8pp toward R · 2008: -23.7pp · 2024: -39.5pp
- All cycles
- 2024: R+39.5 2020: R+39.6 2016: R+40.0 2012: R+34.8 2008: R+23.7
Not yet ingested
- Civics
- —
Market trends
- HPI YoY
- ▼ -118.52%
- Current HPI
- 290.4685
- Rent YoY
- —
- Metro
- —
- State GDP YoY
- —
- F500 in state
- 0
Price history
-16.7% since first listed5 events — show timeline
- 2026-05-18 Relisted — Heartland MLS as Distributed by MLS Grid
- 2026-05-12 Pending — Heartland MLS as Distributed by MLS Grid
- 2026-04-06 Price Changed $125,000 Heartland MLS as Distributed by MLS Grid
- 2026-03-18 Price Changed $135,000 Heartland MLS as Distributed by MLS Grid
- 2026-02-24 Listed $150,000 Heartland MLS as Distributed by MLS Grid
Property tax history
+3.9%/yrLatest (2025): $2,240 · +1.6% YoY. Source: county tax records.
Cash-flow waterfall
monthlySold comps — $/sqft
last 12 mo · ≤1 miLoading sold comps…