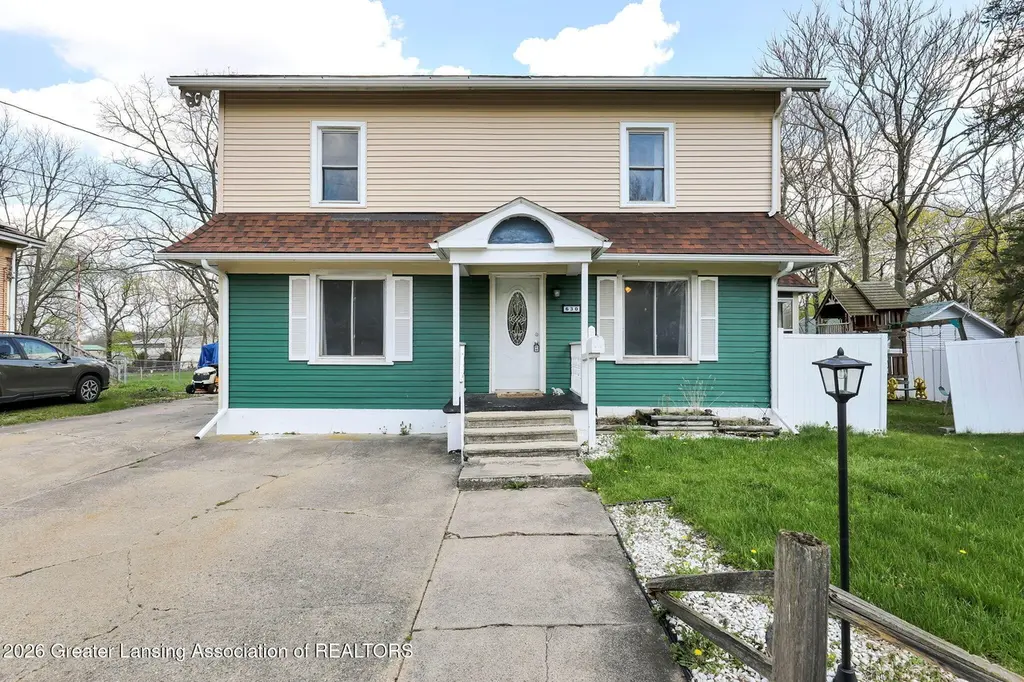
630 N Cochran Ave · Charlotte, MI
Flood risk 1/10 · Minimal
- FEMA flood zone
- X (unshaded)
- Chance of flooding over 30 yrs
- 0.0%
- Est. flood insurance / yr
- $473 – $860
Fire risk 1/10 · Minimal
- Est. fire insurance / yr
- $784 – $1,456
Heat risk 2/10 · Minimal
- Hot days now (above 96°F)
- 7 days/yr
- Hot days in 30 yrs
- 16 days/yr
Wind risk 2/10 · Minimal
- Chance of severe wind over 30 yrs
- —
Air-quality risk 2/10 · Minimal
- Unhealthy air days now
- 1 days/yr
- Unhealthy air days in 30 yrs
- 2 days/yr
Risk factors via First Street. Map © Google.
Why this score? — see what drove the D grade
The composite is a weighted blend of 9 inputs, each scored 0–100. Each bar is that input's sub-score; the figure is the points it added to the 100-point composite (weight × sub-score).
- ARV discount +11.8/15.0
- Cash flow +10.1/30.0
- Livability +3.7/5.0
- 1% rule +3.6/10.0
- Schools +3.1/10.0
- DSCR +2.9/10.0
- Rent growth +2.5/5.0
- Condition / age +2.5/5.0
- Appreciation +0.0/10.0
$162,500
🖨 Deal sheet (PDF) 📄 Offer letter ✓ Due diligence
Listing remarks MLS
Convenient location close to shopping, restaurants and schools with this 4 bedroom home. Main floor features a large living room, dining room, kitchen with slider to access the deck, full bathroom, laundry, bedroom or office, 3 seasons room. The 2nd floor features 3 bedrooms. Large back yard, play set, deck. Immediate occupancy at closing. Room sizes, square feet and year built may not be exact. Buyer to verify all information.
Key facts
- 0.4 acre lot
- Built 1900
- Listed 53 days
Property features AI
Exterior
- Parking: Driveway
- Utilities: Public sewer
- Home design: Two-story home; Built in 1900; City street frontage
- Construction: Vinyl and wood siding; Shingle roof
- Exterior features: Back yard; Deck; Shed(s)
Interior
- Kitchen: Kitchen (approx. 18 x 10); Includes Dishwasher, Range, Refrigerator
- Bedrooms: 4 bedrooms (Primary bedroom approx. 13.9 x 10; other bedrooms approx. 13 x 8; 13.8 x 9; 11 x 7.9)
- Bathrooms: 1 full bathroom
- Heating & cooling: Forced air heating; Window unit cooling
- Interior features: Full basement; Dishwasher, Range, Refrigerator
- Laundry & utility: Main level laundry
Neighborhood map
What this means for you Summary
Snapshot
- This is a 4-bed/1.0-bath single-family listed at $162k.
Deal economics
- At list price, monthly cash flow is $-94 ($-1k/yr) — negative.
- To cash-flow at today's rent, offer at most $146k (10.2% below list).
- To meet the 1% rule (rent ≥ 1% of price), the offer needs to be $140k (13.8% below list).
- Recommended offer: $140k (13.8% below list) — sets the bar for 1% rule.
- Cap rate 5.6% vs local median 3.9% in Charlotte — top-decile yield for the area; either an underpriced asset or a hidden risk that comps aren't pricing in. Stress-test before assuming the spread holds.
Location & tenants
- Location reads 73/100 on livability (#219 in MI) — a middle-class / working-renter tenant base. Strengths: cost of living A+, housing A+, health & safety A+; Watch: employment C-, crime D, amenities F.
- Charlotte Public Schools (town): math 31% / reading 40% proficiency, ranked #261 of 540 in MI (top 48%) — families likely to look elsewhere, expect single-tenant / working-renter base with shorter leases.
- Zoned schools: Parkview Elementary School (math 52% / reading 47%, grade D, #382 of 1,397 statewide, top 30%, 319 students, 49% FRL); Charlotte Upper Elementary School (math 31% / reading 39%, grade F, #283 of 493 statewide, top 58%, 573 students, 46% FRL); Charlotte Senior High School (math 22% / reading 57%, grade F, #304 of 713 statewide, top 46%, 698 students, 35% FRL).
- Market conditions: 98 active listings in the ZIP; 1 comparable units currently listed for rent nearby; 98 units permitted in Eaton County in 2024 (0 in 5+ unit buildings).
Forward outlook
- Local home prices are declining (-3.0%/yr); year-one equity from $1k of loan paydown is wiped out by about $5k of value loss. Plan a longer hold.
- Eaton County population projected to shrink 5% by 2050 — rents likely to lag national; underwrite the cash flow, not the appreciation.
Negotiation context
- It's been on market 53 days — a 3% lower offer ($158k) is reasonable based on typical stale-listing flexibility.
- 18 sale attempts since 18y ago; this cycle's ask has dropped $12k (7%) from the opening price — seller is motivated, your offer sets the floor, not the list.
- Current owner paid $132k; 23% above their basis — modest negotiation headroom, anchor on the comps not their cost.
Risks & watch-outs
- Watch-outs: built in 1900 — expect roof / HVAC / electrical / plumbing capex.
Questions for the listing agent
- What do current leases actually rent for vs. the listed asking? Can we see a recent rent roll and the last 12 months of T-12 income?
- It's been on market 53 days. Have you received any prior offers? Is the seller open to a 14% concession, seller financing, or rate buy-down credit?
- Built in 1900 — when were the roof, HVAC, electrical panel, plumbing, and water heater last replaced?
- Is there a deadline driving the sale (1031 exchange, divorce, estate, relocation)? That informs how much negotiation room exists.
- Crime grade is D in this area — have there been break-ins, vandalism, or insurance claims at this property in the last 3 years? What carrier currently insures it and at what premium?
- The area grade is low — what's the realistic commute time and amenity access for the typical tenant pool here? Any planned neighborhood developments (good or bad) we should know about?
- What's the average days-on-market for RENTAL listings here right now (not sales)? A rising rental-DOM trend means longer vacancies and softer asking-rent achievability than the comps imply.
- What's the recent tenant-quality profile in this submarket — average credit score on applications, eviction rate, late-payment / NSF rate, and stable-employment percentage? A property-management company in the area should have these aggregated.
- How much new for-sale + rental construction is in the pipeline within 1–3 miles? Heavy new supply typically softens prices + rents 12–24 months out; constrained supply supports both.
Investment metrics
- 1% rule
- 0.86% ✗
- Cap rate
- 5.60%
- Cash-on-cash
- -2.48%
- DSCR
- 0.89
- GRM
- 9.7
CMA / ARV
- ARV (median comp)
- $179,848
- List price
- $162,500
- Delta
- -9.65%
- Verdict
- FAIR
- Comps
- 20 within 1.0 mi
Show comp detail 12 sales within ~0.75 mi
| Address | Dist | Beds/Ba | Sqft | Sold | Price | $/sf | Match |
|---|---|---|---|---|---|---|---|
| 724 High St | 0.41mi | 4/1.5 | 1,754 (-3%) | 5mo | $252,500 | $144 | 70 |
| 735 N Cochran Ave | 0.17mi | 3/2.0 (-1) | 1,620 (-11%) | 4mo | $215,000 | $133 | 62 |
| 311 N Bostwick St | 0.40mi | 3/2.0 (-1) | 1,734 (-4%) | 9mo | $206,000 | $119 | 58 |
| 309 W Harris St | 0.57mi | 4/1.0 | 1,914 (+6%) | 8mo | $159,900 | $84 | 57 |
| 211 W Stoddard St | 0.44mi | 3/1.5 (-1) | 1,690 (-7%) | 10mo | $118,000 | $70 | 53 |
| 921 Forest St. St | 0.51mi | 3/1.0 (-1) | 1,701 (-6%) | 10mo | $192,000 | $113 | 52 |
| 519 Amity St | 0.34mi | 3/1.0 (-1) | 1,566 (-14%) | 8mo | $195,000 | $125 | 50 |
| 922 High St | 0.47mi | 3/2.0 (-1) | 1,640 (-10%) | 7mo | $310,000 | $189 | 48 |
| 609 W Harris St | 0.70mi | 3/1.0 (-1) | 1,898 (+5%) | 9mo | $191,000 | $101 | 47 |
| 621 Dellinger Dr | 0.61mi | 3/2.5 (-1) | 1,737 (-4%) | 11mo | $333,100 | $192 | 45 |
| 703 Oakwood Dr | 0.59mi | 3/2.5 (-1) | 1,737 (-4%) | 12mo | $330,000 | $190 | 45 |
| 605 Beech St | 0.60mi | 3/2.5 (-1) | 1,555 (-14%) | 12mo | $250,000 | $161 | 27 |
Match score weights: distance 35% · size 25% · config 20% · recency 20%. Top-matched comps best support the ARV.
Projected returns pro-forma
-3.0% appreciation · 3.0% rent growth · sell at horizon
- IRR
- -20.4%
- Equity multiple
- 0.29×
- Total profit
- $-32,242
- Equity at exit
- $24,229
- IRR
- -13.4%
- Equity multiple
- 0.22×
- Total profit
- $-35,496
- Equity at exit
- $14,050
Cash invested: $45,500 (down + closing). Projections, not guarantees.
Landlord ↔ Tenant lean methodology
- Overall (STATE)
- 62 Landlord-Friendly
- State Michigan
- 62 Landlord-Friendly · EVEN
- County
- — inherits STATE
- City
- — inherits STATE
ZIP-level market 48813
- Active inventory
- 98
- Price-to-rent
- 9.7×
Monthly cashflow live
- Estimated rent
- $1,400 medium interval (Pro) →
- Mortgage (P&I)
- −$852
- Tax from tax record
- −$280 /mo · $3,360/yr
- Insurance
- −$68
- HOA
- −$0
- Vacancy / Maint / Mgmt
- −$294
- Net cashflow
- $-94
Break-even live
Sensitivity live
| Price | -10% $-2 | -5% $-48 | +0% $-94 | +5% $-140 | +10% $-186 |
|---|---|---|---|---|---|
| Rent | -10% $-204 | -5% $-149 | +0% $-94 | +5% $-39 | +10% $17 |
| Rate | -1.0pp $-12 | -0.5pp $-53 | base $-94 | +0.5pp $-136 | +1.0pp $-179 |
UW: 25.0% down · 7.5% · 30yr · 1.5% tax · 5.0% vac · 8.0% maint · 8.0% mgmt
Financing live
Cash to close
- Down payment
- $40,625
- Closing costs
- $4,875
- Reserves months
- —
- Total cash needed
- —
Loan-product check · same deal, 3 products live
Conventional
25% down · 7.5% · 30yr
- Down + closing
- —
- Monthly P&I
- —
- Monthly cashflow
- —
- DSCR
- —
- Eligible?
- —
Personal DTI + credit; lowest rate.
DSCR
20% down · 8.5% · 30yr
- Down + closing
- —
- Monthly P&I
- —
- Monthly cashflow
- —
- DSCR
- —
- Eligible?
- —
No personal income docs; deal must DSCR.
Hard money
10% down · 12.0% · 12mo
- Down + closing
- —
- Monthly P&I
- —
- Monthly cashflow
- —
- DSCR
- —
- Eligible?
- —
Short-term bridge; refi at stabilization.
Rent comps 1 comps
| Address | Beds | Baths | Sqft | Rent | $/sqft | DOM | Units | Dist |
|---|---|---|---|---|---|---|---|---|
| 402 S Cochran Ave Charlotte, MI | 3.0 | 1.0 | 1280 | $1,400 | $1.09 | 15d | 1 | 1.00mi |
Listing history 50 events
-
2026-06-21days on market $162,500 Active 53 DOM
-
2026-06-18days on market $162,500 Active 50 DOM
-
2026-06-17days on market $162,500 Active 49 DOM
-
2026-06-16pricedays on market $162,500 Active 48 DOM
Show marketing remark (431 chars)
Convenient location close to shopping, restaurants and schools with this 4 bedroom home. Main floor features a large living room, dining room, kitchen with slider to access the deck, full bathroom, laundry, bedroom or office, 3 seasons room. The 2nd floor features 3 bedrooms. Large back yard, play set, deck. Immediate occupancy at closing. Room sizes, square feet and year built may not be exact. Buyer to verify all information.
-
2026-06-15days on market $175,000 Active 47 DOM
-
2026-06-14days on market $175,000 Active 45 DOM
-
2026-06-13days on market $175,000 Active 44 DOM
-
2026-06-10days on market $175,000 Active 42 DOM
-
2026-06-09days on market $175,000 Active 41 DOM
-
2026-06-08days on market $175,000 Active 40 DOM
-
2026-06-07days on market $175,000 Active 39 DOM
-
2026-06-05days on market $175,000 Active 36 DOM
-
2026-06-03days on market $175,000 Active 35 DOM
-
2026-06-02days on market $175,000 Active 34 DOM
-
2026-06-01days on market $175,000 Active 33 DOM
-
2026-05-31days on market $175,000 Active 32 DOM
-
2026-05-30days on market $175,000 Active 31 DOM
-
2026-05-15status Active 431-char remark
Show marketing remark (431 chars)
Convenient location close to shopping, restaurants and schools with this 4 bedroom home. Main floor features a large living room, dining room, kitchen with slider to access the deck, full bathroom, laundry, bedroom or office, 3 seasons room. The 2nd floor features 3 bedrooms. Large back yard, play set, deck. Immediate occupancy at closing. Room sizes, square feet and year built may not be exact. Buyer to verify all information.
-
2026-05-15status Active 433-char remark
Show marketing remark (431 chars)
Convenient location close to shopping, restaurants and schools with this 4 bedroom home. Main floor features a large living room, dining room, kitchen with slider to access the deck, full bathroom, laundry, bedroom or office, 3 seasons room. The 2nd floor features 3 bedrooms. Large back yard, play set, deck. Immediate occupancy at closing. Room sizes, square feet and year built may not be exact. Buyer to verify all information.
-
2026-05-04historical Active Under Contract 431-char remark
Show marketing remark (431 chars)
Convenient location close to shopping, restaurants and schools with this 4 bedroom home. Main floor features a large living room, dining room, kitchen with slider to access the deck, full bathroom, laundry, bedroom or office, 3 seasons room. The 2nd floor features 3 bedrooms. Large back yard, play set, deck. Immediate occupancy at closing. Room sizes, square feet and year built may not be exact. Buyer to verify all information.
-
2026-05-04historical Active Under Contract 433-char remark
Show marketing remark (431 chars)
Convenient location close to shopping, restaurants and schools with this 4 bedroom home. Main floor features a large living room, dining room, kitchen with slider to access the deck, full bathroom, laundry, bedroom or office, 3 seasons room. The 2nd floor features 3 bedrooms. Large back yard, play set, deck. Immediate occupancy at closing. Room sizes, square feet and year built may not be exact. Buyer to verify all information.
-
2026-04-29$175,000 Active 431-char remark
Show marketing remark (431 chars)
Convenient location close to shopping, restaurants and schools with this 4 bedroom home. Main floor features a large living room, dining room, kitchen with slider to access the deck, full bathroom, laundry, bedroom or office, 3 seasons room. The 2nd floor features 3 bedrooms. Large back yard, play set, deck. Immediate occupancy at closing. Room sizes, square feet and year built may not be exact. Buyer to verify all information.
-
2026-04-29$175,000 Active 433-char remark
Show marketing remark (431 chars)
Convenient location close to shopping, restaurants and schools with this 4 bedroom home. Main floor features a large living room, dining room, kitchen with slider to access the deck, full bathroom, laundry, bedroom or office, 3 seasons room. The 2nd floor features 3 bedrooms. Large back yard, play set, deck. Immediate occupancy at closing. Room sizes, square feet and year built may not be exact. Buyer to verify all information.
-
2021-04-30soldstatus $132,000
-
2021-01-30historical
-
2020-11-16historical
-
2020-11-06historical Accepting Backup Offers
-
2020-10-30historical
-
2020-10-30$139,900
-
2020-10-30$139,900 Active
-
2020-10-30historical
-
2020-10-27status Active
-
2020-10-23historical Accepting Backup Offers
-
2020-10-01historical
-
2020-09-30$139,900 Active
-
2020-09-30$139,900
-
2020-09-30historical
-
2020-09-24price $139,900
-
2020-09-17$145,000 Active
-
2020-09-17$139,900
-
2020-09-08historical
-
2020-09-08historical
-
2020-09-03price $145,000
-
2020-08-14$149,999 Active
-
2020-08-14$145,000
-
2017-12-05soldstatus $85,000
-
2017-12-01soldstatus $85,000
-
2017-12-01soldstatus $85,000
-
2017-09-18$89,900
-
2017-09-18$89,900
ⓘ Source: listings_history table (triggers on properties + properties_extension) + one-shot
backfill from property_details.listing_events for pre-trigger history.
Tax reassessment forecast MI · Partial reset (capped growth)
- Current annual tax
- $3,360 · $280/mo
- Projected year-2 tax
- $3,360 · $280/mo
- Expected delta
- $0/yr ($0/mo · 0.0%)
ⓘ Screening estimate from a state-policy table — verify with the county assessor before closing.
Climate risk First Street
- Flood 1/10 Low FEMA zone X (unshaded) · 0% chance over 30 yrs
- Wildfire 1/10 Low
- Heat 2/10 Low 7 d/yr ≥96°F today · 16 d/yr by 30 yrs out
- Wind 2/10 Low
- Air quality 2/10 Low 1 unhealthy d/yr today · 2 by 30 yrs out
Nearby sold comps map
Loading sold comps map…
Walkable amenities ~0.75 mi
Loading nearby amenities…
Taxation est. · year 1
- Rental income
- $16,800
- − Mortgage interest
- −$9,103
- − Property taxes
- −$3,360
- − Insurance
- −$812
- − Repairs & maintenance
- −$1,344
- − Management
- −$1,344
- − Depreciation
- −$4,727
- Taxable loss
- −$3,890
- Est. tax savings @ 24.0%
- +$934
- After-tax cash flow
- $-193/yr
For passive investors: Depreciation is non-cash, so a rental often shows a tax loss while cash-flowing — sheltering income. Rental losses are passive: they offset passive income freely, and up to $25,000/yr can offset ordinary (W-2) income if you actively participate and your MAGI is under $100k (phasing out to $0 by $150k); unused losses carry forward. On sale, claimed depreciation is recaptured at up to 25%, and gains may owe capital-gains tax (a 1031 exchange can defer both). Figures are a year-1 estimate at your 24.0% rate — not tax advice; consult a CPA.
Schools (NCES district)
- District
- Charlotte Public Schools
- NCES district ID
- 2608770
- Math proficiency
- 31% ▼ -9.00%
- Reading proficiency
- 40% ▼ -7.00%
- Median HH income
- $54,722
- Composite
- 31.18/100
- National rank
- #6048
- State rank
- #261 of 540 in MI
Livability — Charlotte
- Score
- 73/100
- State rank
- #219
- US rank
- #5414
Category grades
Schools grade is shown separately in the Schools card above.
Census & demographics
- Census place
- Charlotte, MI
- City population
- 20,263
- Population (ZIP)
- 20,263
Population outlook (Eaton County) Hauer SSP2
- Today (2025)
- 110,811 people
- By 2030
- 110,598 · -0.2%
- By 2040
- 108,304 · -2.3%
- By 2050
- 104,961 · -5.3%
- By 2075
- 97,197 · -12.3%
- By 2100
- 85,150 · -23.2%
Race, ethnicity, and origin ACS 2023
- Neighborhood character
- Predominantly White (89%)
- Race & ethnicity
- White 89% Two or more races 6% Hispanic / Latino 5% Black 1%
- Common ancestry
- Romanian 5% Lithuanian 3% Iranian 3%
- Foreign-born
- 1% · Canada
- Languages at home
- 96% English-only · Spanish 1% German/W. Germanic 1%
Political lean MEDSL · Eaton
- 2024 margin
- Toss-up / Even · D 47.6% · R 50.8% · Other 1.6%
- 2008→2024 swing
- -11.6pp toward R · 2008: 8.4pp · 2024: -3.1pp
- All cycles
- 2024: R+3.1 2020: R+0.8 2016: R+5.5 2012: D+3.1 2008: D+8.4
Not yet ingested
- Civics
- —
Market trends
- HPI YoY
- ▼ -194.48%
- Current HPI
- 183.0171
- Rent YoY
- —
- Metro
- —
- State GDP YoY
- ▲ 1.37%
- F500 in state
- 28
Industry mix (Fortune 500 HQ in MI)
| Industry | F500 HQs | Revenue |
|---|---|---|
| Automotive Parts | 3 | $48B |
|
||
| Automotive | 2 | $372B |
|
||
| Chemicals | 1 | $45B |
|
||
| Automotive Retail | 1 | $29B |
|
||
| Healthcare / Medical Devices | 1 | $23B |
|
||
| Automotive Technology | 1 | $20B |
|
||
Price history
+110.5% since first listed43 events — show timeline
- 2026-06-16 Price Changed $162,500 REALCOMP
- 2026-06-16 Price Changed $162,500 Greater Lansing AoR
- 2026-05-15 Relisted — REALCOMP
- 2026-05-15 Relisted — Greater Lansing AoR
- 2026-05-04 Contingent — REALCOMP
- 2026-05-04 Contingent — Greater Lansing AoR
- 2026-04-29 Listed $175,000 REALCOMP
- 2026-04-29 Listed $175,000 Greater Lansing AoR
- 2021-04-30 Sold (Public Records) $132,000 Public Records
- 2021-01-30 Listing Removed — Greater Lansing AoR
- 2020-11-16 Listing Removed — REALCOMP
- 2020-11-06 Contingent — REALCOMP
- 2020-10-30 Listing Removed — REALCOMP
- 2020-10-30 Listing Removed — Greater Lansing AoR
- 2020-10-30 Listed $139,900 REALCOMP
- 2020-10-30 Listed $139,900 Greater Lansing AoR
- 2020-10-27 Relisted — REALCOMP
- 2020-10-23 Contingent — REALCOMP
- 2020-10-01 Listing Removed — REALCOMP
- 2020-09-30 Listing Removed — Greater Lansing AoR
- 2020-09-30 Listed $139,900 Greater Lansing AoR
- 2020-09-30 Listed $139,900 REALCOMP
- 2020-09-24 Price Changed $139,900 REALCOMP
- 2020-09-17 Listed $139,900 Greater Lansing AoR
- 2020-09-17 Listed $145,000 REALCOMP
- 2020-09-08 Listing Removed — REALCOMP
- 2020-09-08 Listing Removed — Greater Lansing AoR
- 2020-09-03 Price Changed $145,000 REALCOMP
- 2020-08-14 Listed $145,000 Greater Lansing AoR
- 2020-08-14 Listed $149,999 REALCOMP
- 2017-12-05 Sold (Public Records) $85,000 Public Records
- 2017-12-01 Sold (MLS) $85,000 REALCOMP
- 2017-12-01 Sold (MLS) $85,000 Greater Lansing AoR
- 2017-09-18 Listed $89,900 REALCOMP
- 2017-09-18 Listed $89,900 Greater Lansing AoR
- 2010-03-22 Sold (Public Records) $31,500 Public Records
- 2010-03-11 Sold (MLS) $31,500 Greater Lansing AoR
- 2009-11-23 Listed $40,000 Greater Lansing AoR
- 2009-11-17 Listing Removed — Greater Lansing AoR
- 2009-01-06 Listed $49,500 Greater Lansing AoR
- 2008-12-01 Listing Removed — Greater Lansing AoR
- 2008-10-22 Listed $69,500 Greater Lansing AoR
- 1998-05-18 Sold (Public Records) $77,200 Public Records
Property tax history
+18.8%/yrLatest (2025): $3,360 · +2.9% YoY. Source: county tax records.
Cash-flow waterfall
monthlySold comps — $/sqft
last 12 mo · ≤1 miLoading sold comps…