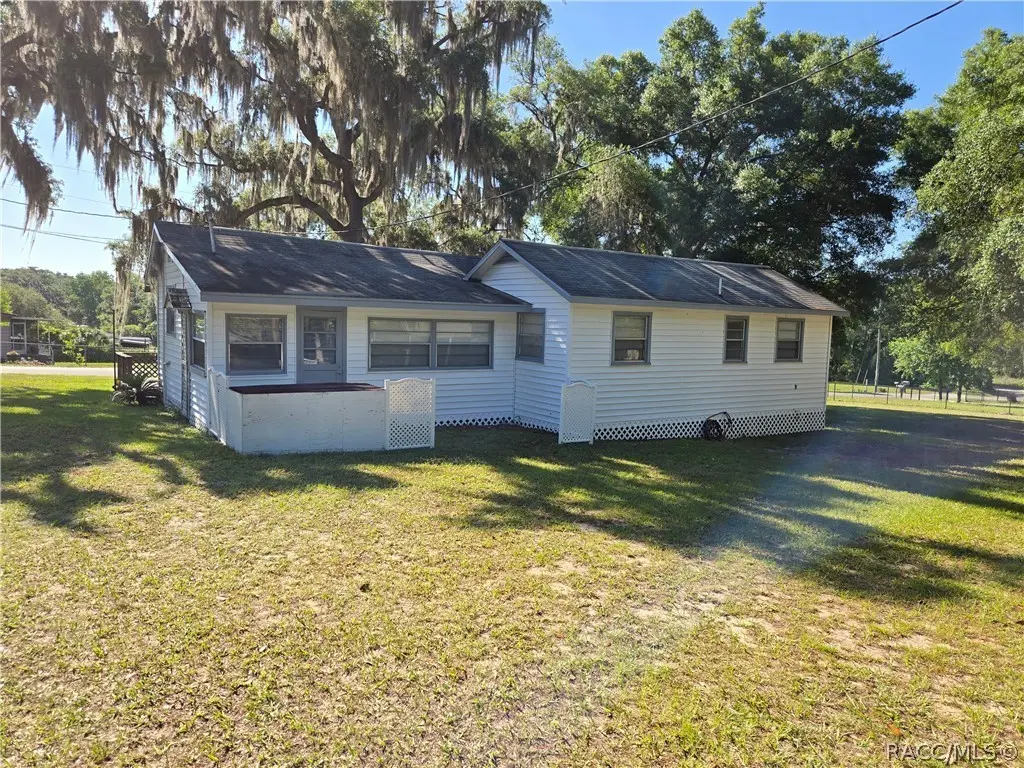
4460 Harvard Dr · Hernando, FL
Flood risk 1/10 · Minimal
- FEMA flood zone
- X (unshaded)
- Chance of flooding over 30 yrs
- 0.0%
- Est. flood insurance / yr
- $507 – $1,088
Fire risk 5/10 · Moderate
- Est. fire insurance / yr
- $947 – $1,759
Heat risk 9/10 · Severe
- Hot days now (above 108°F)
- 7 days/yr
- Hot days in 30 yrs
- 22 days/yr
Wind risk 9/10 · Severe
- Chance of severe wind over 30 yrs
- 99.0%
Air-quality risk 1/10 · Minimal
- Unhealthy air days now
- 0 days/yr
- Unhealthy air days in 30 yrs
- 0 days/yr
Risk factors via First Street. Map © Google.
Why this score? — see what drove the C grade
The composite is a weighted blend of 9 inputs, each scored 0–100. Each bar is that input's sub-score; the figure is the points it added to the 100-point composite (weight × sub-score).
- Cash flow +20.6/30.0
- ARV discount +13.8/15.0
- DSCR +6.5/10.0
- 1% rule +4.9/10.0
- Schools +4.1/10.0
- Livability +3.6/5.0
- Rent growth +2.5/5.0
- Condition / age +2.5/5.0
- Appreciation +0.0/10.0
$155,000
🖨 Deal sheet 📄 Offer letter ✓ Due diligence
Listing remarks MLS
BEING SOLD AS WITH RIGHT TO INSPECT Looking for investment property, this is it freshly painted, with all the furniture. Less than 1 mile from Hernado beach and boat ramp. Take a look and make an offer. There is a seperate lot that could be sold for a mobile home. Owner financing . Excelent opportunity for a first time. time home buyer or property investment
Key facts
- Large shade trees
- Detached car port
- Move in condition
Tags
Property features AI
Finance
- Other: Located on a county road; Lot approximately 0.46 acres; Zoning: CLMH
Exterior
- Parking: Detached carport; Driveway; Paved and unpaved parking areas; Total of 1 parking space
- Utilities: Private well water; Septic tank sewer
- Home design: Single-family residence; One story; Residential property
- Construction: Frame construction; Built date not specified
- Exterior features: Asphalt shingle roof; No pool
Interior
- Kitchen: Electric oven; Electric range; Refrigerator; Dishwasher not listed
- Bedrooms: Not specified
- Flooring: Carpet; Laminate
- Bathrooms: One full bathroom
- Heating & cooling: Central heating (electric); Central air (electric)
- Interior features: Washer and dryer included; Electric oven and electric range; Refrigerator; Carpet and laminate flooring; Central heating and electric heating; Central electric cooling
- Laundry & utility: Washer; Dryer
Neighborhood map
What this means for you Summary
Snapshot
- This is a 2-bed/1.0-bath single-family listed at $155k.
Deal economics
- At list price, monthly cash flow is $206 ($2k/yr) — positive.
- The deal already cash-flows at list — no discount required.
- To meet the 1% rule (rent ≥ 1% of price), the offer needs to be $154k (0.9% below list).
- Recommended offer: $150k (3.0% below list) — sets the bar for market timing.
- Cap rate 7.9% vs local median 5.6% in Hernando — top-decile yield for the area; either an underpriced asset or a hidden risk that comps aren't pricing in. Stress-test before assuming the spread holds.
Location & tenants
- Location reads 71/100 on livability (#402 in FL) — a middle-class / working-renter tenant base. Strengths: cost of living A+, housing A+, health & safety A+; Watch: amenities F, commute F, employment D-.
- Citrus (rural): math 49% / reading 50% proficiency, ranked #44 of 73 in FL (top 60%) — families likely to look elsewhere, expect single-tenant / working-renter base with shorter leases.
- Zoned schools: Hernando Elementary School (math 47% / reading 51%, grade D, #1,134 of 2,144 statewide, top 54%, 813 students, 71% FRL); Citrus Springs Middle School (math 55% / reading 54%, grade B-, #183 of 571 statewide, top 34%, 821 students, 59% FRL); Citrus High School (math 34% / reading 51%, grade F, #264 of 667 statewide, top 41%, 1,503 students, 54% FRL) — zoned schools at 62% FRL track the district average.
- Market conditions: 444 active listings in the ZIP; 2,443 units permitted in Citrus County in 2024 (0 in 5+ unit buildings).
- This rent runs 32% of the median local income ($57k/yr) — at the standard rent-burdened threshold; future hikes will face affordability resistance.
Forward outlook
- Local home prices are declining (-3.0%/yr); year-one equity from $1k of loan paydown is wiped out by about $5k of value loss. Plan a longer hold.
- Citrus County population projected to shrink 10% by 2050 — rents likely to lag national; underwrite the cash flow, not the appreciation.
Negotiation context
- It's been on market 42 days — a 3% lower offer ($150k) is reasonable based on typical stale-listing flexibility.
- 3 sale attempts since 23y ago with the ask held roughly flat each time — persistent listings suggest the price (not the market) is what's stuck; bring a comps-based counter.
- Current owner paid $51k; list at $155k implies a 204% gain — meaningful room to come down on a strong offer.
Risks & watch-outs
- Watch-outs: built in 1956 — expect roof / HVAC / electrical / plumbing capex.
- Climate carrying-cost: severe wind risk, 99% chance of damaging wind over 30y; moderate wildfire risk; extreme-heat days projected 7→22/yr by 2055 (HVAC capex compounding) — expect insurance premiums to compound above CPI over the hold.
Questions for the listing agent
- It's been on market 42 days. Have you received any prior offers? Is the seller open to a 3% concession, seller financing, or rate buy-down credit?
- Built in 1956 — when were the roof, HVAC, electrical panel, plumbing, and water heater last replaced?
- Is there a deadline driving the sale (1031 exchange, divorce, estate, relocation)? That informs how much negotiation room exists.
- What's the average days-on-market for RENTAL listings here right now (not sales)? A rising rental-DOM trend means longer vacancies and softer asking-rent achievability than the comps imply.
- What's the recent tenant-quality profile in this submarket — average credit score on applications, eviction rate, late-payment / NSF rate, and stable-employment percentage? A property-management company in the area should have these aggregated.
- How much new for-sale + rental construction is in the pipeline within 1–3 miles? Heavy new supply typically softens prices + rents 12–24 months out; constrained supply supports both.
Investment metrics
- 1% rule
- 0.99% ✗
- Cap rate
- 7.89%
- Cash-on-cash
- 5.69%
- DSCR
- 1.25
- GRM
- 8.4
CMA / ARV
- ARV (on-the-fly)
- $180,288
- Comps found
- 4
Show comp detail 4 sales within ~0.75 mi
| Address | Dist | Beds/Ba | Sqft | Sold | Price | $/sf | Match |
|---|---|---|---|---|---|---|---|
| 2742 Bucknell Ter | 0.25mi | 2/1.0 | 928 (-1%) | 5mo | $167,250 | $180 | 82 |
| 2945 N Kent Pt | 0.24mi | 2/2.0 | 1,034 (+10%) | 14mo | $198,900 | $192 | 56 |
| 2931 N Wheaton Pt | 0.64mi | 1/1.0 (-1) | 1,016 (+8%) | 7mo | $127,000 | $125 | 46 |
| 2151 N Meadowview Ter | 0.65mi | 2/1.0 | 992 (+6%) | 18mo | $245,000 | $247 | 45 |
Match score weights: distance 35% · size 25% · config 20% · recency 20%. Top-matched comps best support the ARV.
Projected returns pro-forma
-3.0% appreciation · 3.0% rent growth · sell at horizon
- IRR
- -7.5%
- Equity multiple
- 0.72×
- Total profit
- $-12,019
- Equity at exit
- $23,111
- IRR
- 2.1%
- Equity multiple
- 1.15×
- Total profit
- $6,355
- Equity at exit
- $13,402
Cash invested: $43,400 (down + closing). Projections, not guarantees.
Landlord ↔ Tenant lean methodology
- Overall (STATE)
- 87 Strongly Landlord-Friendly
- State Florida
- 87 Strongly Landlord-Friendly · R+3
- County
- — inherits STATE
- City
- — inherits STATE
ZIP-level market 34442
- Home prices YoY
- -21.9%
- Active inventory
- 444
- Price-to-rent
- 8.4×
Monthly cashflow live
- Estimated rent
- $1,536 medium interval (Pro) →
- Mortgage (P&I)
- −$813
- Tax from tax record
- −$130 /mo · $1,562/yr
- Insurance
- −$65
- HOA
- −$0
- Vacancy / Maint / Mgmt
- −$323
- Net cashflow
- $206
Break-even live
UW: 25.0% down · 7.5% · 30yr · 1.5% tax · 5.0% vac · 8.0% maint · 8.0% mgmt
Financing live
Cash to close
- Down payment
- $38,750
- Closing costs
- $4,650
- Reserves months
- —
- Total cash needed
- —
Loan-product check · same deal, 3 products live
Conventional
25% down · 7.5% · 30yr
- Down + closing
- —
- Monthly P&I
- —
- Monthly cashflow
- —
- DSCR
- —
- Eligible?
- —
Personal DTI + credit; lowest rate.
DSCR
20% down · 8.5% · 30yr
- Down + closing
- —
- Monthly P&I
- —
- Monthly cashflow
- —
- DSCR
- —
- Eligible?
- —
No personal income docs; deal must DSCR.
Hard money
10% down · 12.0% · 12mo
- Down + closing
- —
- Monthly P&I
- —
- Monthly cashflow
- —
- DSCR
- —
- Eligible?
- —
Short-term bridge; refi at stabilization.
Listing history 23 events
-
2026-06-19days on market $155,000 Active 42 DOM
-
2026-06-18days on market $155,000 Active 41 DOM
-
2026-06-17days on market $155,000 Active 40 DOM
-
2026-06-16days on market $155,000 Active 39 DOM
-
2026-06-15days on market $155,000 Active 38 DOM
-
2026-06-14days on market $155,000 Active 36 DOM
-
2026-06-13days on market $155,000 Active 35 DOM
-
2026-06-09days on market $155,000 Active 32 DOM
-
2026-06-08days on market $155,000 Active 31 DOM
-
2026-06-07days on market $155,000 Active 30 DOM
-
2026-06-03days on market $155,000 Active 26 DOM
-
2026-06-02days on market $155,000 Active 25 DOM
-
2026-06-01days on market $155,000 Active 24 DOM
-
2026-05-31days on market $155,000 Active 23 DOM
-
2026-05-30days on market $155,000 Active 22 DOM
-
2026-05-08$155,000 Active
-
2004-11-29soldstatus $51,000 369-char remark
Show marketing remark (369 chars)
BEING SOLD AS WITH RIGHT TO INSPECT Looking for investment property, this is it freshly painted, with all the furniture. Less than 1 mile from Hernado beach and boat ramp. Take a look and make an offer. There is a seperate lot that could be sold for a mobile home. Owner financing . Excelent opportunity for a first time. time home buyer or property investment
-
2004-11-22soldstatus $50,000
-
2004-03-08$51,000 369-char remark
Show marketing remark (369 chars)
BEING SOLD AS WITH RIGHT TO INSPECT Looking for investment property, this is it freshly painted, with all the furniture. Less than 1 mile from Hernado beach and boat ramp. Take a look and make an offer. There is a seperate lot that could be sold for a mobile home. Owner financing . Excelent opportunity for a first time. time home buyer or property investment
-
2003-05-23soldstatus $32,000
-
2003-05-06soldstatus $32,000 206-char remark
Show marketing remark (206 chars)
This is a nice little home set on 3 lots. Plenty of room for future possibilities. This home will be sold "As Is" with right to inspect. Attention handymen, this is the one you`ve ben looking for.
-
2003-03-20$35,000 206-char remark
Show marketing remark (206 chars)
This is a nice little home set on 3 lots. Plenty of room for future possibilities. This home will be sold "As Is" with right to inspect. Attention handymen, this is the one you`ve ben looking for.
-
1997-04-16soldstatus $21,200
ⓘ Source: listings_history table (triggers on properties + properties_extension) + one-shot
backfill from property_details.listing_events for pre-trigger history.
Tax reassessment forecast FL · Resets to sale price
- Current annual tax
- $1,562 · $130/mo
- Projected year-2 tax
- $1,562 · $130/mo
- Expected delta
- $0/yr ($0/mo · 0.0%)
ⓘ Screening estimate from a state-policy table — verify with the county assessor before closing.
Climate risk First Street
- Flood 1/10 Low FEMA zone X (unshaded) · 0% chance over 30 yrs
- Wildfire 5/10 Major
- Heat 9/10 Extreme 7 d/yr ≥108°F today · 22 d/yr by 30 yrs out
- Wind 9/10 Extreme 99% chance of damaging wind over 30 yrs
- Air quality 1/10 Low 0 unhealthy d/yr today · 0 by 30 yrs out
Nearby sold comps map
Loading sold comps map…
Walkable amenities ~0.75 mi
Loading nearby amenities…
Taxation est. · year 1
- Rental income
- $18,432
- − Mortgage interest
- −$8,682
- − Property taxes
- −$1,562
- − Insurance
- −$775
- − Repairs & maintenance
- −$1,475
- − Management
- −$1,475
- − Depreciation
- −$4,509
- Taxable loss
- −$45
- Est. tax savings @ 24.0%
- +$11
- After-tax cash flow
- $2,482/yr
For passive investors: Depreciation is non-cash, so a rental often shows a tax loss while cash-flowing — sheltering income. Rental losses are passive: they offset passive income freely, and up to $25,000/yr can offset ordinary (W-2) income if you actively participate and your MAGI is under $100k (phasing out to $0 by $150k); unused losses carry forward. On sale, claimed depreciation is recaptured at up to 25%, and gains may owe capital-gains tax (a 1031 exchange can defer both). Figures are a year-1 estimate at your 24.0% rate — not tax advice; consult a CPA.
Schools (NCES district)
- District
- Citrus
- NCES district ID
- 1200270
- Math proficiency
- 49% ▼ -10.00%
- Reading proficiency
- 50% ▼ -6.00%
- Median HH income
- $38,618
- Composite
- 41.28/100
- National rank
- #3519
- State rank
- #44 of 73 in FL
Livability — Hernando
- Score
- 71/100
- State rank
- #402
- US rank
- #7137
Category grades
Schools grade is shown separately in the Schools card above.
Census & demographics
- Census place
- Hernando, FL
- County
- Citrus County · 111,314 people
- City population
- 17,281
- Metro
- Homosassa Springs, FL
- Population (ZIP)
- 17,281
- Household income
- $57,259
- Rent vs Own
- Severe rent burden
- 314.0
Population outlook (Citrus County) Hauer SSP2
- Today (2025)
- 138,622 people
- By 2030
- 136,886 · -1.3%
- By 2040
- 132,009 · -4.8%
- By 2050
- 125,196 · -9.7%
- By 2075
- 108,570 · -21.7%
- By 2100
- 84,454 · -39.1%
Race, ethnicity, and origin ACS 2023
- Neighborhood character
- Predominantly White (90%)
- Race & ethnicity
- White 90% Hispanic / Latino 4% Two or more races 3% Asian 2% Black 2%
- Common ancestry
- Romanian 4% Slovak 4% Lithuanian 3%
- Foreign-born
- 8% · Canada, China, South Korea
- Languages at home
- 93% English-only · Spanish 3% German/W. Germanic 2% Tagalog/Filipino 1%
Political lean MEDSL · Citrus
- 2024 margin
- Solid R (+45.9) · D 26.8% · R 72.6%
- 2008→2024 swing
- -29.8pp toward R · 2008: -16.1pp · 2024: -45.9pp
- All cycles
- 2024: R+45.9 2020: R+41.0 2016: R+39.7 2012: R+21.9 2008: R+16.1
Not yet ingested
- Civics
- —
Market trends
- HPI YoY
- ▼ -76.70%
- Current HPI
- 273.3262
- Rent YoY
- —
- Metro
- Homosassa Springs, FL
- State GDP YoY
- ▲ 3.28%
- F500 in state
- 36
Industry mix (Fortune 500 HQ in FL)
| Industry | F500 HQs | Revenue |
|---|---|---|
| Industrial Technology | 2 | $29B |
|
||
| Insurance | 2 | $17B |
|
||
| Retail | 1 | $60B |
|
||
| Technology Distribution | 1 | $58B |
|
||
| Homebuilding | 1 | $35B |
|
||
| Technology Manufacturing | 1 | $35B |
|
||
Price history
+631.1% since first listed8 events — show timeline
- 2026-05-08 Listed $155,000 RACC
- 2004-11-29 Sold (MLS) $51,000 RACC
- 2004-11-22 Sold (Public Records) $50,000 Public Records
- 2004-03-08 Listed $51,000 RACC
- 2003-05-23 Sold (Public Records) $32,000 Public Records
- 2003-05-06 Sold (MLS) $32,000 RACC
- 2003-03-20 Listed $35,000 RACC
- 1997-04-16 Sold (Public Records) $21,200 Public Records
Property tax history
+7.8%/yrLatest (2025): $1,562 · +13.2% YoY. Source: county tax records.
Cash-flow waterfall
monthlySold comps — $/sqft
last 12 mo · ≤1 miLoading sold comps…