 Duplex
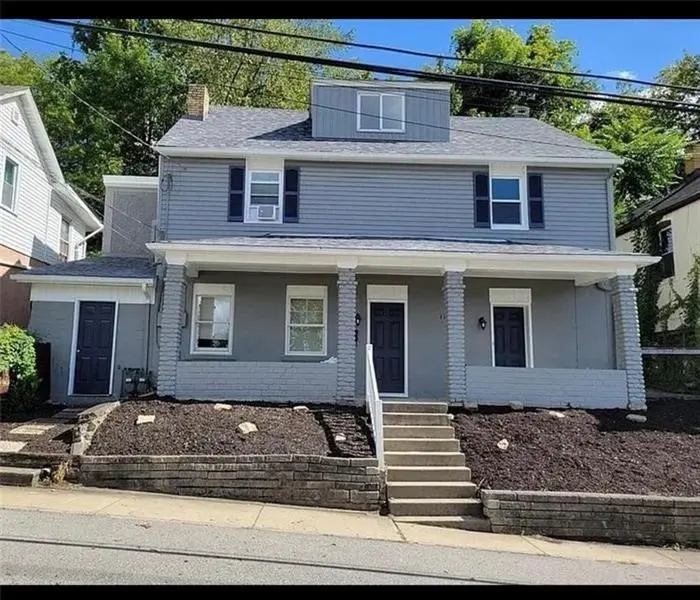
169 Union St · Bridgeville, PA
Flood risk 1/10 · Minimal
- FEMA flood zone
- X (unshaded)
- Chance of flooding over 30 yrs
- 0.0%
- Est. flood insurance / yr
- $473 – $860
Fire risk 1/10 · Minimal
- Est. fire insurance / yr
- $511 – $949
Heat risk 4/10 · Minor
- Hot days now (above 98°F)
- 7 days/yr
- Hot days in 30 yrs
- 17 days/yr
Wind risk 2/10 · Minimal
- Chance of severe wind over 30 yrs
- —
Air-quality risk 2/10 · Minimal
- Unhealthy air days now
- 0 days/yr
- Unhealthy air days in 30 yrs
- 3 days/yr
Risk factors via First Street. Map © Google.
Why this score? — see what drove the B- grade
The composite is a weighted blend of 9 inputs, each scored 0–100. Each bar is that input's sub-score; the figure is the points it added to the 100-point composite (weight × sub-score).
- Cash flow +27.8/30.0
- DSCR +9.8/10.0
- 1% rule +8.3/10.0
- ARV discount +7.5/15.0
- Schools +4.1/10.0
- Livability +4.0/5.0
- Rent growth +2.5/5.0
- Condition / age +2.5/5.0
- Appreciation +0.0/10.0
$249,900
🖨 Deal sheet (PDF) 📄 Offer letter ✓ Due diligence
Multi-family units
County records classify this as Multi-Family (2-4 Unit). Listing-text estimate: 2 units. confirmed
Listing remarks MLS
INVESTORS!! Don’t miss this turnkey, income-producing side-by-side duplex in the highly desirable Bridgeville neighborhood! This fully renovated property features two units: a 2-bedroom, 1-bath unit on the left and a spacious 4-bedroom, 1-bath unit on the right. Both units offer stainless steel appliances, in-unit laundry, and modern finishes throughout. Plentiful on-street parking adds convenience, and all utilities are separately metered. An excellent opportunity for immediate cash flow in a prime location.
Key facts
- Income-producing
- Fully renovated
- Newer roof
Tags
Property features AI
Finance
- Financial info: Gross annual income reported at $32,700; Unit rents reported at approximately $1,225 and $1,500
Exterior
- Parking: On-street parking for approximately 3 vehicles
- Utilities: Electricity available; Natural gas available; Public water available; Public sewer available
- Home design: Two-family zoning
- Construction: Brick construction; Asphalt roof
- Exterior features: Public transportation access nearby
Interior
- Bedrooms: One unit with 2 bedrooms; One unit with 4 bedrooms
- Bathrooms: Each unit has 1 full bathroom
- Interior features: Two-family layout (multi-unit property)
Neighborhood map
What this means for you Summary
Snapshot
- This is a 1×2bd/1ba + 1×4bd/1ba units multifamily listed at $250k.
Deal economics
- At list price, monthly cash flow is $760 ($9k/yr) — positive. Per door: $380/mo.
- The deal already cash-flows at list — no discount required.
- Meets the 1% rule at list price ($3k rent vs $250k).
- Cap rate 9.9% vs local median 4.1% in Bridgeville — top-decile yield for the area; either an underpriced asset or a hidden risk that comps aren't pricing in. Stress-test before assuming the spread holds.
Location & tenants
- Location reads 80/100 on livability (#199 in PA, #1,745 nationally) — a professional / high-income tenant draw. Strengths: cost of living A+, housing A+, amenities A; Watch: employment C-, commute F.
- Chartiers Valley SD (suburban): math 37% / reading 57% proficiency, ranked #221 of 539 in PA (top 41%) — families likely to look elsewhere, expect single-tenant / working-renter base with shorter leases.
- Zoned schools: Chartiers Valley Primary Sch (879 students, 30% FRL); Chartiers Valley Ms (math 20% / reading 55%, grade F, #292 of 512 statewide, top 58%, 718 students, 35% FRL); Chartiers Valley Hs (math 53% / reading 24%, grade F, #279 of 437 statewide, top 64%, 1,018 students, 25% FRL).
- Market conditions: 70 active listings in the ZIP; solid renter incomes; 2,996 units permitted in Allegheny County in 2024 (1,588 in 5+ unit buildings).
- At $3,315/mo this rent would consume 46% of the median local household income ($87k/yr) (locally 454% of renters already pay >50% of income on rent) — very limited rent-growth headroom before tenants either downsize or default.
Forward outlook
- Local home prices are declining (-3.0%/yr); year-one equity from $2k of loan paydown is wiped out by about $7k of value loss. Plan a longer hold.
- At projected returns (-3.0% appreciation + 3.0% rent growth), your $70k cash investment doubles in ~9 years — after that, you're playing with house money.
Negotiation context
- Only 5 days on market — expect competitive offers; lowballing is unlikely to land.
- 11 sale attempts since 15y ago with the ask held roughly flat each time — persistent listings suggest the price (not the market) is what's stuck; bring a comps-based counter.
- Current owner paid $175k; 43% above their basis — modest negotiation headroom, anchor on the comps not their cost.
Risks & watch-outs
- Watch-outs: built in 1900 — expect roof / HVAC / electrical / plumbing capex.
Questions for the listing agent
- Can we see the unit-by-unit rent roll, current vacancy, and any below-market leases? What's the average tenancy length?
- What capital expenditures (roof, boiler, parking lot, exteriors) have been made in the last 5 years, and what's planned in the next 2?
- Built in 1900 — when were the roof, HVAC, electrical panel, plumbing, and water heater last replaced?
- Is there a deadline driving the sale (1031 exchange, divorce, estate, relocation)? That informs how much negotiation room exists.
- Schools are B-rated — typically a magnet for longer-tenancy family renters. What's the average tenant stay here, and is there a school-zone premium baked into asking?
- What's the average days-on-market for RENTAL listings here right now (not sales)? A rising rental-DOM trend means longer vacancies and softer asking-rent achievability than the comps imply.
- What's the recent tenant-quality profile in this submarket — average credit score on applications, eviction rate, late-payment / NSF rate, and stable-employment percentage? A property-management company in the area should have these aggregated.
- How much new apartment / multifamily construction is in the pipeline within 1–3 miles? Heavy new supply (>2% of stock underway) typically softens rents 12–24 months out; light construction supports rent growth.
Investment metrics
- 1% rule
- 1.33% ✓
- Cap rate
- 9.94%
- Cash-on-cash
- 13.03%
- DSCR
- 1.58
- GRM
- 6.3
CMA / ARV
No comps found within radius.
Projected returns pro-forma
-3.0% appreciation · 3.0% rent growth · sell at horizon
- IRR
- 3.0%
- Equity multiple
- 1.11×
- Total profit
- $8,017
- Equity at exit
- $37,261
- IRR
- 12.6%
- Equity multiple
- 2.00×
- Total profit
- $69,812
- Equity at exit
- $21,607
Cash invested: $69,972 (down + closing). Projections, not guarantees.
Landlord ↔ Tenant lean methodology
- Overall (STATE)
- 62 Landlord-Friendly
- State Pennsylvania
- 62 Landlord-Friendly · EVEN
- County
- — inherits STATE
- City
- — inherits STATE
ZIP-level market 15017
- Home prices YoY
- -31.8%
- Active inventory
- 70
- Price-to-rent
- 14.9×
Monthly cashflow live
- Estimated rent
- $3,315 high interval (Pro) →
- Mortgage (P&I)
- −$1,311
- Tax from tax record
- −$445 /mo · $5,335/yr
- Insurance
- −$104
- HOA
- −$0
- Vacancy / Maint / Mgmt
- −$696
- Net cashflow
- $760
Break-even live
Sensitivity live
| Price | -10% $901 | -5% $830 | +0% $760 | +5% $689 | +10% $618 |
|---|---|---|---|---|---|
| Rent | -10% $498 | -5% $629 | +0% $760 | +5% $891 | +10% $1,022 |
| Rate | -1.0pp $885 | -0.5pp $823 | base $760 | +0.5pp $695 | +1.0pp $629 |
2-unit breakdown (identical units grouped — click to expand)
| Units | Beds | Baths | Est. rent |
|---|---|---|---|
| 1× unit | 2 | 1 | $1,395 |
| 1× unit | 4 | 1 | $1,920 |
| Total (2 units) | $3,315 | ||
UW: 25.0% down · 7.5% · 30yr · 1.5% tax · 5.0% vac · 8.0% maint · 8.0% mgmt
Financing live
Cash to close
- Down payment
- $62,475
- Closing costs
- $7,497
- Reserves months
- —
- Total cash needed
- —
Loan-product check · same deal, 3 products live
Conventional
25% down · 7.5% · 30yr
- Down + closing
- —
- Monthly P&I
- —
- Monthly cashflow
- —
- DSCR
- —
- Eligible?
- —
Personal DTI + credit; lowest rate.
DSCR
20% down · 8.5% · 30yr
- Down + closing
- —
- Monthly P&I
- —
- Monthly cashflow
- —
- DSCR
- —
- Eligible?
- —
No personal income docs; deal must DSCR.
Hard money
10% down · 12.0% · 12mo
- Down + closing
- —
- Monthly P&I
- —
- Monthly cashflow
- —
- DSCR
- —
- Eligible?
- —
Short-term bridge; refi at stabilization.
Listing history 4 events
-
2026-06-03days on market $249,900 Active 5 DOM
-
2026-06-02days on market $249,900 Active 4 DOM
-
2026-06-01days on market $249,900 Active 3 DOM
-
2026-05-31days on market $249,900 Active 2 DOM
ⓘ Source: listings_history table (triggers on properties + properties_extension) + one-shot
backfill from property_details.listing_events for pre-trigger history.
Tax reassessment forecast PA · Partial reset (capped growth)
- Current annual tax
- $5,335 · $445/mo
- Projected year-2 tax
- $5,335 · $445/mo
- Expected delta
- $0/yr ($0/mo · 0.0%)
ⓘ Screening estimate from a state-policy table — verify with the county assessor before closing.
Climate risk First Street
- Flood 1/10 Low FEMA zone X (unshaded) · 0% chance over 30 yrs
- Wildfire 1/10 Low
- Heat 4/10 Moderate 7 d/yr ≥98°F today · 17 d/yr by 30 yrs out
- Wind 2/10 Low
- Air quality 2/10 Low 0 unhealthy d/yr today · 3 by 30 yrs out
Nearby sold comps map
Loading sold comps map…
Walkable amenities ~0.75 mi
Loading nearby amenities…
Taxation est. · year 1
- Rental income
- $39,780
- − Mortgage interest
- −$13,998
- − Property taxes
- −$5,335
- − Insurance
- −$1,250
- − Repairs & maintenance
- −$3,182
- − Management
- −$3,182
- − Depreciation
- −$7,270
- Taxable income
- $5,562
- Est. tax owed @ 24.0%
- −$1,335
- After-tax cash flow
- $7,780/yr
For passive investors: Depreciation is non-cash, so a rental often shows a tax loss while cash-flowing — sheltering income. Rental losses are passive: they offset passive income freely, and up to $25,000/yr can offset ordinary (W-2) income if you actively participate and your MAGI is under $100k (phasing out to $0 by $150k); unused losses carry forward. On sale, claimed depreciation is recaptured at up to 25%, and gains may owe capital-gains tax (a 1031 exchange can defer both). Figures are a year-1 estimate at your 24.0% rate — not tax advice; consult a CPA.
Schools (NCES district)
- District
- Chartiers Valley SD
- NCES district ID
- 4205700
- Math proficiency
- 37% ▼ -16.00%
- Reading proficiency
- 57% ▼ -17.00%
- Median HH income
- $57,191
- Composite
- 40.91/100
- National rank
- #3614
- State rank
- #221 of 539 in PA
Livability — Bridgeville
- Score
- 80/100
- State rank
- #199
- US rank
- #1745
Category grades
Schools grade is shown separately in the Schools card above.
Census & demographics
- Census place
- Bridgeville, PA
- County
- Allegheny County · 1,022,028 people
- City population
- 17,782
- Metro
- Pittsburgh, PA
- Population (ZIP)
- 17,782
- Household income
- $86,937
- Rent vs Own
- Severe rent burden
- 454.0
Population outlook (Allegheny County) Hauer SSP2
- Today (2025)
- 1,250,282 people
- By 2030
- 1,256,482 · +0.5%
- By 2040
- 1,256,318 · +0.5%
- By 2050
- 1,244,169 · -0.5%
- By 2075
- 1,197,693 · -4.2%
- By 2100
- 1,093,187 · -12.6%
Race, ethnicity, and origin ACS 2023
- Neighborhood character
- Predominantly White (86%)
- Race & ethnicity
- White 86% Asian 5% Two or more races 4% Black 4% Hispanic / Latino 2%
- Common ancestry
- Romanian 8% Lithuanian 2% Slovak 2%
- Foreign-born
- 5% · Canada, China, South Korea
- Languages at home
- 94% English-only · Other Indo-European 3% Spanish 1% Chinese 1%
Political lean MEDSL · Allegheny
- 2024 margin
- Strong D (+20.3) · D 59.7% · R 39.4%
- 2008→2024 swing
- +4.8pp toward D · 2008: 15.5pp · 2024: 20.3pp
- All cycles
- 2024: D+20.3 2020: D+20.4 2016: D+16.4 2012: D+14.4 2008: D+15.5
Not yet ingested
- Civics
- —
Market trends
- HPI YoY
- ▼ -118.46%
- Current HPI
- 254.0465
- Rent YoY
- —
- Metro
- Pittsburgh, PA
- State GDP YoY
- ▲ 1.68%
- F500 in state
- 34
Industry mix (Fortune 500 HQ in PA)
| Industry | F500 HQs | Revenue |
|---|---|---|
| Healthcare | 2 | $309B |
|
||
| Insurance | 2 | $27B |
|
||
| Telecommunications / Media | 1 | $124B |
|
||
| Industrial Distribution | 1 | $22B |
|
||
| Financial Services | 1 | $20B |
|
||
| Chemicals / Materials | 1 | $18B |
|
||
Price history
+311.4% since first listed25 events — show timeline
- 2026-05-29 Listed $249,900 West Penn MLS
- 2026-03-31 Delisted — West Penn MLS
- 2026-01-15 Listed $265,000 West Penn MLS
- 2025-04-17 Rental Removed $1,500 APPFOLIO
- 2025-03-11 Listed for Rent $1,500 APPFOLIO
- 2024-04-04 Rental Removed $1,500 APPFOLIO
- 2024-02-04 Listed for Rent $1,500 APPFOLIO
- 2023-10-06 Rental Removed $1,400 APPFOLIO
- 2023-09-21 Price Changed $1,400 APPFOLIO
- 2023-09-09 Listed for Rent $1,500 APPFOLIO
- 2023-05-14 Contingent — West Penn MLS
- 2023-05-12 Relisted — West Penn MLS
- 2023-04-08 Contingent — West Penn MLS
- 2023-04-04 Listed $158,750 West Penn MLS
- 2020-10-30 Sold (MLS) $174,900 West Penn MLS
- 2020-09-09 Contingent — West Penn MLS
- 2020-09-09 Price Changed $180,000 West Penn MLS
- 2020-09-04 Listed $169,900 West Penn MLS
- 2016-06-02 Sold (Public Records) $54,500 Public Records
- 2015-12-15 Delisted — West Penn MLS
- 2015-11-24 Price Changed $53,900 West Penn MLS
- 2015-11-24 Listed $539,000 West Penn MLS
- 2012-02-16 Listed $54,900 West Penn MLS
- 2011-08-01 Listed $54,900 West Penn MLS
- 2004-11-12 Sold (Public Records) $60,750 Public Records
Property tax history
+5.9%/yrLatest (2026): $5,335 · +0.0% YoY. Source: county tax records.
Cash-flow waterfall
monthlySold comps — $/sqft
last 12 mo · ≤1 miLoading sold comps…