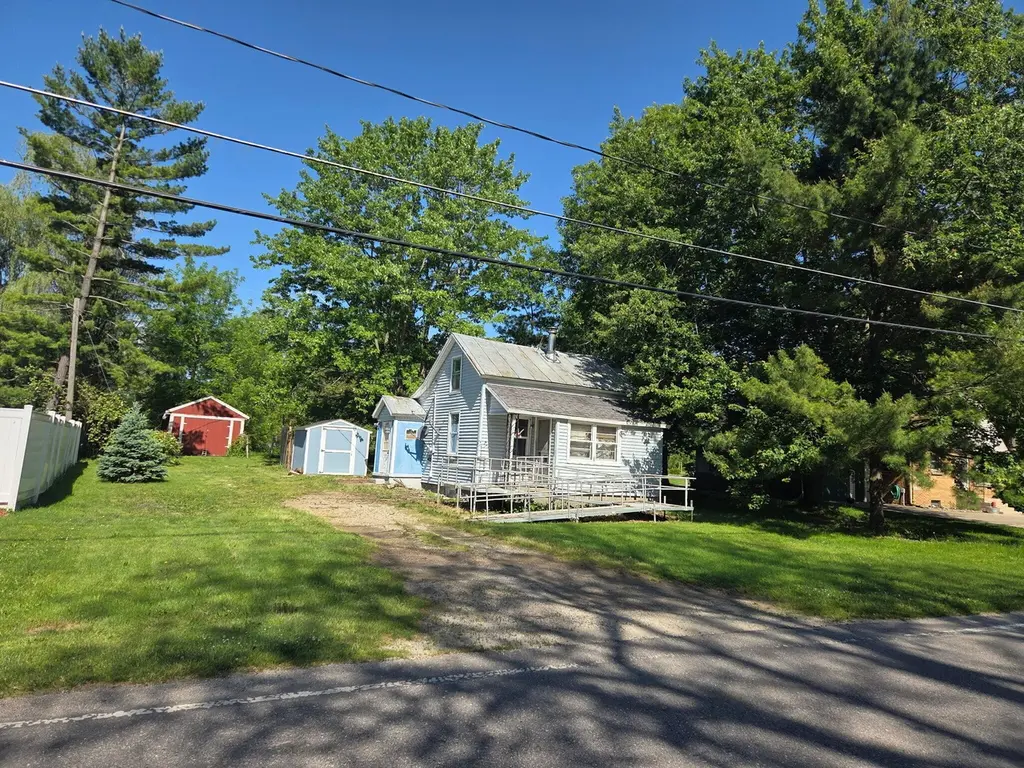
4426 12th St · Dorr, MI
Flood risk 1/10 · Minimal
- FEMA flood zone
- X (unshaded)
- Chance of flooding over 30 yrs
- 0.0%
- Est. flood insurance / yr
- $473 – $860
Fire risk 1/10 · Minimal
- Est. fire insurance / yr
- $784 – $1,456
Heat risk 2/10 · Minimal
- Hot days now (above 97°F)
- 7 days/yr
- Hot days in 30 yrs
- 16 days/yr
Wind risk 2/10 · Minimal
- Chance of severe wind over 30 yrs
- —
Air-quality risk 3/10 · Minor
- Unhealthy air days now
- 2 days/yr
- Unhealthy air days in 30 yrs
- 3 days/yr
Risk factors via First Street. Map © Google.
Why this score? — see what drove the B- grade
The composite is a weighted blend of 9 inputs, each scored 0–100. Each bar is that input's sub-score; the figure is the points it added to the 100-point composite (weight × sub-score).
- Cash flow +30.0/30.0
- 1% rule +10.0/10.0
- DSCR +10.0/10.0
- ARV discount +7.5/15.0
- Schools +4.2/10.0
- Rent growth +2.5/5.0
- Livability +2.5/5.0
- Condition / age +1.0/5.0
- Appreciation +0.0/10.0
$48,000
🖨 Deal sheet 📄 Offer letter ✓ Due diligence
Listing remarks MLS
Small 2 bedroom home in need of TLC. Backyard has a fenced in area. 2 outbuildings, 1 shed seems to be in decent condition, the other is larger and appears to be in decent condition as well. All offers are being held until 6/19/2026 at 8:00 am. Sale is subject to Probate Court Approval.
Key facts
- Fenced in area
- 2 outbuildings
- 0.29 acre lot
Tags
Property features AI
Exterior
- Utilities: Public water; Natural gas connected; Natural gas water heater
- Home design: Traditional single-family residence; Built in 1930; Living area approximately 615
- Construction: Vinyl siding; Metal roof; Partial crawl space foundation
- Exterior features: Paved road access; Shed(s) and barn(s) on the property
Interior
- Bathrooms: 1 full bathroom
- Heating & cooling: Forced air heating; Heating present
- Interior features: Total of 4 rooms; Partial crawl space basement
Neighborhood map
What this means for you Summary
Snapshot
- This is a 2-bed/1.0-bath single-family listed at $48k. Condition is rated poor.
Deal economics
- At list price, monthly cash flow is $430 ($5k/yr) — positive.
- The deal already cash-flows at list — no discount required.
- Meets the 1% rule at list price ($964 rent vs $48k).
Location & tenants
- Location reads: area grade B — affects rentability + tenant quality, not the cash-flow math above.
- Wayland Union Schools (town): math 45% / reading 51% proficiency, ranked #110 of 540 in MI (top 20%) — families likely to look elsewhere, expect single-tenant / working-renter base with shorter leases.
- Market conditions: 94 active listings in the ZIP; 419 units permitted in Allegan County in 2024 (0 in 5+ unit buildings).
Forward outlook
- Local home prices are declining (-3.0%/yr); year-one equity from $332 of loan paydown is wiped out by about $1k of value loss. Plan a longer hold.
- At projected returns (-3.0% appreciation + 3.0% rent growth), your $13k cash investment doubles in ~4 years — after that, you're playing with house money.
Negotiation context
- Only 14 days on market — expect competitive offers; lowballing is unlikely to land.
- 3 sale attempts with the ask held roughly flat each time — persistent listings suggest the price (not the market) is what's stuck; bring a comps-based counter.
Risks & watch-outs
- Watch-outs: built in 1930 — expect roof / HVAC / electrical / plumbing capex.
Questions for the listing agent
- Have any recent inspections been done? Can we get a copy of the seller's disclosures and any deferred-maintenance estimates?
- Built in 1930 — when were the roof, HVAC, electrical panel, plumbing, and water heater last replaced?
- Is there a deadline driving the sale (1031 exchange, divorce, estate, relocation)? That informs how much negotiation room exists.
- What's the average days-on-market for RENTAL listings here right now (not sales)? A rising rental-DOM trend means longer vacancies and softer asking-rent achievability than the comps imply.
- What's the recent tenant-quality profile in this submarket — average credit score on applications, eviction rate, late-payment / NSF rate, and stable-employment percentage? A property-management company in the area should have these aggregated.
- How much new for-sale + rental construction is in the pipeline within 1–3 miles? Heavy new supply typically softens prices + rents 12–24 months out; constrained supply supports both.
Investment metrics
- 1% rule
- 2.01% ✓
- Cap rate
- 17.05%
- Cash-on-cash
- 38.41%
- DSCR
- 2.71
- GRM
- 4.1
CMA / ARV
No comps found within radius.
Projected returns pro-forma
-3.0% appreciation · 3.0% rent growth · sell at horizon
- IRR
- 34.5%
- Equity multiple
- 2.46×
- Total profit
- $19,634
- Equity at exit
- $7,157
- IRR
- 41.4%
- Equity multiple
- 4.90×
- Total profit
- $52,435
- Equity at exit
- $4,150
Cash invested: $13,440 (down + closing). Projections, not guarantees.
Landlord ↔ Tenant lean methodology
- Overall (STATE)
- 62 Landlord-Friendly
- State Michigan
- 62 Landlord-Friendly · EVEN
- County
- — inherits STATE
- City
- — inherits STATE
ZIP-level market 49348
- Active inventory
- 94
- Price-to-rent
- 4.1×
Monthly cashflow live
- Estimated rent
- $964 medium interval (Pro) →
- Mortgage (P&I)
- −$252
- Tax est. 1.5%
- −$60 /mo · $720/yr
- Insurance
- −$20
- HOA
- −$0
- Vacancy / Maint / Mgmt
- −$203
- Net cashflow
- $430
Break-even live
UW: 25.0% down · 7.5% · 30yr · 1.5% tax · 5.0% vac · 8.0% maint · 8.0% mgmt
Financing live
Cash to close
- Down payment
- $12,000
- Closing costs
- $1,440
- Reserves months
- —
- Total cash needed
- —
Loan-product check · same deal, 3 products live
Conventional
25% down · 7.5% · 30yr
- Down + closing
- —
- Monthly P&I
- —
- Monthly cashflow
- —
- DSCR
- —
- Eligible?
- —
Personal DTI + credit; lowest rate.
DSCR
20% down · 8.5% · 30yr
- Down + closing
- —
- Monthly P&I
- —
- Monthly cashflow
- —
- DSCR
- —
- Eligible?
- —
No personal income docs; deal must DSCR.
Hard money
10% down · 12.0% · 12mo
- Down + closing
- —
- Monthly P&I
- —
- Monthly cashflow
- —
- DSCR
- —
- Eligible?
- —
Short-term bridge; refi at stabilization.
Listing history 11 events
-
2026-06-16statusdays on market $48,000 Pending 14 DOM
-
2026-06-15days on market $48,000 Active 13 DOM
-
2026-06-14days on market $48,000 Active 11 DOM
-
2026-06-10days on market $48,000 Active 8 DOM
-
2026-06-09days on market $48,000 Active 7 DOM
-
2026-06-08days on market $48,000 Active 6 DOM
-
2026-06-07days on market $48,000 Active 5 DOM
-
2026-06-05remarks 301-char remark
-
2026-06-05days on market $48,000 Active 2 DOM
-
2026-06-03remarks 287-char remark
-
2026-06-03$48,000 Active 1 DOM
ⓘ Source: listings_history table (triggers on properties + properties_extension) + one-shot
backfill from property_details.listing_events for pre-trigger history.
Climate risk First Street
- Flood 1/10 Low FEMA zone X (unshaded) · 0% chance over 30 yrs
- Wildfire 1/10 Low
- Heat 2/10 Low 7 d/yr ≥97°F today · 16 d/yr by 30 yrs out
- Wind 2/10 Low
- Air quality 3/10 Moderate 2 unhealthy d/yr today · 3 by 30 yrs out
Nearby sold comps map
Loading sold comps map…
Walkable amenities ~0.75 mi
Loading nearby amenities…
Taxation est. · year 1
- Rental income
- $11,573
- − Mortgage interest
- −$2,689
- − Property taxes
- −$720
- − Insurance
- −$240
- − Repairs & maintenance
- −$926
- − Management
- −$926
- − Depreciation
- −$1,396
- Taxable income
- $4,676
- Est. tax owed @ 24.0%
- −$1,122
- After-tax cash flow
- $4,040/yr
For passive investors: Depreciation is non-cash, so a rental often shows a tax loss while cash-flowing — sheltering income. Rental losses are passive: they offset passive income freely, and up to $25,000/yr can offset ordinary (W-2) income if you actively participate and your MAGI is under $100k (phasing out to $0 by $150k); unused losses carry forward. On sale, claimed depreciation is recaptured at up to 25%, and gains may owe capital-gains tax (a 1031 exchange can defer both). Figures are a year-1 estimate at your 24.0% rate — not tax advice; consult a CPA.
Condition & rehab AI · 13 photos
This property requires extensive renovations and repairs to bring it up to a livable condition. Immediate updates are needed in the kitchen and bathrooms, exterior siding and roof, HVAC system, and landscaping.
Repairs flagged
- Major Kitchen countertops — Dirty and worn-out, need replacement.
- Major Kitchen appliances — Dirty and worn-out, need replacement.
- Major Kitchen flooring — Dirty and worn-out, need replacement.
- Major Bathroom fixtures — Dirty and worn-out, need replacement.
- Major Bathroom flooring — Dirty and worn-out, need replacement.
- Major Exterior siding — Weathered and missing shingles, need replacement.
- Major Windows — Dirty and worn-out, need replacement.
- Major Landscaping — Overgrown and unkempt, need trimming and planting.
- Major HVAC system — Aged and likely inefficient, needs replacement or repair.
Value-add opportunities
- Resale Kitchen renovation — Modernizing the kitchen will attract more buyers.
- Resale Bathroom renovation — Modernizing the bathrooms will attract more buyers.
- Both Exterior siding and roof replacement — Improving the exterior will increase curb appeal and value.
- Both HVAC system replacement — A new HVAC system will improve comfort and energy efficiency.
- Both Landscaping and yard work — A well-maintained yard will increase curb appeal and attract more buyers/renters.
Renovation cost estimate screening
| Repair item | Severity | Est. cost |
|---|---|---|
| Kitchen countertops · Dirty and worn-out, need replacement. | Major | $15,000–50,000 |
| Kitchen appliances · Dirty and worn-out, need replacement. | Major | $15,000–50,000 |
| Kitchen flooring · Dirty and worn-out, need replacement. | Major | $15,000–50,000 |
| Bathroom fixtures · Dirty and worn-out, need replacement. | Major | $15,000–50,000 |
| Bathroom flooring · Dirty and worn-out, need replacement. | Major | $15,000–50,000 |
| Exterior siding · Weathered and missing shingles, need replacement. | Major | $15,000–50,000 |
| Windows · Dirty and worn-out, need replacement. | Major | $15,000–50,000 |
| Landscaping · Overgrown and unkempt, need trimming and planting. | Major | $15,000–50,000 |
| HVAC system · Aged and likely inefficient, needs replacement or repair. | Major | $15,000–50,000 |
| Total estimated repair cost · 9 items | $135,000–450,000 |
Value-add ROI direction
- Resale Kitchen renovation — Modernizing the kitchen will attract more buyers. ↑
- Resale Bathroom renovation — Modernizing the bathrooms will attract more buyers. ↑
- Both Exterior siding and roof replacement — Improving the exterior will increase curb appeal and value. ↑
- Both HVAC system replacement — A new HVAC system will improve comfort and energy efficiency. ↑
- Both Landscaping and yard work — A well-maintained yard will increase curb appeal and attract more buyers/renters. ↑
ⓘ Cost ranges are severity-bucket heuristics (US national rule-of-thumb). Get contractor quotes + a written scope before underwriting a rehab budget.
Schools (NCES district)
- District
- Wayland Union Schools
- NCES district ID
- 2635550
- Math proficiency
- 45% ▼ -11.00%
- Reading proficiency
- 51% ▼ -5.00%
- Median HH income
- $58,432
- Composite
- 41.92/100
- National rank
- #3359
- State rank
- #110 of 540 in MI
Livability — Dorr
No livability data for this city. (Only ~50 U.S. cities are tracked.)
Census & demographics
- Population (ZIP)
- 13,607
Population outlook (Allegan County) Hauer SSP2
- Today (2025)
- 120,251 people
- By 2030
- 122,204 · +1.6%
- By 2040
- 123,979 · +3.1%
- By 2050
- 122,340 · +1.7%
- By 2075
- 116,088 · -3.5%
- By 2100
- 98,461 · -18.1%
Race, ethnicity, and origin ACS 2023
- Neighborhood character
- Predominantly White (88%)
- Race & ethnicity
- White 88% Two or more races 6% Hispanic / Latino 5% Black 2% Asian 2%
- Common ancestry
- Iranian 24% Romanian 6% Lithuanian 4%
- Foreign-born
- 2% · Canada
- Languages at home
- 96% English-only · Spanish 2% Vietnamese 1%
Political lean MEDSL · Allegan
- 2024 margin
- Strong R (+27.2) · D 35.7% · R 62.9% · Other 1.5%
- 2008→2024 swing
- -16.5pp toward R · 2008: -10.7pp · 2024: -27.2pp
- All cycles
- 2024: R+27.2 2020: R+25.2 2016: R+28.8 2012: R+19.2 2008: R+10.7
Not yet ingested
- Civics
- —
Market trends
- HPI YoY
- ▼ -150.52%
- Current HPI
- 251.5261
- Rent YoY
- —
- Metro
- —
- State GDP YoY
- ▲ 1.37%
- F500 in state
- 28
Industry mix (Fortune 500 HQ in MI)
| Industry | F500 HQs | Revenue |
|---|---|---|
| Automotive Parts | 3 | $48B |
|
||
| Automotive | 2 | $372B |
|
||
| Chemicals | 1 | $45B |
|
||
| Automotive Retail | 1 | $29B |
|
||
| Healthcare / Medical Devices | 1 | $23B |
|
||
| Automotive Technology | 1 | $20B |
|
||
Price history
+0.0% since first listed3 events — show timeline
- 2026-06-02 Listed $48,000 MiRealSource-MiMLS
- 2026-06-02 Listed $48,000 REALCOMP
- 2026-06-02 Listed $48,000 SW Michigan MLS
Cash-flow waterfall
monthlySold comps — $/sqft
last 12 mo · ≤1 miLoading sold comps…