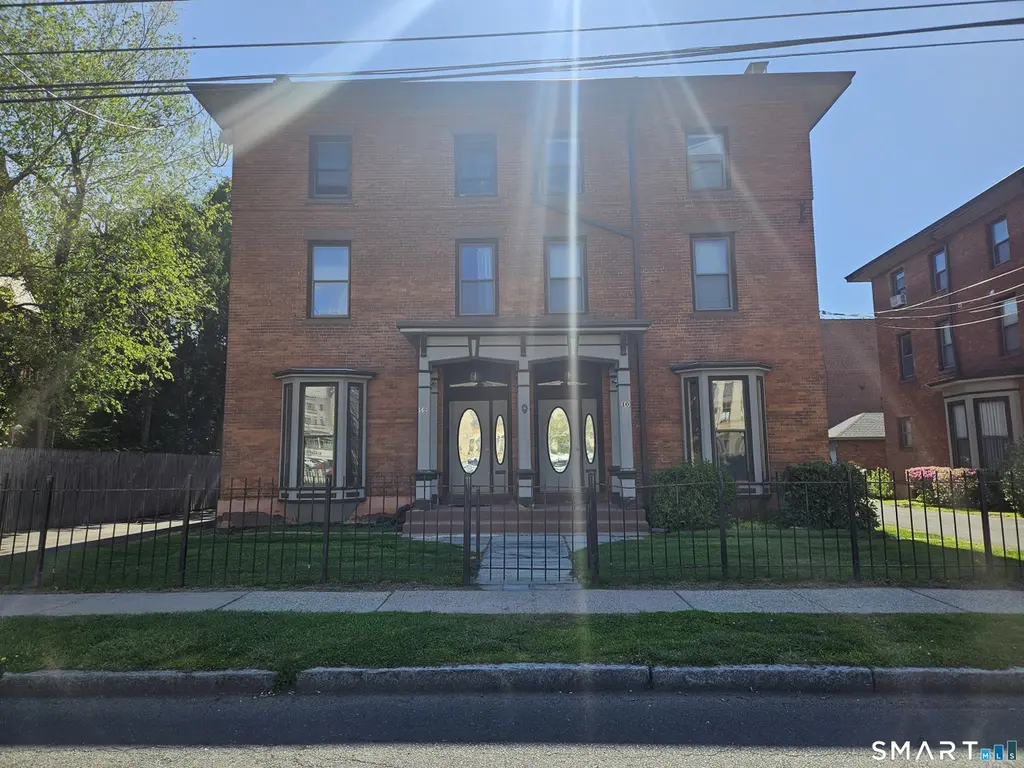
10 Atwood St Unit 10A · Hartford, CT
Flood risk 1/10 · Minimal
- FEMA flood zone
- X (unshaded)
- Chance of flooding over 30 yrs
- 0.0%
- Est. flood insurance / yr
- $507 – $1,088
Fire risk 1/10 · Minimal
- Est. fire insurance / yr
- $829 – $1,539
Heat risk 5/10 · Moderate
- Hot days now (above 97°F)
- 7 days/yr
- Hot days in 30 yrs
- 16 days/yr
Wind risk 6/10 · Moderate
- Chance of severe wind over 30 yrs
- 27.0%
Air-quality risk 3/10 · Minor
- Unhealthy air days now
- 3 days/yr
- Unhealthy air days in 30 yrs
- 4 days/yr
Risk factors via First Street. Map © Google.
Why this score? — see what drove the B- grade
The composite is a weighted blend of 9 inputs, each scored 0–100. Each bar is that input's sub-score; the figure is the points it added to the 100-point composite (weight × sub-score).
- Cash flow +28.0/30.0
- 1% rule +10.0/10.0
- DSCR +9.9/10.0
- ARV discount +7.5/15.0
- Rent growth +4.2/5.0
- Livability +3.8/5.0
- Condition / age +2.8/5.0
- Schools +1.4/10.0
- Appreciation +0.0/10.0
$129,900
🖨 Deal sheet 📄 Offer letter ✓ Due diligence
Listing remarks
Very nice 2 bedroom 2 full bath steps away from St. Francis Hospital. Washer and dryer located upstairs in primary bedroom. With a one car detached garage. Come see this unit before it's gone. Subject to probate approval. SOLD AS-IS. Best and final offer by Tuesday May 19, 2026 at 5pm.
Key facts
- $400 HOA
- Garage
- Built 1875
Neighborhood map
What this means for you Summary
Snapshot
- This is a 2-bed/2.0-bath condo listed at $130k. Condition is rated average.
Deal economics
- At list price, monthly cash flow is $402 ($5k/yr) — positive.
- The deal already cash-flows at list — no discount required.
- Meets the 1% rule at list price ($2k rent vs $130k).
Location & tenants
- Location reads 76/100 on livability (#58 in CT, #3,553 nationally) — a middle-class / working-renter tenant base. Strengths: amenities A+, commute A+, health & safety A+; Watch: schools D-, crime F, employment F.
- Hartford School District (urban): math 13% / reading 21% proficiency, ranked #150 of 153 in CT (top 98%) — low school quality limits family demand, transient renter base, plan for 1-2y turnover; 84% free/reduced lunch — lower-income household profile, screen leases tightly.
- Market conditions: Rents rising fast (+6.7%/yr); 47 active listings in the ZIP; 16 comparable units currently listed for rent nearby; rentals leasing fast (median 11d on market — plan ~1-2 weeks tenant-placement turnaround); lower-income renter base — watch delinquency; 1,867 units permitted in Capitol Planning Region in 2024 (1,399 in 5+ unit buildings).
- At $2,152/mo this rent would consume 62% of the median local household income ($42k/yr) (locally 2389% of renters already pay >50% of income on rent) — very limited rent-growth headroom before tenants either downsize or default.
Forward outlook
- Local home prices are declining (-3.0%/yr); year-one equity from $898 of loan paydown is wiped out by about $4k of value loss. Plan a longer hold.
- At projected returns (-3.0% appreciation + 6.7% rent growth), your $36k cash investment doubles in ~7 years — after that, you're playing with house money.
Negotiation context
- Only 6 days on market — expect competitive offers; lowballing is unlikely to land.
Risks & watch-outs
- Watch-outs: built in 1875 — expect roof / HVAC / electrical / plumbing capex.
- Climate carrying-cost: major wind risk, 27% chance of damaging wind over 30y; extreme-heat days projected 7→16/yr by 2055 (HVAC capex compounding) — expect insurance premiums to compound above CPI over the hold.
Questions for the listing agent
- Built in 1875 — when were the roof, HVAC, electrical panel, plumbing, and water heater last replaced?
- What does the HOA fee cover, when was the last increase, and are there any pending special assessments or reserve-fund shortfalls?
- Any open or pending special assessments — roof, HVAC, plumbing, elevator, façade? What's the per-unit balance and payoff schedule, and is the seller paying it off at close or rolling it to the buyer?
- Is there a deadline driving the sale (1031 exchange, divorce, estate, relocation)? That informs how much negotiation room exists.
- Schools are D-rated, which usually means shorter tenancies and higher turnover. Who's the typical renter profile here, and what's been the actual vacancy rate?
- Crime grade is F in this area — have there been break-ins, vandalism, or insurance claims at this property in the last 3 years? What carrier currently insures it and at what premium?
- What's the average days-on-market for RENTAL listings here right now (not sales)? A rising rental-DOM trend means longer vacancies and softer asking-rent achievability than the comps imply.
- What's the recent tenant-quality profile in this submarket — average credit score on applications, eviction rate, late-payment / NSF rate, and stable-employment percentage? A property-management company in the area should have these aggregated.
- How much new apartment / multifamily construction is in the pipeline within 1–3 miles? Heavy new supply (>2% of stock underway) typically softens rents 12–24 months out; light construction supports rent growth.
Investment metrics
- 1% rule
- 1.66% ✓
- Cap rate
- 10.01%
- Cash-on-cash
- 13.27%
- DSCR
- 1.59
- GRM
- 5.0
CMA / ARV
- ARV (median comp)
- $363,555
- List price
- $129,900
- Delta
- -64.27%
- Verdict
- UNDERPRICED
- Comps
- 20 within 2.0 mi
Projected returns pro-forma
-3.0% appreciation · 6.73% rent growth · sell at horizon
- IRR
- 8.8%
- Equity multiple
- 1.36×
- Total profit
- $13,228
- Equity at exit
- $19,369
- IRR
- 21.7%
- Equity multiple
- 3.28×
- Total profit
- $82,767
- Equity at exit
- $11,231
Cash invested: $36,372 (down + closing). Projections, not guarantees.
Landlord ↔ Tenant lean methodology
- Overall (STATE)
- 27 Tenant-Leaning
- State Connecticut
- 27 Tenant-Leaning · D+7
- County
- — inherits STATE
- City
- — inherits STATE
ZIP-level market 06105
- Home prices YoY
- -25.6%
- Rents YoY
- 6.7%
- Active inventory
- 47
- Price-to-rent
- 5.0×
Monthly cashflow live
- Estimated rent
- $2,152 high interval (Pro) →
- Mortgage (P&I)
- −$681
- Tax est. 1.5%
- −$162 /mo · $1,948/yr
- Insurance
- −$54
- HOA
- −$400
- Vacancy / Maint / Mgmt
- −$452
- Net cashflow
- $402
Break-even live
UW: 25.0% down · 7.5% · 30yr · 1.5% tax · 5.0% vac · 8.0% maint · 8.0% mgmt
Financing live
Cash to close
- Down payment
- $32,475
- Closing costs
- $3,897
- Reserves months
- —
- Total cash needed
- —
Loan-product check · same deal, 3 products live
Conventional
25% down · 7.5% · 30yr
- Down + closing
- —
- Monthly P&I
- —
- Monthly cashflow
- —
- DSCR
- —
- Eligible?
- —
Personal DTI + credit; lowest rate.
DSCR
20% down · 8.5% · 30yr
- Down + closing
- —
- Monthly P&I
- —
- Monthly cashflow
- —
- DSCR
- —
- Eligible?
- —
No personal income docs; deal must DSCR.
Hard money
10% down · 12.0% · 12mo
- Down + closing
- —
- Monthly P&I
- —
- Monthly cashflow
- —
- DSCR
- —
- Eligible?
- —
Short-term bridge; refi at stabilization.
Rent comps 16 comps
| Address | Beds | Baths | Sqft | Rent | $/sqft | DOM | Units | Dist |
|---|---|---|---|---|---|---|---|---|
| 164 Whitney St Hartford, CT | 3.0 | 2.0 | 1600 | $2,800 | $1.75 | 3d | 1 | 0.75mi |
| 55 Trumbull St Hartford, CT | 1.0–2.0 | 1.0–2.0 | 1015 | $1,995 | $1.97 | 10d | 8 | 1.14mi |
| 1143 Main St Hartford, CT | 3.0 | 1.0–2.0 | 962 | $2,994 | $3.11 | 3d | 203 | 1.15mi |
| 15 Highland St #305 West Hartford, CT | 2.0 | 2.0 | 1285 | $2,800 | $2.18 | 44d | 1 | 1.18mi |
| 1212 Main St Hartford, CT | 2.0 | 1.0–2.0 | 766 | $3,027 | $3.95 | 3d | 18 | 1.24mi |
| 915 Main St Hartford, CT | 1.0–2.0 | 1.0–2.0 | 1415 | $1,940 | $1.37 | 3d | 5 | 1.26mi |
| 100 Wells St Hartford, CT | 2.0 | 1.0–1.5 | 950 | $2,250 | $2.37 | 24d | 1 | 1.27mi |
| 21 Temple St Hartford, CT | 4.0 | 1.0–2.5 | 836 | $1,532 | $1.83 | 10d | 8 | 1.29mi |
| 711 Farmington Ave West Hartford, CT | 1.0–2.0 | 1.0–1.5 | 975 | $1,950 | $2.00 | 24d | 4 | 1.32mi |
| 167 Seymour St Hartford, CT | 3.0–4.0 | 1.0 | 1000 | $2,025 | $2.02 | 24d | 3 | 1.36mi |
| 158 Seymour St Hartford, CT | 3.0 | 1.0 | 1114 | $2,025 | $1.82 | 24d | 2 | 1.38mi |
| 160 Wooster St Hartford, CT | 3.0 | 1.0 | 1200 | $2,080 | $1.73 | 2d | 1 | 1.38mi |
| 3 Arnoldale Rd West Hartford, CT | 1.0–3.0 | 1.0 | 1050 | $2,390 | $2.28 | 10d | 4 | 1.44mi |
| 57 Park St Hartford, CT | 3.0 | 1.0 | 915 | $1,900 | $2.08 | 2d | 2 | 1.45mi |
| 250 Main St Hartford, CT | 1.0–2.0 | 1.0–2.0 | 725 | $2,000 | $2.76 | 24d | 4 | 1.46mi |
| 1 Park Rd West Hartford, CT | 2.0 | 1.0–2.0 | 913 | $3,647 | $3.99 | 3d | 18 | 1.47mi |
HOA detail condo
- Monthly dues
- $400 · $4,800/yr
- Assessments
- None detected in remarks — confirm with the listing agent.
Listing history 1 events
-
2026-05-14$129,900 Active 232-char remark
ⓘ Source: listings_history table (triggers on properties + properties_extension) + one-shot
backfill from property_details.listing_events for pre-trigger history.
Climate risk First Street
- Flood 1/10 Low FEMA zone X (unshaded) · 0% chance over 30 yrs
- Wildfire 1/10 Low
- Heat 5/10 Major 7 d/yr ≥97°F today · 16 d/yr by 30 yrs out
- Wind 6/10 Major 27% chance of damaging wind over 30 yrs
- Air quality 3/10 Moderate 3 unhealthy d/yr today · 4 by 30 yrs out
Nearby sold comps map
Loading sold comps map…
Walkable amenities ~0.75 mi
Loading nearby amenities…
Taxation est. · year 1
- Rental income
- $25,822
- − Mortgage interest
- −$7,276
- − Property taxes
- −$1,948
- − Insurance
- −$650
- − Repairs & maintenance
- −$2,066
- − Management
- −$2,066
- − HOA
- −$4,800
- − Depreciation
- −$3,779
- Taxable income
- $3,238
- Est. tax owed @ 24.0%
- −$777
- After-tax cash flow
- $4,050/yr
For passive investors: Depreciation is non-cash, so a rental often shows a tax loss while cash-flowing — sheltering income. Rental losses are passive: they offset passive income freely, and up to $25,000/yr can offset ordinary (W-2) income if you actively participate and your MAGI is under $100k (phasing out to $0 by $150k); unused losses carry forward. On sale, claimed depreciation is recaptured at up to 25%, and gains may owe capital-gains tax (a 1031 exchange can defer both). Figures are a year-1 estimate at your 24.0% rate — not tax advice; consult a CPA.
Condition & rehab AI · 6 photos
A moderate rehab project is needed to improve the exterior and interior appearance, enhancing both resale and rental value.
Repairs flagged
- Minor exterior paint — Some discoloration
- Minor interior paint — Some discoloration
- Minor landscaping — Needs trimming
Value-add opportunities
- Both Paint exterior and interior — Enhances curb appeal and interior aesthetics
- Both Landscaping — Improves curb appeal and enhances property value
- Rental HVAC maintenance — Ensures comfort and reduces utility costs
Renovation cost estimate screening
| Repair item | Severity | Est. cost |
|---|---|---|
| exterior paint · Some discoloration | Minor | $500–3,000 |
| interior paint · Some discoloration | Minor | $500–3,000 |
| landscaping · Needs trimming | Minor | $500–3,000 |
| Total estimated repair cost · 3 items | $1,500–9,000 |
Value-add ROI direction
- Both Paint exterior and interior — Enhances curb appeal and interior aesthetics ↑
- Both Landscaping — Improves curb appeal and enhances property value ↑
- Rental HVAC maintenance — Ensures comfort and reduces utility costs ↑
ⓘ Cost ranges are severity-bucket heuristics (US national rule-of-thumb). Get contractor quotes + a written scope before underwriting a rehab budget.
Schools (NCES district)
- District
- Hartford School District
- NCES district ID
- 0901920
- Math proficiency
- 13% ▼ -5.00%
- Reading proficiency
- 21% ▼ -6.00%
- Median HH income
- $30,521
- Composite
- 13.54/100
- National rank
- #9514
- State rank
- #150 of 153 in CT
Livability — Hartford
- Score
- 76/100
- State rank
- #58
- US rank
- #3553
Category grades
Schools grade is shown separately in the Schools card above.
Census & demographics
- Census place
- Hartford, CT
- County
- Hartford County · 754,208 people
- City population
- 121,162
- Metro
- Hartford-East Hartford-Middletown, CT
- Population (ZIP)
- 19,174
- Household income
- $41,937
- Rent vs Own
- Severe rent burden
- 2389.0
Population outlook (Capitol County) Hauer SSP2
- By 2040
- 1,063,519
Race, ethnicity, and origin ACS 2023
- Neighborhood character
- Highly diverse neighborhood (Simpson 0.71)
- Race & ethnicity
- Black 39% White 28% Hispanic / Latino 26% Two or more races 14% Asian 2%
- Hispanic origin (detail)
- Puerto Rican 18% Cuban 1% Dominican 3%
- Common ancestry
- Romanian 3% Lithuanian 2% Estonian 1%
- Foreign-born
- 20% · Canada, United Kingdom
- Languages at home
- 74% English-only · Spanish 18% Other Indo-European 3% French/Haitian/Cajun 2%
Political lean MEDSL · Capitol
- 2024 margin
- Strong D (+21.9) · D 60.1% · R 38.2% · Other 1.7%
- All cycles
- 2024: D+21.9
Not yet ingested
- Civics
- —
Market trends
- HPI YoY
- ▼ -59.58%
- Current HPI
- 173.3602
- Rent YoY
- ▲ 6.73%
- Metro
- Hartford-East Hartford-Middletown, CT
- State GDP YoY
- ▲ 1.06%
- F500 in state
- 38
Industry mix (Fortune 500 HQ in CT)
| Industry | F500 HQs | Revenue |
|---|---|---|
| Industrial Machinery | 4 | $38B |
|
||
| Insurance | 3 | $71B |
|
||
| Financial Services | 2 | $25B |
|
||
| Transportation / Logistics | 2 | $18B |
|
||
| Healthcare | 1 | $247B |
|
||
| Telecommunications | 1 | $55B |
|
||
Price history
2 events — show timeline
- 2026-05-20 Pending — Smart MLS
- 2026-05-14 Listed $129,900 Smart MLS
Cash-flow waterfall
monthlySold comps — $/sqft
last 12 mo · ≤1 miLoading sold comps…