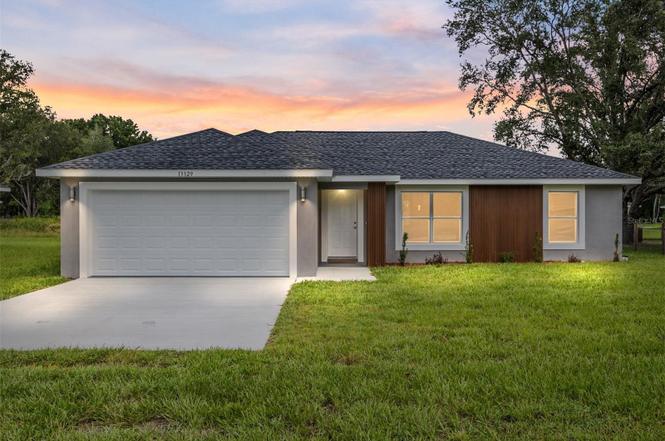
13329 SW 106 St · On Top of the World, FL
Flood risk 1/10 · Minimal
- FEMA flood zone
- X (unshaded)
- Chance of flooding over 30 yrs
- 0.0%
- Est. flood insurance / yr
- $507 – $1,088
Fire risk 3/10 · Minor
- Est. fire insurance / yr
- $947 – $1,759
Heat risk 8/10 · Major
- Hot days now (above 107°F)
- 7 days/yr
- Hot days in 30 yrs
- 23 days/yr
Wind risk 9/10 · Severe
- Chance of severe wind over 30 yrs
- 99.0%
Air-quality risk 3/10 · Minor
- Unhealthy air days now
- 3 days/yr
- Unhealthy air days in 30 yrs
- 3 days/yr
Risk factors via First Street. Map © Google.
Why this score? — see what drove the D- grade
The composite is a weighted blend of 9 inputs, each scored 0–100. Each bar is that input's sub-score; the figure is the points it added to the 100-point composite (weight × sub-score).
- Cash flow +14.0/30.0
- ARV discount +6.3/15.0
- DSCR +4.2/10.0
- Schools +3.6/10.0
- 1% rule +2.6/10.0
- Rent growth +2.5/5.0
- Livability +2.5/5.0
- Condition / age +2.5/5.0
- Appreciation +0.0/10.0
$230,999
🖨 Deal sheet (PDF) 📄 Offer letter ✓ Due diligence
Listing remarks
Country living at its finest! New home on an undeveloped road. Be among the first to experience the charm of this brand-new construction home “Magnolia” Model by Bakan Homes. This beautifully designed home offers a fusion of modern comfort that’s perfect for families, first-time homebuyers, or anyone looking for a fantastic investment opportunity. With 8’ ceilings in the bedrooms and vaulted ceilings in the social areas, this home welcomes you with a sense of openness and comfort. The heart of this home boasts wood soft-close cabinets, elegant quartz countertops, and top-of-the-line stainless steel appliances, including a dishwasher. It's a chef's dream! Enjoy the li
Key facts
- Quartz countertops
- Ceiling fans
- Recessed lighting
Tags
Neighborhood map
What this means for you Summary
Snapshot
- This is a 3-bed/2.0-bath single-family listed at $231k.
Deal economics
- At list price, monthly cash flow is $29 ($344/yr) — positive.
- The deal already cash-flows at list — no discount required.
- To meet the 1% rule (rent ≥ 1% of price), the offer needs to be $175k (24.4% below list).
- Recommended offer: $175k (24.4% below list) — sets the bar for 1% rule.
- Cap rate 6.4% vs local median 2.9% in On Top of the World — top-decile yield for the area; either an underpriced asset or a hidden risk that comps aren't pricing in. Stress-test before assuming the spread holds.
Location & tenants
- Location reads: area grade D — affects rentability + tenant quality, not the cash-flow math above.
- Marion (rural): math 42% / reading 43% proficiency, ranked #61 of 73 in FL (top 84%) — families likely to look elsewhere, expect single-tenant / working-renter base with shorter leases; 61% free/reduced lunch — lower-income household profile, screen leases tightly.
- Zoned schools: Dunnellon Elementary School (math 46% / reading 48%, grade D-, #1,191 of 2,144 statewide, top 57%, 580 students, 61% FRL); Dunnellon Middle School (math 48% / reading 42%, grade D, #310 of 571 statewide, top 56%, 678 students, 68% FRL); Dunnellon High School (math 30% / reading 32%, grade F, #429 of 667 statewide, top 65%, 1,350 students, 63% FRL) — zoned schools at 64% FRL track the district average.
- Market conditions: 557 active listings in the ZIP; 10 comparable units currently listed for rent nearby; rentals at typical pace (median 23d on market — plan ~3-4 weeks tenant-placement turnaround); 7,071 units permitted in Marion County in 2024 (534 in 5+ unit buildings).
Forward outlook
- Local home prices are declining (-3.0%/yr); year-one equity from $2k of loan paydown is wiped out by about $7k of value loss. Plan a longer hold.
- Marion County population projected at +13% by 2050 — modest demand growth; plan on rents tracking national, not racing it.
Negotiation context
- It's been on market 354 days — a 12% lower offer ($203k) is reasonable based on typical stale-listing flexibility.
- 3 sale attempts; this cycle's ask has dropped $14k (6%) from the opening price — seller is motivated, your offer sets the floor, not the list.
- Current owner paid $20k; list at $231k implies a 1055% gain — meaningful room to come down on a strong offer.
Risks & watch-outs
- Climate carrying-cost: severe wind risk, 99% chance of damaging wind over 30y; extreme-heat days projected 7→23/yr by 2055 (HVAC capex compounding) — expect insurance premiums to compound above CPI over the hold.
Questions for the listing agent
- It's been on market 354 days. Have you received any prior offers? Is the seller open to a 24% concession, seller financing, or rate buy-down credit?
- Why hasn't it sold? Are there any deal-killer items the seller is aware of (foundation, flood, title, zoning, code violations)?
- Is there a deadline driving the sale (1031 exchange, divorce, estate, relocation)? That informs how much negotiation room exists.
- The area grade is low — what's the realistic commute time and amenity access for the typical tenant pool here? Any planned neighborhood developments (good or bad) we should know about?
- What's the average days-on-market for RENTAL listings here right now (not sales)? A rising rental-DOM trend means longer vacancies and softer asking-rent achievability than the comps imply.
- What's the recent tenant-quality profile in this submarket — average credit score on applications, eviction rate, late-payment / NSF rate, and stable-employment percentage? A property-management company in the area should have these aggregated.
- How much new for-sale + rental construction is in the pipeline within 1–3 miles? Heavy new supply typically softens prices + rents 12–24 months out; constrained supply supports both.
Investment metrics
- 1% rule
- 0.76% ✗
- Cap rate
- 6.44%
- Cash-on-cash
- 0.53%
- DSCR
- 1.02
- GRM
- 11.0
CMA / ARV
- ARV (on-the-fly)
- $224,992
- Comps found
- 12
Show comp detail 12 sales within ~0.75 mi
| Address | Dist | Beds/Ba | Sqft | Sold | Price | $/sf | Match |
|---|---|---|---|---|---|---|---|
| 13336 SW 106th Pl | 0.09mi | 3/2.0 | 1,232 (-2%) | 2mo | $214,900 | $174 | 90 |
| 10470 SW 132nd Ct | 0.13mi | 3/2.0 | 1,260 (-0%) | 12mo | $265,000 | $210 | 84 |
| 13256 SW 106th St | 0.08mi | 3/2.0 | 1,393 (+10%) | 3mo | $239,000 | $172 | 77 |
| 13286 SW 104th Ln | 0.10mi | 3/2.0 | 1,377 (+9%) | 9mo | $270,000 | $196 | 73 |
| 13303 SW 106th Pl | 0.06mi | 3/2.0 | 1,400 (+11%) | 12mo | $280,000 | $200 | 69 |
| 13381 SW 106th Pl | 0.08mi | 3/2.0 | 1,397 (+10%) | 20mo | $290,000 | $208 | 62 |
| 10434 SW 133rd Ave | 0.39mi | 3/2.0 | 1,399 (+11%) | 11mo | $249,000 | $178 | 55 |
| 13630 SW 108th St | 0.40mi | 3/2.0 | 1,434 (+13%) | 7mo | $210,000 | $146 | 53 |
| 13255 SW 112th St | 0.63mi | 3/2.0 | 1,399 (+11%) | 13mo | $247,500 | $177 | 42 |
| 13251 SW 100th Ln | 0.55mi | 3/2.0 | 1,089 (-14%) | 20mo | $229,500 | $211 | 35 |
| 10150 SW 138th Ct | 0.68mi | 3/2.0 | 1,400 (+11%) | 19mo | $249,000 | $178 | 34 |
| 13370 SW 112th Pl | 0.71mi | 3/2.0 | 1,433 (+13%) | 16mo | $248,000 | $173 | 31 |
Match score weights: distance 35% · size 25% · config 20% · recency 20%. Top-matched comps best support the ARV.
Projected returns pro-forma
-3.0% appreciation · 3.0% rent growth · sell at horizon
- IRR
- -15.5%
- Equity multiple
- 0.45×
- Total profit
- $-35,733
- Equity at exit
- $34,443
- IRR
- -7.1%
- Equity multiple
- 0.55×
- Total profit
- $-29,275
- Equity at exit
- $19,973
Cash invested: $64,680 (down + closing). Projections, not guarantees.
Landlord ↔ Tenant lean methodology
- Overall (STATE)
- 87 Strongly Landlord-Friendly
- State Florida
- 87 Strongly Landlord-Friendly · R+3
- County
- — inherits STATE
- City
- — inherits STATE
ZIP-level market 34432
- Home prices YoY
- -21.5%
- Active inventory
- 557
- Price-to-rent
- 11.0×
Monthly cashflow live
- Estimated rent
- $1,745 high interval (Pro) →
- Mortgage (P&I)
- −$1,211
- Tax from tax record
- −$43 /mo · $510/yr
- Insurance
- −$96
- HOA
- −$0
- Vacancy / Maint / Mgmt
- −$367
- Net cashflow
- $29
Break-even live
Sensitivity live
| Price | -10% $159 | -5% $94 | +0% $29 | +5% $-37 | +10% $-102 |
|---|---|---|---|---|---|
| Rent | -10% $-109 | -5% $-40 | +0% $29 | +5% $98 | +10% $167 |
| Rate | -1.0pp $145 | -0.5pp $87 | base $29 | +0.5pp $-31 | +1.0pp $-92 |
UW: 25.0% down · 7.5% · 30yr · 1.5% tax · 5.0% vac · 8.0% maint · 8.0% mgmt
Financing live
Cash to close
- Down payment
- $57,750
- Closing costs
- $6,930
- Reserves months
- —
- Total cash needed
- —
Loan-product check · same deal, 3 products live
Conventional
25% down · 7.5% · 30yr
- Down + closing
- —
- Monthly P&I
- —
- Monthly cashflow
- —
- DSCR
- —
- Eligible?
- —
Personal DTI + credit; lowest rate.
DSCR
20% down · 8.5% · 30yr
- Down + closing
- —
- Monthly P&I
- —
- Monthly cashflow
- —
- DSCR
- —
- Eligible?
- —
No personal income docs; deal must DSCR.
Hard money
10% down · 12.0% · 12mo
- Down + closing
- —
- Monthly P&I
- —
- Monthly cashflow
- —
- DSCR
- —
- Eligible?
- —
Short-term bridge; refi at stabilization.
Rent comps 10 comps
| Address | Beds | Baths | Sqft | Rent | $/sqft | DOM | Units | Dist |
|---|---|---|---|---|---|---|---|---|
| 13439 SW 106th Pl Dunnellon, FL | 3.0 | 2.0 | 1397 | $1,700 | $1.22 | 23d | 1 | 0.09mi |
| 13469 SW 106th St Dunnellon, FL | 3.0 | 2.0 | 1226 | $1,750 | $1.43 | 23d | 1 | 0.12mi |
| 10426 SW 133rd Ave Dunnellon, FL | 3.0 | 2.0 | 1555 | $1,850 | $1.19 | 15d | 1 | 0.18mi |
| 10711 SW 136th Court Rd Dunnellon, FL | 2.0 | 1.0 | 928 | $1,450 | $1.56 | 23d | 1 | 0.32mi |
| 13373 SW 111th Ln Dunnellon, FL | 3.0 | 2.0 | 1555 | $1,650 | $1.06 | 15d | 1 | 0.54mi |
| 13359 SW 112th St Dunnellon, FL | 3.0 | 2.0 | 1127 | $1,750 | $1.55 | 23d | 1 | 0.60mi |
| 13527 SW 100th Ln Dunnellon, FL | 3.0 | 2.0 | 1352 | $2,100 | $1.55 | 23d | 1 | 0.62mi |
| 13669 SW 113th Pl Dunnellon, FL | 3.0 | 2.0 | 1397 | $1,650 | $1.18 | 15d | 1 | 0.78mi |
| 13775 SW 115 Pl Unit 1331069P Dunnellon, FL | 3.0 | 2.0 | 1399 | $9,815 | $7.02 | 23d | 1 | 1.04mi |
| 12412 SW 98th St Dunnellon, FL | 3.0 | 2.0 | 1648 | $2,200 | $1.33 | 23d | 1 | 1.24mi |
Listing history 18 events
-
2026-04-07status Pending
-
2026-03-14price $230,999
-
2026-02-22price $231,499
-
2026-02-11status Active
-
2026-02-03historical
-
2026-01-26price $231,900
-
2026-01-05price $232,900
-
2025-11-16price $234,900
-
2025-10-08price $235,900
-
2025-09-18price $236,900
-
2025-09-11price $237,800
-
2025-08-22price $237,900
-
2025-07-24price $239,900
-
2025-05-16price $242,900
-
2025-05-06status Active
-
2025-03-21$244,900 Active
-
2004-09-30soldstatus $20,000
-
2004-08-25soldstatus $20,000
ⓘ Source: listings_history table (triggers on properties + properties_extension) + one-shot
backfill from property_details.listing_events for pre-trigger history.
Tax reassessment forecast FL · Resets to sale price
- Current annual tax
- $510 · $43/mo
- Projected year-2 tax
- $1,917 · $160/mo
- Expected delta
- +$1,407/yr (+$117/mo · 275.7%)
ⓘ Screening estimate from a state-policy table — verify with the county assessor before closing.
Climate risk First Street
- Flood 1/10 Low FEMA zone X (unshaded) · 0% chance over 30 yrs
- Wildfire 3/10 Moderate
- Heat 8/10 Severe 7 d/yr ≥107°F today · 23 d/yr by 30 yrs out
- Wind 9/10 Extreme 99% chance of damaging wind over 30 yrs
- Air quality 3/10 Moderate 3 unhealthy d/yr today · 3 by 30 yrs out
Nearby sold comps map
Loading sold comps map…
Walkable amenities ~0.75 mi
Loading nearby amenities…
Taxation est. · year 1
- Rental income
- $20,944
- − Mortgage interest
- −$12,940
- − Property taxes
- −$510
- − Insurance
- −$1,155
- − Repairs & maintenance
- −$1,675
- − Management
- −$1,675
- − Depreciation
- −$6,720
- Taxable loss
- −$3,732
- Est. tax savings @ 24.0%
- +$896
- After-tax cash flow
- $1,239/yr
For passive investors: Depreciation is non-cash, so a rental often shows a tax loss while cash-flowing — sheltering income. Rental losses are passive: they offset passive income freely, and up to $25,000/yr can offset ordinary (W-2) income if you actively participate and your MAGI is under $100k (phasing out to $0 by $150k); unused losses carry forward. On sale, claimed depreciation is recaptured at up to 25%, and gains may owe capital-gains tax (a 1031 exchange can defer both). Figures are a year-1 estimate at your 24.0% rate — not tax advice; consult a CPA.
Schools (NCES district)
- District
- Marion
- NCES district ID
- 1201260
- Math proficiency
- 42% ▼ -7.00%
- Reading proficiency
- 43% ▼ -4.00%
- Median HH income
- $40,015
- Composite
- 35.61/100
- National rank
- #4890
- State rank
- #61 of 73 in FL
Livability — On Top of the World
No livability data for this city. (Only ~50 U.S. cities are tracked.)
Census & demographics
- City population
- 25,668
- Population (ZIP)
- 13,197
Population outlook (Marion County) Hauer SSP2
- Today (2025)
- 365,905 people
- By 2030
- 376,768 · +3.0%
- By 2040
- 396,555 · +8.4%
- By 2050
- 412,723 · +12.8%
- By 2075
- 446,090 · +21.9%
- By 2100
- 436,193 · +19.2%
Race, ethnicity, and origin ACS 2023
- Neighborhood character
- Predominantly White (79%)
- Race & ethnicity
- White 79% Hispanic / Latino 16% Two or more races 11% Black 1%
- Hispanic origin (detail)
- Mexican 2% Puerto Rican 7% Cuban 2%
- Common ancestry
- Romanian 4% Slovak 3% Lithuanian 3%
- Foreign-born
- 8% · Canada
- Languages at home
- 90% English-only · Spanish 9% Other Indo-European 1%
Political lean MEDSL · Marion
- 2024 margin
- Solid R (+31.6) · D 33.8% · R 65.5%
- 2008→2024 swing
- -20.0pp toward R · 2008: -11.6pp · 2024: -31.6pp
- All cycles
- 2024: R+31.6 2020: R+25.9 2016: R+26.2 2012: R+16.2 2008: R+11.6
Not yet ingested
- Civics
- —
Market trends
- HPI YoY
- ▼ -57.34%
- Current HPI
- 209.595
- Rent YoY
- —
- Metro
- —
- State GDP YoY
- ▲ 3.28%
- F500 in state
- 36
Industry mix (Fortune 500 HQ in FL)
| Industry | F500 HQs | Revenue |
|---|---|---|
| Industrial Technology | 2 | $29B |
|
||
| Insurance | 2 | $17B |
|
||
| Retail | 1 | $60B |
|
||
| Technology Distribution | 1 | $58B |
|
||
| Homebuilding | 1 | $35B |
|
||
| Technology Manufacturing | 1 | $35B |
|
||
Price history
+1055.0% since first listed18 events — show timeline
- 2026-04-07 Pending — Stellar MLS as Distributed by MLS Grid
- 2026-03-14 Price Changed $230,999 Stellar MLS as Distributed by MLS Grid
- 2026-02-22 Price Changed $231,499 Stellar MLS as Distributed by MLS Grid
- 2026-02-11 Relisted — Stellar MLS as Distributed by MLS Grid
- 2026-02-03 Listing Removed — Stellar MLS as Distributed by MLS Grid
- 2026-01-26 Price Changed $231,900 Stellar MLS as Distributed by MLS Grid
- 2026-01-05 Price Changed $232,900 Stellar MLS as Distributed by MLS Grid
- 2025-11-16 Price Changed $234,900 Stellar MLS as Distributed by MLS Grid
- 2025-10-08 Price Changed $235,900 Stellar MLS as Distributed by MLS Grid
- 2025-09-18 Price Changed $236,900 Stellar MLS as Distributed by MLS Grid
- 2025-09-11 Price Changed $237,800 Stellar MLS as Distributed by MLS Grid
- 2025-08-22 Price Changed $237,900 Stellar MLS as Distributed by MLS Grid
- 2025-07-24 Price Changed $239,900 Stellar MLS as Distributed by MLS Grid
- 2025-05-16 Price Changed $242,900 Stellar MLS as Distributed by MLS Grid
- 2025-05-06 Relisted — Stellar MLS as Distributed by MLS Grid
- 2025-03-21 Listed $244,900 Stellar MLS as Distributed by MLS Grid
- 2004-09-30 Sold (Public Records) $20,000 Public Records
- 2004-08-25 Sold (Public Records) $20,000 Public Records
Property tax history
+14.8%/yrLatest (2025): $510 · +249.3% YoY. Source: county tax records.
Cash-flow waterfall
monthlySold comps — $/sqft
last 12 mo · ≤1 miLoading sold comps…