 🏷️ Likely Rental
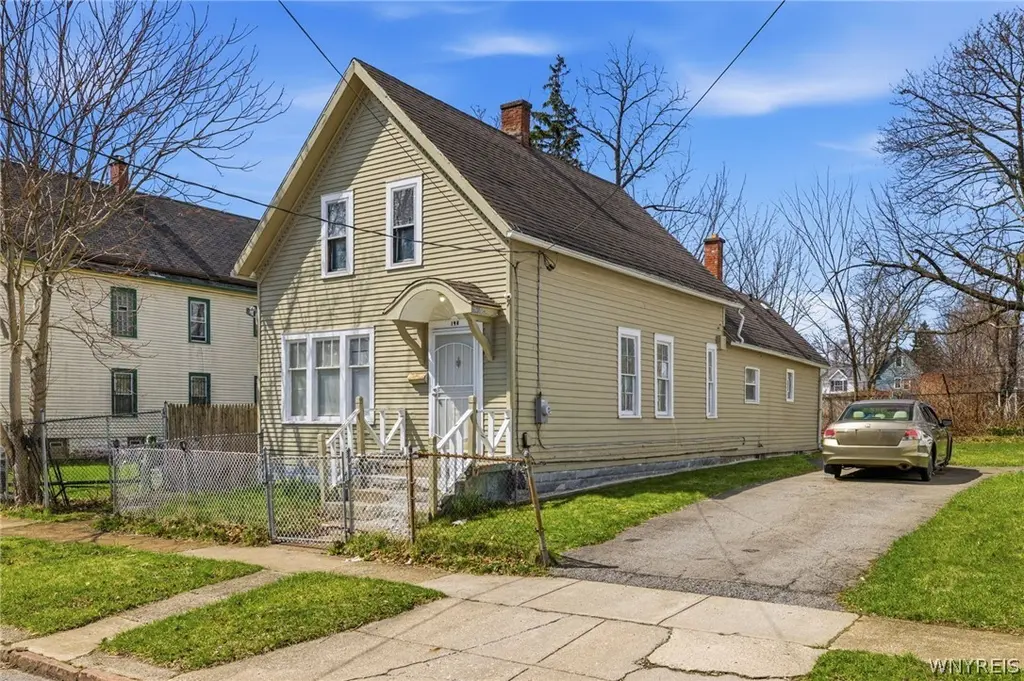
198 Grape St · Buffalo, NY
Flood risk 1/10 · Minimal
- FEMA flood zone
- X (unshaded)
- Chance of flooding over 30 yrs
- 0.0%
- Est. flood insurance / yr
- $473 – $860
Fire risk 1/10 · Minimal
- Est. fire insurance / yr
- $691 – $1,283
Heat risk 2/10 · Minimal
- Hot days now (above 91°F)
- 7 days/yr
- Hot days in 30 yrs
- 15 days/yr
Wind risk 1/10 · Minimal
- Chance of severe wind over 30 yrs
- —
Air-quality risk 4/10 · Minor
- Unhealthy air days now
- 4 days/yr
- Unhealthy air days in 30 yrs
- 9 days/yr
Risk factors via First Street. Map © Google.
Why this score? — see what drove the A- grade
The composite is a weighted blend of 9 inputs, each scored 0–100. Each bar is that input's sub-score; the figure is the points it added to the 100-point composite (weight × sub-score).
- Cash flow +30.0/30.0
- ARV discount +15.0/15.0
- 1% rule +10.0/10.0
- DSCR +10.0/10.0
- Rent growth +3.9/5.0
- Livability +3.9/5.0
- Appreciation +3.3/10.0
- Schools +3.3/10.0
- Condition / age +2.5/5.0
$99,900
🖨 Deal sheet 📄 Offer letter ✓ Due diligence
Listing remarks MLS
Currently, this single-family home is tenant-occupied; it can be delivered vacant at closing. Features 4 bedrooms, 1 full bathroom, a living room, a formal dining room, and a kitchen. Conveniently located in Buffalo’s historic Fruit Belt neighborhood, this property is just a minutes from the Medical Campus, hospitals, and downtown, with easy access to major routes and public transportation. Square footage differs from tax records; floor plan available.
Key facts
- 2,500 sq ft lot
- Built 1890
- Listed 69 days
Neighborhood map
What this means for you Summary
Snapshot
- This is a 2-bed/1.0-bath single-family listed at $100k.
Deal economics
- At list price, monthly cash flow is $970 ($12k/yr) — positive.
- The deal already cash-flows at list — no discount required.
- Meets the 1% rule at list price ($2k rent vs $100k).
- Recommended offer: $94k (6.0% below list) — sets the bar for market timing.
- Cap rate 17.9% vs local median 8.0% in Buffalo — top-decile yield for the area; either an underpriced asset or a hidden risk that comps aren't pricing in. Stress-test before assuming the spread holds.
Location & tenants
- Location reads 77/100 on livability (#195 in NY, #3,011 nationally) — a middle-class / working-renter tenant base. Strengths: commute A+, housing A+, health & safety A+; Watch: crime F, employment D-.
- Buffalo City School District (urban): math 41% / reading 40% proficiency, ranked #535 of 590 in NY (top 91%) — families likely to look elsewhere, expect single-tenant / working-renter base with shorter leases; 75% free/reduced lunch — lower-income household profile, screen leases tightly.
- Market conditions: Rents rising fast (+5.5%/yr); 33 active listings in the ZIP; 40 comparable units currently listed for rent nearby; rentals at typical pace (median 24d on market — plan ~3-4 weeks tenant-placement turnaround); 42% of comp listings sitting > 30 days — soft ceiling on asking rent; lower-income renter base — watch delinquency; 1,244 units permitted in Erie County in 2024 (563 in 5+ unit buildings).
- At $1,970/mo this rent would consume 84% of the median local household income ($28k/yr) (locally 945% of renters already pay >50% of income on rent) — very limited rent-growth headroom before tenants either downsize or default.
Forward outlook
- Local home prices are declining (-3.0%/yr); year-one equity from $691 of loan paydown is wiped out by about $3k of value loss. Plan a longer hold.
- At projected returns (-3.0% appreciation + 5.5% rent growth), your $28k cash investment doubles in ~3 years — after that, you're playing with house money.
Negotiation context
- It's been on market 69 days — a 6% lower offer ($94k) is reasonable based on typical stale-listing flexibility.
- 8 sale attempts since 4y ago with the ask held roughly flat each time — persistent listings suggest the price (not the market) is what's stuck; bring a comps-based counter.
- Current owner paid $80k; 25% above their basis — modest negotiation headroom, anchor on the comps not their cost.
Risks & watch-outs
- Watch-outs: built in 1890 — expect roof / HVAC / electrical / plumbing capex.
Questions for the listing agent
- It's been on market 69 days. Have you received any prior offers? Is the seller open to a 6% concession, seller financing, or rate buy-down credit?
- Built in 1890 — when were the roof, HVAC, electrical panel, plumbing, and water heater last replaced?
- Why hasn't it sold? Are there any deal-killer items the seller is aware of (foundation, flood, title, zoning, code violations)?
- Is there a deadline driving the sale (1031 exchange, divorce, estate, relocation)? That informs how much negotiation room exists.
- Crime grade is F in this area — have there been break-ins, vandalism, or insurance claims at this property in the last 3 years? What carrier currently insures it and at what premium?
- What's the average days-on-market for RENTAL listings here right now (not sales)? A rising rental-DOM trend means longer vacancies and softer asking-rent achievability than the comps imply.
- What's the recent tenant-quality profile in this submarket — average credit score on applications, eviction rate, late-payment / NSF rate, and stable-employment percentage? A property-management company in the area should have these aggregated.
- How much new for-sale + rental construction is in the pipeline within 1–3 miles? Heavy new supply typically softens prices + rents 12–24 months out; constrained supply supports both.
Investment metrics
- 1% rule
- 1.97% ✓
- Cap rate
- 17.94%
- Cash-on-cash
- 41.60%
- DSCR
- 2.85
- GRM
- 4.2
CMA / ARV
- ARV (median comp)
- $125,580
- List price
- $99,900
- Delta
- -20.45%
- Verdict
- UNDERPRICED
- Comps
- 20 within 1.0 mi
Show comp detail 10 sales within ~0.75 mi
| Address | Dist | Beds/Ba | Sqft | Sold | Price | $/sf | Match |
|---|---|---|---|---|---|---|---|
| 200 Locust St | 0.28mi | 3/1.0 (+1) | 1,217 (-2%) | 12mo | $95,000 | $78 | 70 |
| 513 High St | 0.33mi | 3/1.0 (+1) | 1,270 (+3%) | 7mo | $95,000 | $75 | 70 |
| 598 High St | 0.48mi | 3/1.0 (+1) | 1,139 (-8%) | 7mo | $115,000 | $101 | 54 |
| 232 Mulberry St | 0.30mi | 2/2.0 | 1,343 (+9%) | 19mo | $200,000 | $149 | 52 |
| 635 Jefferson Ave | 0.63mi | 3/1.5 (+1) | 1,330 (+8%) | 1mo | $220,000 | $165 | 50 |
| 164 Locust St | 0.33mi | 3/1.5 (+1) | 1,320 (+7%) | 21mo | $238,000 | $180 | 49 |
| 205 Mulberry St | 0.31mi | 2/1.0 | 1,056 (-15%) | 21mo | $115,000 | $109 | 43 |
| 70 Camp St | 0.48mi | 3/1.5 (+1) | 1,324 (+7%) | 21mo | $245,000 | $185 | 42 |
| 1319 Michigan Ave | 0.64mi | 3/1.5 (+1) | 1,301 (+5%) | 22mo | $155,000 | $119 | 36 |
| 1274 Michigan Ave | 0.59mi | 3/1.5 (+1) | 1,152 (-7%) | 23mo | $213,000 | $185 | 34 |
Match score weights: distance 35% · size 25% · config 20% · recency 20%. Top-matched comps best support the ARV.
Projected returns pro-forma
-3.0% appreciation · 5.48% rent growth · sell at horizon
- IRR
- 40.8%
- Equity multiple
- 2.81×
- Total profit
- $50,579
- Equity at exit
- $14,895
- IRR
- 48.2%
- Equity multiple
- 6.19×
- Total profit
- $145,184
- Equity at exit
- $8,638
Cash invested: $27,972 (down + closing). Projections, not guarantees.
Landlord ↔ Tenant lean methodology
- Overall (STATE)
- 15 Strongly Tenant-Friendly
- State New York
- 15 Strongly Tenant-Friendly · D+10
- County
- — inherits STATE
- City
- — inherits STATE
ZIP-level market 14204
- Home prices YoY
- -1.1%
- Rents YoY
- 5.5%
- Active inventory
- 33
- Price-to-rent
- 4.2×
Monthly cashflow live
- Estimated rent
- $1,970 high interval (Pro) →
- Mortgage (P&I)
- −$524
- Tax from tax record
- −$21 /mo · $252/yr
- Insurance
- −$42
- HOA
- −$0
- Vacancy / Maint / Mgmt
- −$414
- Net cashflow
- $970
Break-even live
UW: 25.0% down · 7.5% · 30yr · 1.5% tax · 5.0% vac · 8.0% maint · 8.0% mgmt
Financing live
Cash to close
- Down payment
- $24,975
- Closing costs
- $2,997
- Reserves months
- —
- Total cash needed
- —
Loan-product check · same deal, 3 products live
Conventional
25% down · 7.5% · 30yr
- Down + closing
- —
- Monthly P&I
- —
- Monthly cashflow
- —
- DSCR
- —
- Eligible?
- —
Personal DTI + credit; lowest rate.
DSCR
20% down · 8.5% · 30yr
- Down + closing
- —
- Monthly P&I
- —
- Monthly cashflow
- —
- DSCR
- —
- Eligible?
- —
No personal income docs; deal must DSCR.
Hard money
10% down · 12.0% · 12mo
- Down + closing
- —
- Monthly P&I
- —
- Monthly cashflow
- —
- DSCR
- —
- Eligible?
- —
Short-term bridge; refi at stabilization.
Rent comps 40 comps
| Address | Beds | Baths | Sqft | Rent | $/sqft | DOM | Units | Dist |
|---|---|---|---|---|---|---|---|---|
| 983 Michigan Ave Buffalo, NY | 2.0 | 1.0–2.0 | 804 | $3,202 | $3.98 | 2d | 58 | 0.37mi |
| 1145 Michigan Ave Buffalo, NY | 2.0 | 1.0–2.0 | 655 | $2,049 | $3.13 | 43d | 1 | 0.40mi |
| 1155 Main St Buffalo, NY | 2.0 | 1.0–2.0 | 592 | $2,300 | $3.88 | 43d | 1 | 0.66mi |
| 1152 Main St Apt 3 Buffalo, NY | 3.0 | 1.0 | 1000 | $2,400 | $2.40 | 14d | 1 | 0.69mi |
| 19 North St Buffalo, NY | 2.0 | 1.0–2.0 | 1306 | $2,910 | $2.23 | 10d | 7 | 0.71mi |
| 946 Main St Buffalo, NY | 1.0 | 1.0 | 700 | $1,000 | $1.43 | 43d | 1 | 0.73mi |
| 40 North St Unit 306 Buffalo, NY | 2.0 | 1.5 | 1125 | $1,950 | $1.73 | 43d | 1 | 0.75mi |
| 40 North St Unit 203 Buffalo, NY | 1.0 | 1.5 | 920 | $1,675 | $1.82 | 43d | 1 | 0.75mi |
| 40 North St Unit 102 Buffalo, NY | 1.0 | 1.5 | 702 | $1,350 | $1.92 | 2d | 1 | 0.75mi |
| 40 North St Unit 205A Buffalo, NY | 1.0 | 1.5 | 884 | $1,950 | $2.21 | 43d | 1 | 0.75mi |
| 40 North St Unit 204 Buffalo, NY | 1.0 | 1.5 | 936 | $1,650 | $1.76 | 43d | 1 | 0.75mi |
| 40 North St Unit 201 Buffalo, NY | 1.0 | 1.0 | 884 | $1,600 | $1.81 | 2d | 1 | 0.75mi |
| 130 Linwood Ave Buffalo, NY | 2.0 | 1.0 | 900 | $1,900 | $2.11 | 23d | 1 | 0.80mi |
| 628 Ellicott St Buffalo, NY | 1.0–2.0 | 1.0–2.0 | 1059 | $2,812 | $2.65 | 2d | 5 | 0.80mi |
| 499 Franklin St Apt 4 Buffalo, NY | 1.0 | 1.5 | 817 | $1,995 | $2.44 | 43d | 1 | 0.82mi |
| 499 Franklin St Unit 1 Buffalo, NY | 1.0 | 1.5 | 1067 | $2,930 | $2.75 | 43d | 1 | 0.82mi |
| 17 N Pearl St Buffalo, NY | 2.0 | 2.0 | 1077 | $2,700 | $2.51 | 23d | 1 | 0.83mi |
| 17 N Pearl St Unit 3 Buffalo, NY | 3.0 | 2.0 | 1197 | $3,100 | $2.59 | 23d | 1 | 0.83mi |
| 44 N Pearl St #5 Buffalo, NY | 3.0 | 1.0 | 1200 | $2,400 | $2.00 | 43d | 1 | 0.83mi |
| 50 E Utica St Unit 2C Buffalo, NY | 1.0 | 1.0 | 950 | $1,300 | $1.37 | 43d | 1 | 0.83mi |
| 50 E Utica St Unit 3D Buffalo, NY | 1.0 | 1.0 | 900 | $1,200 | $1.33 | 43d | 1 | 0.83mi |
| 19 E Utica St Unit 203 Buffalo, NY | 2.0 | 1.0 | 850 | $1,300 | $1.53 | 14d | 1 | 0.84mi |
| 451 Franklin St #2 Buffalo, NY | 1.0 | 1.0 | 900 | $1,350 | $1.50 | 43d | 1 | 0.86mi |
| 547 E Utica St Unit 3 Buffalo, NY | 1.0 | 1.0 | 759 | $900 | $1.19 | 43d | 1 | 0.87mi |
| 519 Virginia St Buffalo, NY | 1.0–2.0 | 1.0–2.0 | 700 | $1,700 | $2.43 | 3d | 3 | 0.88mi |
| 567 Delaware Ave Apt 3 Buffalo, NY | 1.0 | 1.0 | 780 | $1,570 | $2.01 | 43d | 1 | 0.89mi |
| 76 Chester St Unit 1 Buffalo, NY | 3.0 | 1.0 | 1100 | $1,000 | $0.91 | 14d | 1 | 0.95mi |
| 362 Oak St Unit 308 Buffalo, NY | 1.0 | 1.0 | 800 | $1,100 | $1.38 | 43d | 1 | 0.95mi |
| 493 Delaware Ave Unit 3 Buffalo, NY | 1.0 | 1.0 | 1010 | $1,400 | $1.39 | 43d | 1 | 0.95mi |
| 489 Ellicott St Unit 36 Buffalo, NY | 2.0 | 2.0 | 1000 | $1,550 | $1.55 | 3d | 1 | 0.95mi |
| 888 Delaware Ave Buffalo, NY | 2.0 | 1.0–2.0 | 899 | $2,440 | $2.71 | 23d | 1 | 0.96mi |
| 479 Delaware Ave Buffalo, NY | 1.0 | 1.0 | 900 | $1,300 | $1.44 | 3d | 1 | 0.96mi |
| 916 Delaware Ave Buffalo, NY | 2.0 | 1.0 | 750 | $1,625 | $2.17 | 3d | 9 | 0.97mi |
| 506 Delaware Ave Buffalo, NY | 1.0–2.0 | 1.0–1.5 | 1190 | $2,995 | $2.52 | 10d | 6 | 0.97mi |
| 88 W Utica St Unit 1 Buffalo, NY | 3.0 | 2.0 | 990 | $2,150 | $2.17 | 3d | 1 | 0.97mi |
| 88 W Utica St Unit 1 Buffalo, NY | 3.0 | 2.0 | 990 | $2,150 | $2.17 | 14d | 1 | 0.97mi |
| 12 Park St Buffalo, NY | 1.0 | 1.5 | 1100 | $1,500 | $1.36 | 23d | 1 | 1.05mi |
| 490 Pearl St Unit 4 Buffalo, NY | 1.0 | 1.0 | 860 | $1,550 | $1.80 | 19d | 1 | 1.06mi |
| 213 Summer St Unit 3 Buffalo, NY | 2.0 | 1.0 | 1020 | $2,450 | $2.40 | 21d | 1 | 1.07mi |
| 1040 Delaware Ave Buffalo, NY | 1.0–2.0 | 1.0 | 687 | $1,500 | $2.18 | 3d | 4 | 1.08mi |
Listing history 34 events
-
2026-06-18days on market $99,900 Active 69 DOM
-
2026-06-17days on market $99,900 Active 68 DOM
-
2026-06-16days on market $99,900 Active 67 DOM
-
2026-06-15days on market $99,900 Active 66 DOM
-
2026-06-13days on market $99,900 Active 64 DOM
-
2026-06-13days on market $99,900 Active 63 DOM
-
2026-06-10days on market $99,900 Active 61 DOM
-
2026-06-09days on market $99,900 Active 60 DOM
-
2026-06-08days on market $99,900 Active 59 DOM
-
2026-06-07days on market $99,900 Active 58 DOM
-
2026-06-03days on market $99,900 Active 54 DOM
-
2026-06-02days on market $99,900 Active 53 DOM
-
2026-06-01days on market $99,900 Active 52 DOM
-
2026-05-31days on market $99,900 Active 51 DOM
-
2026-04-10$99,900 Active 462-char remark
Show marketing remark (462 chars)
Currently, this single-family home is tenant-occupied; it can be delivered vacant at closing. Features 4 bedrooms, 1 full bathroom, a living room, a formal dining room, and a kitchen. Conveniently located in Buffalo’s historic Fruit Belt neighborhood, this property is just a minutes from the Medical Campus, hospitals, and downtown, with easy access to major routes and public transportation. Square footage differs from tax records; floor plan available.
-
2025-10-16historical
-
2025-10-03price $115,000
-
2025-08-22$125,000 Active
-
2024-12-28historical $1,400
-
2024-12-26$1,400
-
2023-12-15historical $1,400
-
2023-11-21$1,400
-
2023-11-21historical $1,400
-
2023-11-20$1,400
-
2023-09-26historical
-
2023-08-03status Active
-
2023-07-31historical Continue to Show- Under Contract
-
2023-07-19$99,900 Active
-
2023-06-03historical
-
2022-05-04soldstatus $80,000 Closed Sale or Rented
-
2022-05-04soldstatus $80,000
-
2022-03-25status Pending Sale
-
2022-02-07status Under Contract- Do Not Show
-
2022-02-03$84,500 Active
ⓘ Source: listings_history table (triggers on properties + properties_extension) + one-shot
backfill from property_details.listing_events for pre-trigger history.
Tax reassessment forecast NY · Partial reset (capped growth)
- Current annual tax
- $252 · $21/mo
- Projected year-2 tax
- $970 · $81/mo
- Expected delta
- +$718/yr (+$60/mo · 284.7%)
ⓘ Screening estimate from a state-policy table — verify with the county assessor before closing.
Climate risk First Street
- Flood 1/10 Low FEMA zone X (unshaded) · 0% chance over 30 yrs
- Wildfire 1/10 Low
- Heat 2/10 Low 7 d/yr ≥91°F today · 15 d/yr by 30 yrs out
- Wind 1/10 Low
- Air quality 4/10 Moderate 4 unhealthy d/yr today · 9 by 30 yrs out
Nearby sold comps map
Loading sold comps map…
Walkable amenities ~0.75 mi
Loading nearby amenities…
Taxation est. · year 1
- Rental income
- $23,640
- − Mortgage interest
- −$5,596
- − Property taxes
- −$252
- − Insurance
- −$500
- − Repairs & maintenance
- −$1,891
- − Management
- −$1,891
- − Depreciation
- −$2,906
- Taxable income
- $10,603
- Est. tax owed @ 24.0%
- −$2,545
- After-tax cash flow
- $9,092/yr
For passive investors: Depreciation is non-cash, so a rental often shows a tax loss while cash-flowing — sheltering income. Rental losses are passive: they offset passive income freely, and up to $25,000/yr can offset ordinary (W-2) income if you actively participate and your MAGI is under $100k (phasing out to $0 by $150k); unused losses carry forward. On sale, claimed depreciation is recaptured at up to 25%, and gains may owe capital-gains tax (a 1031 exchange can defer both). Figures are a year-1 estimate at your 24.0% rate — not tax advice; consult a CPA.
Schools (NCES district)
- District
- Buffalo City School District
- NCES district ID
- 3605850
- Math proficiency
- 41% ▲ 11.00%
- Reading proficiency
- 40% ▲ 7.00%
- Median HH income
- $31,665
- Composite
- 33.17/100
- National rank
- #5544
- State rank
- #535 of 590 in NY
Livability — Buffalo
- Score
- 77/100
- State rank
- #195
- US rank
- #3011
Category grades
Schools grade is shown separately in the Schools card above.
Census & demographics
- Census place
- Buffalo, NY
- County
- Erie County · 714,559 people
- City population
- 440,021
- Metro
- Buffalo-Cheektowaga, NY
- Population (ZIP)
- 7,932
- Household income
- $28,182
- Rent vs Own
- Severe rent burden
- 945.0
Population outlook (Erie County) Hauer SSP2
- Today (2025)
- 933,037 people
- By 2030
- 935,181 · +0.2%
- By 2040
- 928,531 · -0.5%
- By 2050
- 905,725 · -2.9%
- By 2075
- 834,037 · -10.6%
- By 2100
- 708,033 · -24.1%
Race, ethnicity, and origin ACS 2023
- Neighborhood character
- Diverse neighborhood (Simpson 0.60)
- Race & ethnicity
- Black 58% White 19% Hispanic / Latino 18% Two or more races 4%
- Hispanic origin (detail)
- Puerto Rican 14% Dominican 1%
- Common ancestry
- Romanian 2% Subsaharan African 1%
- Foreign-born
- 6% · Canada
- Languages at home
- 81% English-only · Spanish 14% French/Haitian/Cajun 2% Russian/Polish/Slavic 1%
Political lean MEDSL · Erie
- 2024 margin
- Lean D (+9.7) · D 54.8% · R 45.2%
- 2008→2024 swing
- -7.9pp toward R · 2008: 17.5pp · 2024: 9.7pp
- All cycles
- 2024: D+9.7 2020: D+14.7 2016: D+4.8 2012: D+15.6 2008: D+17.5
Not yet ingested
- Civics
- —
Market trends
- HPI YoY
- ▼ -3.36%
- Current HPI
- 312.6232
- Rent YoY
- ▲ 5.48%
- Metro
- Buffalo-Cheektowaga, NY
- State GDP YoY
- ▲ 2.60%
- F500 in state
- 92
Industry mix (Fortune 500 HQ in NY)
| Industry | F500 HQs | Revenue |
|---|---|---|
| Financial Services | 10 | $950B |
|
||
| Consumer Goods | 9 | $162B |
|
||
| Insurance | 4 | $225B |
|
||
| Telecommunications | 2 | $144B |
|
||
| Pharmaceuticals | 2 | $112B |
|
||
| Media / Entertainment | 2 | $69B |
|
||
Price history
+18.2% since first listed20 events — show timeline
- 2026-04-10 Listed $99,900 WNYREIS
- 2025-10-16 Listing Removed — WNYREIS
- 2025-10-03 Price Changed $115,000 WNYREIS
- 2025-08-22 Listed $125,000 WNYREIS
- 2024-12-28 Rental Removed $1,400 TURBOTENANT
- 2024-12-26 Listed for Rent $1,400 TURBOTENANT
- 2023-12-15 Rental Removed $1,400 APPFOLIO
- 2023-11-21 Listed for Rent $1,400 APPFOLIO
- 2023-11-21 Rental Removed $1,400 TURBOTENANT
- 2023-11-20 Listed for Rent $1,400 TURBOTENANT
- 2023-09-26 Listing Removed — WNYREIS
- 2023-08-03 Relisted — WNYREIS
- 2023-07-31 Contingent — WNYREIS
- 2023-07-19 Listed $99,900 WNYREIS
- 2023-06-03 Rental Removed — TURBOTENANT
- 2022-05-04 Sold (Public Records) $80,000 Public Records
- 2022-05-04 Sold (MLS) $80,000 WNYREIS
- 2022-03-25 Pending — WNYREIS
- 2022-02-07 Pending — WNYREIS
- 2022-02-03 Listed $84,500 WNYREIS
Property tax history
+15.0%/yrLatest (2025): $252 · +0.0% YoY. Source: county tax records.
Cash-flow waterfall
monthlySold comps — $/sqft
last 12 mo · ≤1 miLoading sold comps…