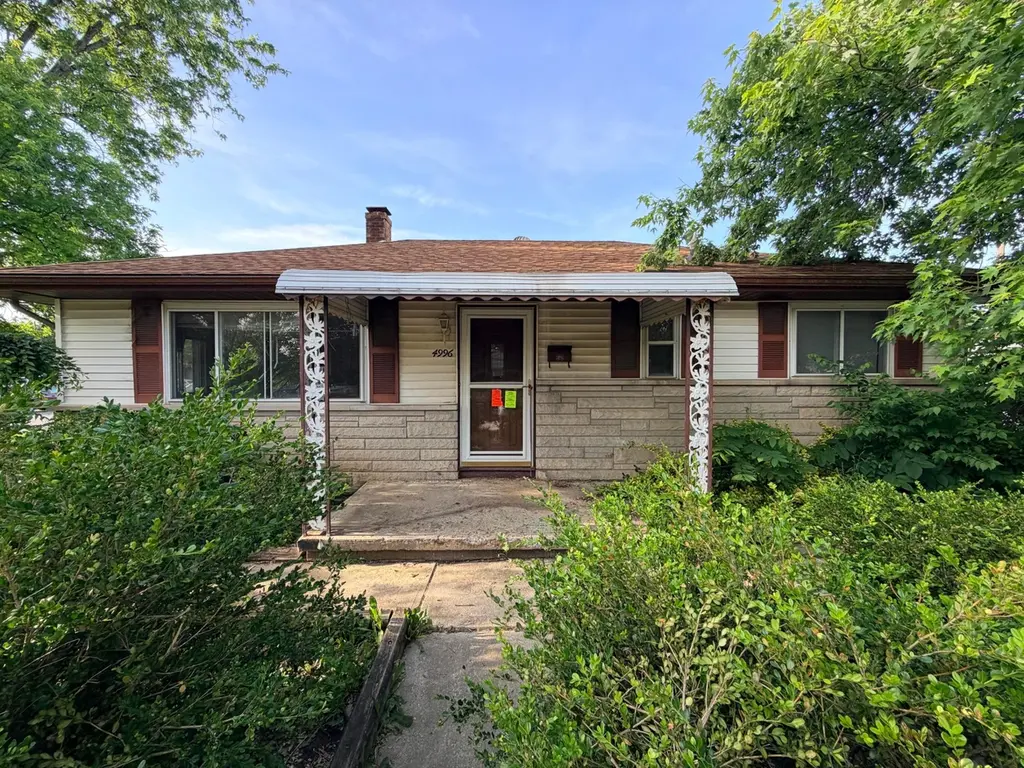
4996 Palmetto St · Lincoln Village, OH
Flood risk 1/10 · Minimal
- FEMA flood zone
- X (unshaded)
- Chance of flooding over 30 yrs
- 0.0%
- Est. flood insurance / yr
- $473 – $860
Fire risk 1/10 · Minimal
- Est. fire insurance / yr
- $713 – $1,323
Heat risk 4/10 · Minor
- Hot days now (above 101°F)
- 7 days/yr
- Hot days in 30 yrs
- 18 days/yr
Wind risk 2/10 · Minimal
- Chance of severe wind over 30 yrs
- 1.0%
Air-quality risk 2/10 · Minimal
- Unhealthy air days now
- 1 days/yr
- Unhealthy air days in 30 yrs
- 2 days/yr
Risk factors via First Street. Map © Google.
Why this score? — see what drove the C+ grade
The composite is a weighted blend of 9 inputs, each scored 0–100. Each bar is that input's sub-score; the figure is the points it added to the 100-point composite (weight × sub-score).
- Cash flow +24.8/30.0
- DSCR +8.0/10.0
- ARV discount +7.5/15.0
- 1% rule +7.3/10.0
- Livability +4.2/5.0
- Schools +3.8/10.0
- Condition / age +2.5/5.0
- Rent growth +2.3/5.0
- Appreciation +0.0/10.0
$110,000
🖨 Deal sheet 📄 Offer letter ✓ Due diligence
Listing remarks MLS
Move incondition, Newer Roof, carpet, vinyl floor, paint, bathroom, double pain windows,
Key facts
- Off street parking
- Large corner lot
- Complete rehab
Tags
Property features AI
Finance
- HOA & community: Community sidewalk
Exterior
- Utilities: Public water; Public sewer
- Home design: Single-family residence; One story; Built in 1957; No common walls
- Construction: Block foundation
- Exterior features: Patio; Sidewalk (community/association)
Interior
- Bedrooms: 3 main-level bedrooms
- Flooring: Wood flooring
- Bathrooms: 1 full bathroom
- Heating & cooling: Central air conditioning; Forced-air heating
- Interior features: Full basement; Living area approximately 996
Neighborhood map
What this means for you Summary
Snapshot
- This is a 3-bed/1.0-bath single-family listed at $110k.
Deal economics
- At list price, monthly cash flow is $232 ($3k/yr) — positive.
- The deal already cash-flows at list — no discount required.
- Meets the 1% rule at list price ($1k rent vs $110k).
- Cap rate 8.8% vs local median 4.0% in Lincoln Village — top-decile yield for the area; either an underpriced asset or a hidden risk that comps aren't pricing in. Stress-test before assuming the spread holds.
Location & tenants
- Location reads 85/100 on livability (#42 in OH, #549 nationally) — a professional / high-income tenant draw. Strengths: commute A+, cost of living A+, housing A+; Watch: employment C-.
- South-Western City (suburban): math 40% / reading 48% proficiency, ranked #500 of 656 in OH (top 76%) — families likely to look elsewhere, expect single-tenant / working-renter base with shorter leases.
- Market conditions: Rents soft (-0.6%/yr); 192 active listings in the ZIP; 27 comparable units currently listed for rent nearby; rentals leasing fast (median 13d on market — plan ~1-2 weeks tenant-placement turnaround); 8,139 units permitted in Franklin County in 2024 (5,940 in 5+ unit buildings).
Forward outlook
- Local home prices are declining (-3.0%/yr); year-one equity from $761 of loan paydown is wiped out by about $3k of value loss. Plan a longer hold.
- Franklin County population projected at +34% by 2050 — long-run rental-demand tailwind backs the buy-and-hold thesis.
Negotiation context
- Only 1 days on market — expect competitive offers; lowballing is unlikely to land.
- 2 sale attempts since 14y ago with the ask held roughly flat each time — persistent listings suggest the price (not the market) is what's stuck; bring a comps-based counter.
- Current owner paid $65k; list at $110k implies a 69% gain — meaningful room to come down on a strong offer.
Risks & watch-outs
- Watch-outs: built in 1957 — expect roof / HVAC / electrical / plumbing capex.
Questions for the listing agent
- Built in 1957 — when were the roof, HVAC, electrical panel, plumbing, and water heater last replaced?
- Is there a deadline driving the sale (1031 exchange, divorce, estate, relocation)? That informs how much negotiation room exists.
- What's the average days-on-market for RENTAL listings here right now (not sales)? A rising rental-DOM trend means longer vacancies and softer asking-rent achievability than the comps imply.
- What's the recent tenant-quality profile in this submarket — average credit score on applications, eviction rate, late-payment / NSF rate, and stable-employment percentage? A property-management company in the area should have these aggregated.
- How much new for-sale + rental construction is in the pipeline within 1–3 miles? Heavy new supply typically softens prices + rents 12–24 months out; constrained supply supports both.
Investment metrics
- 1% rule
- 1.23% ✓
- Cap rate
- 8.82%
- Cash-on-cash
- 9.03%
- DSCR
- 1.40
- GRM
- 6.8
CMA / ARV
- ARV (on-the-fly)
- $227,088
- Comps found
- 12
Show comp detail 12 sales within ~0.75 mi
| Address | Dist | Beds/Ba | Sqft | Sold | Price | $/sf | Match |
|---|---|---|---|---|---|---|---|
| 4996 Palmetto St | 0.00mi | 3/1.0 | 996 (0%) | 0mo | $120,000 | $120 | 100 |
| 102 Redmond Rd | 0.23mi | 3/1.0 | 980 (-2%) | 1mo | $240,000 | $245 | 86 |
| 117 Postle Blvd | 0.08mi | 3/2.0 | 1,080 (+8%) | 7mo | $249,900 | $231 | 72 |
| 255 Postle Blvd | 0.20mi | 2/1.0 (-1) | 936 (-6%) | 8mo | $214,000 | $229 | 69 |
| 377 S Murray Hill Rd | 0.46mi | 3/1.0 | 1,055 (+6%) | 3mo | $245,100 | $232 | 66 |
| 435 Redmond Rd | 0.42mi | 3/1.0 | 1,055 (+6%) | 6mo | $205,000 | $194 | 66 |
| 4681 Henley Ave | 0.43mi | 3/1.5 | 1,082 (+9%) | 0mo | $183,000 | $169 | 63 |
| 196 Maple Dr | 0.59mi | 2/1.5 (-1) | 1,044 (+5%) | 2mo | $135,000 | $129 | 56 |
| 93 Buena Vista Ave | 0.48mi | 4/1.5 (+1) | 1,137 (+14%) | 0mo | $260,000 | $229 | 46 |
| 323 Sturbridge Rd | 0.69mi | 3/1.5 | 1,107 (+11%) | 2mo | $179,900 | $163 | 46 |
| 110 Pasadena Ave | 0.57mi | 2/1.0 (-1) | 885 (-11%) | 6mo | $190,000 | $215 | 44 |
| 159 Pasadena Ave | 0.63mi | 2/2.0 (-1) | 1,138 (+14%) | 1mo | $260,000 | $228 | 37 |
Match score weights: distance 35% · size 25% · config 20% · recency 20%. Top-matched comps best support the ARV.
Projected returns pro-forma
-3.0% appreciation · 0.0% rent growth · sell at horizon
- IRR
- -6.3%
- Equity multiple
- 0.77×
- Total profit
- $-6,953
- Equity at exit
- $16,401
- IRR
- -1.1%
- Equity multiple
- 0.93×
- Total profit
- $-2,059
- Equity at exit
- $9,511
Cash invested: $30,800 (down + closing). Projections, not guarantees.
Landlord ↔ Tenant lean methodology
- Overall (STATE)
- 73 Landlord-Friendly
- State Ohio
- 73 Landlord-Friendly · R+6
- County
- — inherits STATE
- City
- — inherits STATE
ZIP-level market 43228
- Rents YoY
- -0.6%
- Active inventory
- 192
- Price-to-rent
- 6.8×
Monthly cashflow live
- Estimated rent
- $1,349 high interval (Pro) →
- Mortgage (P&I)
- −$577
- Tax from tax record
- −$211 /mo · $2,533/yr
- Insurance
- −$46
- HOA
- −$0
- Vacancy / Maint / Mgmt
- −$283
- Net cashflow
- $232
Break-even live
UW: 25.0% down · 7.5% · 30yr · 1.5% tax · 5.0% vac · 8.0% maint · 8.0% mgmt
Financing live
Cash to close
- Down payment
- $27,500
- Closing costs
- $3,300
- Reserves months
- —
- Total cash needed
- —
Loan-product check · same deal, 3 products live
Conventional
25% down · 7.5% · 30yr
- Down + closing
- —
- Monthly P&I
- —
- Monthly cashflow
- —
- DSCR
- —
- Eligible?
- —
Personal DTI + credit; lowest rate.
DSCR
20% down · 8.5% · 30yr
- Down + closing
- —
- Monthly P&I
- —
- Monthly cashflow
- —
- DSCR
- —
- Eligible?
- —
No personal income docs; deal must DSCR.
Hard money
10% down · 12.0% · 12mo
- Down + closing
- —
- Monthly P&I
- —
- Monthly cashflow
- —
- DSCR
- —
- Eligible?
- —
Short-term bridge; refi at stabilization.
Rent comps 27 comps
| Address | Beds | Baths | Sqft | Rent | $/sqft | DOM | Units | Dist |
|---|---|---|---|---|---|---|---|---|
| 4688 Hilton Ave Unit B Columbus, OH | 2.0 | 1.0 | 800 | $1,025 | $1.28 | 43d | 1 | 0.45mi |
| 4651 Hilton Ave Unit B Columbus, OH | 2.0 | 1.0 | 900 | $945 | $1.05 | 43d | 1 | 0.49mi |
| 4696 Tarryton Ct S Columbus, OH | 1.0–2.0 | 1.0 | 818 | $949 | $1.16 | 43d | 2 | 0.59mi |
| 4696 Tarryton Ct S Columbus, OH | 2.0 | 1.0 | 852 | $949 | $1.11 | 23d | 1 | 0.59mi |
| 80 Tarryton Ct E Unit 80 Columbus, OH | 2.0 | 1.5 | 992 | $1,650 | $1.66 | 43d | 1 | 0.60mi |
| 5591 Rustling Way LN Galloway, OH | 1.0–3.0 | 1.0–2.5 | 962 | $1,649 | $1.71 | 1d | 8 | 0.67mi |
| 90 Old Village Rd Columbus, OH | 3.0 | 1.0 | 1100 | $995 | $0.90 | 43d | 1 | 0.68mi |
| 550 Brandenbush Ln Columbus, OH | 2.0 | 1.0 | 878 | $1,060 | $1.21 | 3d | 7 | 0.69mi |
| 5445 Eaglecrest Dr Galloway, OH | 1.0–2.0 | 1.0–2.0 | 800 | $1,290 | $1.61 | 14d | 7 | 0.83mi |
| 5605 W Broad St Columbus, OH | 1.0–2.0 | 1.0–2.0 | 823 | $1,465 | $1.78 | 1d | 30 | 0.88mi |
| 5500 Floral Cir S Columbus, OH | 1.0–3.0 | 1.0–2.0 | 762 | $1,420 | $1.86 | 3d | 22 | 0.89mi |
| 4436 Westport Rd Columbus, OH | 2.0 | 1.0 | 866 | $1,004 | $1.16 | 21d | 7 | 0.90mi |
| 4573 Westport Rd Unit 670-205 Columbus, OH | 2.0 | 1.5 | 919 | $1,471 | $1.60 | 12d | 1 | 0.93mi |
| 4573 Westport Rd Unit 4507-107 Columbus, OH | 3.0 | 1.5 | 1095 | $1,417 | $1.29 | 12d | 1 | 0.93mi |
| 4573 Westport Rd Unit 690-205 Columbus, OH | 2.0 | 1.5 | 919 | $1,471 | $1.60 | 43d | 1 | 0.93mi |
| 4573 Westport Rd Unit 4567-101 Columbus, OH | 3.0 | 1.5 | 1095 | $1,701 | $1.55 | 43d | 1 | 0.93mi |
| 4573 Westport Rd Unit 670-106 Columbus, OH | 3.0 | 1.5 | 1095 | $1,417 | $1.29 | 43d | 1 | 0.93mi |
| 4573 Westport Rd Unit 670-201 Columbus, OH | 2.0 | 1.5 | 919 | $1,226 | $1.33 | 43d | 1 | 0.93mi |
| 5580 Leigh Run Ct Columbus, OH | 2.0 | 1.0 | 950 | $1,244 | $1.31 | 2d | 3 | 1.02mi |
| 5809-5811 Pepperwood Ct Unit 5809 Galloway, OH | 2.0 | 1.0 | 910 | $1,349 | $1.48 | 20d | 1 | 1.18mi |
| 931 Muirwood Village Dr Columbus, OH | 1.0–2.0 | 1.0 | 800 | $1,399 | $1.75 | 3d | 11 | 1.22mi |
| 500 Dove Tree Dr Galloway, OH | 1.0–2.0 | 1.0–1.5 | 804 | $1,419 | $1.76 | 1d | 1 | 1.27mi |
| 5930 W Broad St Galloway, OH | 1.0–2.0 | 1.0–2.0 | 819 | $1,290 | $1.58 | 1d | 24 | 1.31mi |
| 4800 Hall Rd Columbus, OH | 1.0–3.0 | 1.0–2.0 | 880 | $1,289 | $1.46 | 2d | 24 | 1.32mi |
| 1112 Ashberry Village Dr Columbus, OH | 2.0 | 1.0 | 850 | $974 | $1.15 | 1d | 6 | 1.39mi |
| 600 Trinity Marsh Columbus, OH | 1.0–2.0 | 1.0–2.0 | 819 | $1,408 | $1.72 | 2d | 8 | 1.45mi |
| 2791 Chopper Ln Columbus, OH | 1.0–2.0 | 1.0–2.5 | 1004 | $2,884 | $2.87 | 1d | 25 | 1.48mi |
Listing history 1 events
-
2026-05-31status $110,000 Pending 1 DOM
ⓘ Source: listings_history table (triggers on properties + properties_extension) + one-shot
backfill from property_details.listing_events for pre-trigger history.
Tax reassessment forecast OH · Partial reset (capped growth)
- Current annual tax
- $2,533 · $211/mo
- Projected year-2 tax
- $2,533 · $211/mo
- Expected delta
- $0/yr ($0/mo · 0.0%)
ⓘ Screening estimate from a state-policy table — verify with the county assessor before closing.
Climate risk First Street
- Flood 1/10 Low FEMA zone X (unshaded) · 0% chance over 30 yrs
- Wildfire 1/10 Low
- Heat 4/10 Moderate 7 d/yr ≥101°F today · 18 d/yr by 30 yrs out
- Wind 2/10 Low 100% chance of damaging wind over 30 yrs
- Air quality 2/10 Low 1 unhealthy d/yr today · 2 by 30 yrs out
Nearby sold comps map
Loading sold comps map…
Walkable amenities ~0.75 mi
Loading nearby amenities…
Taxation est. · year 1
- Rental income
- $16,184
- − Mortgage interest
- −$6,162
- − Property taxes
- −$2,533
- − Insurance
- −$550
- − Repairs & maintenance
- −$1,295
- − Management
- −$1,295
- − Depreciation
- −$3,200
- Taxable income
- $1,150
- Est. tax owed @ 24.0%
- −$276
- After-tax cash flow
- $2,505/yr
For passive investors: Depreciation is non-cash, so a rental often shows a tax loss while cash-flowing — sheltering income. Rental losses are passive: they offset passive income freely, and up to $25,000/yr can offset ordinary (W-2) income if you actively participate and your MAGI is under $100k (phasing out to $0 by $150k); unused losses carry forward. On sale, claimed depreciation is recaptured at up to 25%, and gains may owe capital-gains tax (a 1031 exchange can defer both). Figures are a year-1 estimate at your 24.0% rate — not tax advice; consult a CPA.
Schools (NCES district)
- District
- South-Western City
- NCES district ID
- 3904480
- Math proficiency
- 40% ▼ -18.00%
- Reading proficiency
- 48% ▼ -10.00%
- Median HH income
- $51,689
- Composite
- 37.95/100
- National rank
- #4305
- State rank
- #500 of 656 in OH
Livability — Lincoln Village
- Score
- 85/100
- State rank
- #42
- US rank
- #549
Category grades
Schools grade is shown separately in the Schools card above.
Census & demographics
- Census place
- Lincoln Village, OH
- County
- Franklin County · 1,351,780 people
- City population
- 59,077
- Metro
- Columbus, OH
- Population (ZIP)
- 59,077
- Household income
- $61,713
- Rent vs Own
- Severe rent burden
- 3284.0
Population outlook (Franklin County) Hauer SSP2
- Today (2025)
- 1,456,139 people
- By 2030
- 1,556,890 · +6.9%
- By 2040
- 1,757,349 · +20.7%
- By 2050
- 1,950,539 · +34.0%
- By 2075
- 2,376,171 · +63.2%
- By 2100
- 2,636,796 · +81.1%
Race, ethnicity, and origin ACS 2023
- Neighborhood character
- Diverse neighborhood (Simpson 0.64)
- Race & ethnicity
- White 54% Black 23% Hispanic / Latino 14% Two or more races 11% Asian 3%
- Hispanic origin (detail)
- Mexican 8% Dominican 1%
- Common ancestry
- Slovak 2% Italian 1% Romanian 1%
- Foreign-born
- 19% · Canada, Jamaica
- Languages at home
- 74% English-only · Spanish 12% Other Indo-European 1% Other Asian/Pacific 1%
Political lean MEDSL · Franklin
- 2024 margin
- Strong D (+28.4) · D 63.7% · R 35.3% · Other 1.0%
- 2008→2024 swing
- +7.7pp toward D · 2008: 20.7pp · 2024: 28.4pp
- All cycles
- 2024: D+28.4 2020: D+31.4 2016: D+25.9 2012: D+21.7 2008: D+20.7
Not yet ingested
- Civics
- —
Market trends
- HPI YoY
- ▼ -245.97%
- Current HPI
- 234.1992
- Rent YoY
- ▼ -0.63%
- Metro
- Columbus, OH
- State GDP YoY
- ▲ 1.98%
- F500 in state
- 48
Industry mix (Fortune 500 HQ in OH)
| Industry | F500 HQs | Revenue |
|---|---|---|
| Insurance | 3 | $145B |
|
||
| Industrial Machinery | 3 | $49B |
|
||
| Financial Services | 3 | $24B |
|
||
| Consumer Goods | 2 | $93B |
|
||
| Aerospace / Defense | 2 | $47B |
|
||
| Utilities | 2 | $33B |
|
||
Price history
+62.0% since first listed5 events — show timeline
- 2026-05-29 Listed $110,000 CBRMLS
- 2012-06-27 Sold (Public Records) $65,000 Public Records
- 2012-06-14 Sold (MLS) $65,000 CBRMLS
- 2012-05-15 Listing Removed — CBRMLS
- 2012-05-14 Listed $67,900 CBRMLS
Property tax history
+4.5%/yrLatest (2024): $2,533 · +4.8% YoY. Source: county tax records.
Cash-flow waterfall
monthlySold comps — $/sqft
last 12 mo · ≤1 miLoading sold comps…