16637 Witt Rd · Dexter, NY
Flood risk 1/10 · Minimal
- FEMA flood zone
- X
- Chance of flooding over 30 yrs
- 0.0%
- Est. flood insurance / yr
- $507 – $1,088
Fire risk 1/10 · Minimal
- Est. fire insurance / yr
- $691 – $1,283
Heat risk 1/10 · Minimal
- Hot days now (above 91°F)
- 7 days/yr
- Hot days in 30 yrs
- 14 days/yr
Wind risk 1/10 · Minimal
- Chance of severe wind over 30 yrs
- 1.0%
Air-quality risk 2/10 · Minimal
- Unhealthy air days now
- 1 days/yr
- Unhealthy air days in 30 yrs
- 2 days/yr
Risk factors via First Street. Map © Google.
Why this score? — see what drove the B grade
The composite is a weighted blend of 9 inputs, each scored 0–100. Each bar is that input's sub-score; the figure is the points it added to the 100-point composite (weight × sub-score).
- Cash flow +30.0/30.0
- DSCR +10.0/10.0
- 1% rule +9.1/10.0
- ARV discount +7.5/15.0
- Appreciation +5.5/10.0
- Schools +4.2/10.0
- Livability +3.1/5.0
- Rent growth +2.5/5.0
- Condition / age +1.0/5.0
$69,900
🖨 Deal sheet (PDF) 📄 Offer letter ✓ Due diligence
Listing remarks
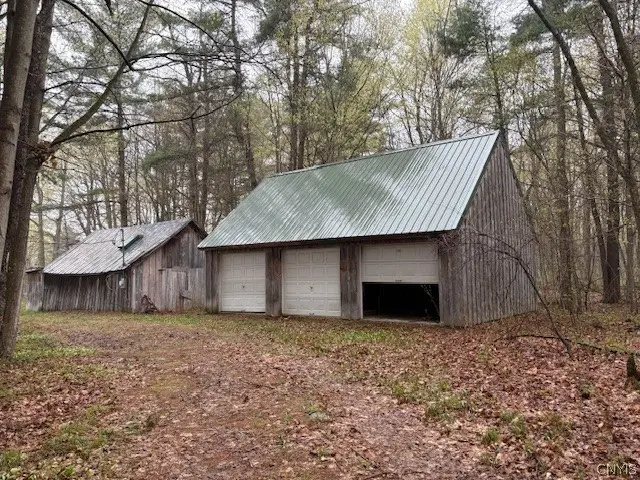
This property is nestled in gorgeous woods; it consists of a brick floored screened gazebo where you can hang your hammock and nap, a three stall garage, a spacious old sugaring shack and a trailer with a porch and added shelter/roof. Located in a rural area, wildlife here is abundant and the peaceful setting is very inviting. Situated next to a TILT preserve, the site inspires an appreciation for the sound of tree frogs, crickets, foxes, deer and birds, including whip-poor-wills! This is a very special place if you treasure wildlife and a rural peaceful setting.
Key facts
- Wildlife abundant
- Three stall garage
- Rural area
Tags
Property features AI
Finance
- HOA & community: Trails/paths nearby
Exterior
- Parking: Detached garage (3 spaces)
- Utilities: Well water; Septic tank
- Home design: Single-wide mobile home; Single-story; Existing/resale property
- Construction: Aluminum siding
- Exterior features: Dirt driveway; Irregular, rural, wooded lot (213 x 428)
Interior
- Kitchen: Eat-in kitchen
- Bedrooms: One main-level bedroom
- Bathrooms: One full bathroom (main level)
- Heating & cooling: Wood stove heating
- Interior features: Eat-in kitchen; Main level primary bedroom; Fireplace (1)
- Laundry & utility: Electric water heater
Neighborhood map
What this means for you Summary
Snapshot
- This is a 1-bed/1.0-bath manufactured listed at $70k. Condition is rated poor.
Deal economics
- At list price, monthly cash flow is $293 ($4k/yr) — positive.
- The deal already cash-flows at list — no discount required.
- Meets the 1% rule at list price ($983 rent vs $70k).
- Recommended offer: $68k (3.0% below list) — sets the bar for market timing.
Location & tenants
- Location reads 62/100 on livability (#869 in NY) — a middle-class / working-renter tenant base. Strengths: cost of living A+, housing B+; Watch: employment D+, health & safety D, crime F.
- General Brown Central School District (rural): math 39% / reading 57% proficiency, ranked #407 of 590 in NY (top 69%) — families likely to look elsewhere, expect single-tenant / working-renter base with shorter leases.
- Zoned schools: Dexter Elementary School (316 students, 40% FRL); General Brown Junior-Senior High School (math 50% / reading 52%, grade D+, #970 of 1,100 statewide, top 88%, 661 students, 40% FRL).
- Market conditions: 8 active listings in the ZIP; 196 units permitted in Jefferson County in 2024 (0 in 5+ unit buildings).
Forward outlook
- In year one you build about $1k of equity ($483 loan paydown + $647 appreciation (0.9% local appreciation)).
- Jefferson County population projected at -12% by 2050 — secular population decline; favor cash flow + early exit over multi-decade hold.
- At projected returns (0.9% appreciation + 3.0% rent growth), your $20k cash investment doubles in ~4 years — after that, you're playing with house money.
Negotiation context
- It's been on market 53 days — a 3% lower offer ($68k) is reasonable based on typical stale-listing flexibility.
Questions for the listing agent
- It's been on market 53 days. Have you received any prior offers? Is the seller open to a 3% concession, seller financing, or rate buy-down credit?
- Have any recent inspections been done? Can we get a copy of the seller's disclosures and any deferred-maintenance estimates?
- Is there a deadline driving the sale (1031 exchange, divorce, estate, relocation)? That informs how much negotiation room exists.
- Crime grade is F in this area — have there been break-ins, vandalism, or insurance claims at this property in the last 3 years? What carrier currently insures it and at what premium?
- What's the average days-on-market for RENTAL listings here right now (not sales)? A rising rental-DOM trend means longer vacancies and softer asking-rent achievability than the comps imply.
- What's the recent tenant-quality profile in this submarket — average credit score on applications, eviction rate, late-payment / NSF rate, and stable-employment percentage? A property-management company in the area should have these aggregated.
- How much new for-sale + rental construction is in the pipeline within 1–3 miles? Heavy new supply typically softens prices + rents 12–24 months out; constrained supply supports both.
Investment metrics
- 1% rule
- 1.41% ✓
- Cap rate
- 11.33%
- Cash-on-cash
- 17.99%
- DSCR
- 1.80
- GRM
- 5.9
CMA / ARV
No comps found within radius.
Projected returns pro-forma
0.93% appreciation · 3.0% rent growth · sell at horizon
- IRR
- 19.8%
- Equity multiple
- 2.01×
- Total profit
- $19,758
- Equity at exit
- $23,594
- IRR
- 23.0%
- Equity multiple
- 3.77×
- Total profit
- $54,145
- Equity at exit
- $31,147
Cash invested: $19,572 (down + closing). Projections, not guarantees.
Landlord ↔ Tenant lean methodology
- Overall (STATE)
- 15 Strongly Tenant-Friendly
- State New York
- 15 Strongly Tenant-Friendly · D+10
- County
- — inherits STATE
- City
- — inherits STATE
ZIP-level market 13615
- Home prices YoY
- 0.3%
- Active inventory
- 8
- Price-to-rent
- 5.9×
Monthly cashflow live
- Estimated rent
- $983 medium interval (Pro) →
- Mortgage (P&I)
- −$367
- Tax est. 1.5%
- −$87 /mo · $1,048/yr
- Insurance
- −$29
- HOA
- −$0
- Vacancy / Maint / Mgmt
- −$206
- Net cashflow
- $293
Break-even live
Sensitivity live
| Price | -10% $342 | -5% $318 | +0% $293 | +5% $269 | +10% $245 |
|---|---|---|---|---|---|
| Rent | -10% $216 | -5% $255 | +0% $293 | +5% $332 | +10% $371 |
| Rate | -1.0pp $329 | -0.5pp $311 | base $293 | +0.5pp $275 | +1.0pp $257 |
UW: 25.0% down · 7.5% · 30yr · 1.5% tax · 5.0% vac · 8.0% maint · 8.0% mgmt
Financing live
Cash to close
- Down payment
- $17,475
- Closing costs
- $2,097
- Reserves months
- —
- Total cash needed
- —
Loan-product check · same deal, 3 products live
Conventional
25% down · 7.5% · 30yr
- Down + closing
- —
- Monthly P&I
- —
- Monthly cashflow
- —
- DSCR
- —
- Eligible?
- —
Personal DTI + credit; lowest rate.
DSCR
20% down · 8.5% · 30yr
- Down + closing
- —
- Monthly P&I
- —
- Monthly cashflow
- —
- DSCR
- —
- Eligible?
- —
No personal income docs; deal must DSCR.
Hard money
10% down · 12.0% · 12mo
- Down + closing
- —
- Monthly P&I
- —
- Monthly cashflow
- —
- DSCR
- —
- Eligible?
- —
Short-term bridge; refi at stabilization.
Listing history 16 events
-
2026-06-21days on market $69,900 Active 53 DOM
-
2026-06-19days on market $69,900 Active 51 DOM
-
2026-06-18days on market $69,900 Active 50 DOM
-
2026-06-17pricedays on market $69,900 Active 49 DOM
-
2026-06-16days on market $79,900 Active 48 DOM
-
2026-06-15days on market $79,900 Active 47 DOM
-
2026-06-14days on market $79,900 Active 45 DOM
-
2026-06-12days on market $79,900 Active 44 DOM
-
2026-06-09days on market $79,900 Active 41 DOM
-
2026-06-08days on market $79,900 Active 40 DOM
-
2026-06-07days on market $79,900 Active 39 DOM
-
2026-06-02days on market $79,900 Active 34 DOM
-
2026-06-01days on market $79,900 Active 33 DOM
-
2026-05-31days on market $79,900 Active 32 DOM
-
2026-05-30days on market $79,900 Active 31 DOM
-
2026-04-29$79,900 Active 570-char remark
ⓘ Source: listings_history table (triggers on properties + properties_extension) + one-shot
backfill from property_details.listing_events for pre-trigger history.
Climate risk First Street
- Flood 1/10 Low FEMA zone X · 0% chance over 30 yrs
- Wildfire 1/10 Low
- Heat 1/10 Low 7 d/yr ≥91°F today · 14 d/yr by 30 yrs out
- Wind 1/10 Low 100% chance of damaging wind over 30 yrs
- Air quality 2/10 Low 1 unhealthy d/yr today · 2 by 30 yrs out
Nearby sold comps map
Loading sold comps map…
Walkable amenities ~0.75 mi
Loading nearby amenities…
Taxation est. · year 1
- Rental income
- $11,795
- − Mortgage interest
- −$3,915
- − Property taxes
- −$1,048
- − Insurance
- −$350
- − Repairs & maintenance
- −$944
- − Management
- −$944
- − Depreciation
- −$2,033
- Taxable income
- $2,561
- Est. tax owed @ 24.0%
- −$615
- After-tax cash flow
- $2,907/yr
For passive investors: Depreciation is non-cash, so a rental often shows a tax loss while cash-flowing — sheltering income. Rental losses are passive: they offset passive income freely, and up to $25,000/yr can offset ordinary (W-2) income if you actively participate and your MAGI is under $100k (phasing out to $0 by $150k); unused losses carry forward. On sale, claimed depreciation is recaptured at up to 25%, and gains may owe capital-gains tax (a 1031 exchange can defer both). Figures are a year-1 estimate at your 24.0% rate — not tax advice; consult a CPA.
Condition & rehab AI · 2 photos
This property requires extensive repairs and maintenance, including a new roof, exterior painting, and landscaping. Significant improvements are needed to increase its value.
Repairs flagged
- Major roof — Significant rust and wear
- Major exterior walls — Weathered and in need of repainting
- Major landscaping — Overgrown vegetation and lack of landscaping
Value-add opportunities
- Resale roof replacement — A new roof would significantly improve the home's appearance and value
- Resale exterior painting — Fresh paint would enhance curb appeal and home value
- Both landscaping — Well-maintained landscaping would improve both resale and rental value
Renovation cost estimate screening
| Repair item | Severity | Est. cost |
|---|---|---|
| roof · Significant rust and wear | Major | $15,000–50,000 |
| exterior walls · Weathered and in need of repainting | Major | $15,000–50,000 |
| landscaping · Overgrown vegetation and lack of landscaping | Major | $15,000–50,000 |
| Total estimated repair cost · 3 items | $45,000–150,000 |
Value-add ROI direction
- Resale roof replacement — A new roof would significantly improve the home's appearance and value ↑
- Resale exterior painting — Fresh paint would enhance curb appeal and home value ↑
- Both landscaping — Well-maintained landscaping would improve both resale and rental value ↑
ⓘ Cost ranges are severity-bucket heuristics (US national rule-of-thumb). Get contractor quotes + a written scope before underwriting a rehab budget.
Schools (NCES district)
- District
- General Brown Central School District
- NCES district ID
- 3611910
- Math proficiency
- 39% ▼ -17.00%
- Reading proficiency
- 57% ▲ 6.00%
- Median HH income
- $57,237
- Composite
- 41.75/100
- National rank
- #3398
- State rank
- #407 of 590 in NY
Livability — Dexter
- Score
- 62/100
- State rank
- #869
- US rank
- #16748
Category grades
Schools grade is shown separately in the Schools card above.
Census & demographics
- Population (ZIP)
- 538
Population outlook (Jefferson County) Hauer SSP2
- Today (2025)
- 111,748 people
- By 2030
- 109,370 · -2.1%
- By 2040
- 103,828 · -7.1%
- By 2050
- 98,523 · -11.8%
- By 2075
- 91,422 · -18.2%
- By 2100
- 78,214 · -30.0%
Race, ethnicity, and origin ACS 2023
- Neighborhood character
- Predominantly White (93%)
- Race & ethnicity
- White 93% Black 4% Two or more races 3%
- Common ancestry
- Lithuanian 18% Scandinavian 6% Iranian 3%
Political lean MEDSL · Jefferson
- 2024 margin
- Strong R (+23.6) · D 38.2% · R 61.8%
- 2008→2024 swing
- -18.3pp toward R · 2008: -5.3pp · 2024: -23.6pp
- All cycles
- 2024: R+23.6 2020: R+19.0 2016: R+22.4 2012: R+2.9 2008: R+5.3
Not yet ingested
- Civics
- —
Market trends
- HPI YoY
- ▲ 0.93%
- Current HPI
- 342.5299
- Rent YoY
- —
- Metro
- —
- State GDP YoY
- ▲ 2.60%
- F500 in state
- 92
Industry mix (Fortune 500 HQ in NY)
| Industry | F500 HQs | Revenue |
|---|---|---|
| Financial Services | 10 | $950B |
|
||
| Consumer Goods | 9 | $162B |
|
||
| Insurance | 4 | $225B |
|
||
| Telecommunications | 2 | $144B |
|
||
| Pharmaceuticals | 2 | $112B |
|
||
| Media / Entertainment | 2 | $69B |
|
||
Price history
-12.5% since first listed2 events — show timeline
- 2026-06-17 Price Changed $69,900 CNYIS
- 2026-04-29 Listed $79,900 CNYIS
Cash-flow waterfall
monthlySold comps — $/sqft
last 12 mo · ≤1 miLoading sold comps…