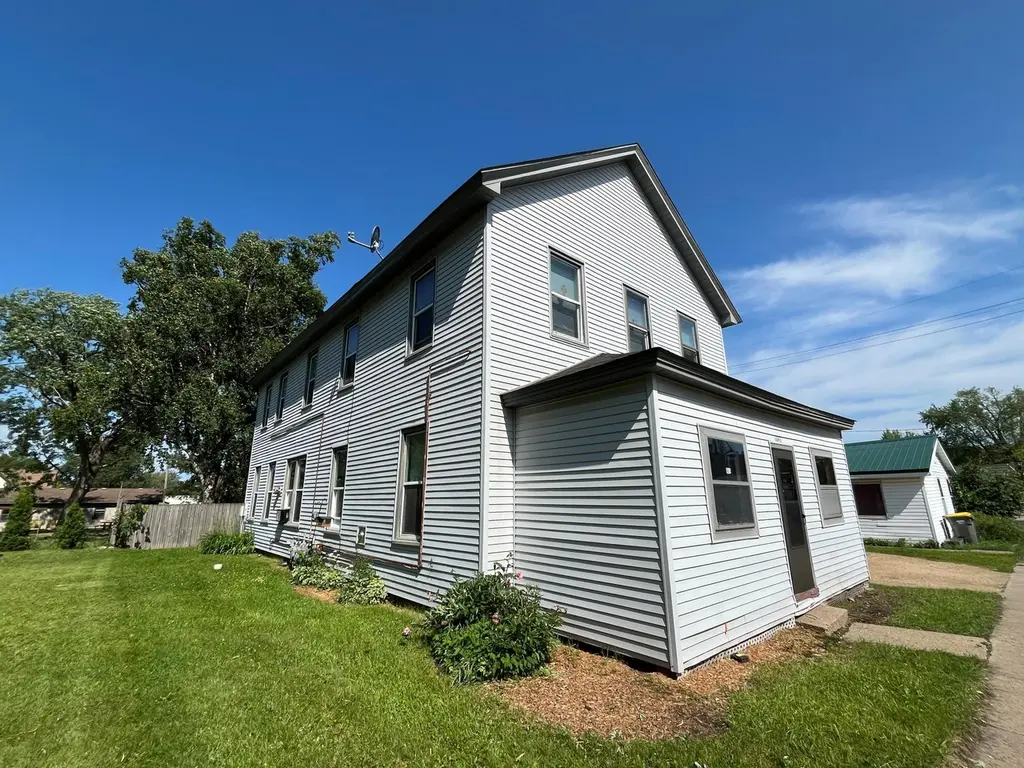
 Fourplex
1040 7th Ave · Baldwin, WI
Flood risk 1/10 · Minimal
- FEMA flood zone
- X (unshaded)
- Chance of flooding over 30 yrs
- 0.0%
- Est. flood insurance / yr
- $473 – $860
Fire risk 1/10 · Minimal
- Est. fire insurance / yr
- $636 – $1,182
Heat risk 2/10 · Minimal
- Hot days now (above 97°F)
- 7 days/yr
- Hot days in 30 yrs
- 14 days/yr
Wind risk 1/10 · Minimal
- Chance of severe wind over 30 yrs
- —
Air-quality risk 2/10 · Minimal
- Unhealthy air days now
- 1 days/yr
- Unhealthy air days in 30 yrs
- 1 days/yr
Risk factors via First Street. Map © Google.
Why this score? — see what drove the B grade
The composite is a weighted blend of 9 inputs, each scored 0–100. Each bar is that input's sub-score; the figure is the points it added to the 100-point composite (weight × sub-score).
- Cash flow +30.0/30.0
- 1% rule +10.0/10.0
- DSCR +10.0/10.0
- ARV discount +7.5/15.0
- Schools +4.2/10.0
- Livability +3.8/5.0
- Rent growth +2.5/5.0
- Condition / age +2.5/5.0
- Appreciation +0.0/10.0
$299,000
🖨 Deal sheet (PDF) 📄 Offer letter ✓ Due diligence
Multi-family units
County records classify this as Multi-Family (2-4 Unit). Listing-text estimate: 4 units. confirmed
Listing remarks MLS
Baldwin apartments is a fully stabilized 4-unit located a block off the busy main street. With it being 100% occupied this property is easy to keep full offering one & two bedroom units. All residents pay for their own unit electric and gas for heat. The owner just pays for water and trash. Built around the turn of the century the units are spacious and have some original hardwood floors, original trim, and tall ceilings. A lot of newer vinyl replacement windows. Plenty of off-street parking on the side of the property. Rents are currently below market and have room to organically improve! Net operating income $20,113+
Key facts
- Tall ceilings
- Original trim
- Off-street parking
Tags
Neighborhood map
What this means for you Summary
Snapshot
- This is a 4 × 5-bed/4.0-bath units multifamily listed at $299k.
Deal economics
- At list price, monthly cash flow is $3k ($30k/yr) — positive. Per door: $630/mo.
- The deal already cash-flows at list — no discount required.
- Meets the 1% rule at list price ($6k rent vs $299k).
- Recommended offer: $281k (6.0% below list) — sets the bar for market timing.
Location & tenants
- Location reads 75/100 on livability (#162 in WI, #4,286 nationally) — a middle-class / working-renter tenant base. Strengths: cost of living A+, housing A+, crime A; Watch: amenities F, commute F, health & safety D-.
- Baldwin-Woodville Area School District (rural): math 46% / reading 51% proficiency, ranked #58 of 342 in WI (top 17%) — families likely to look elsewhere, expect single-tenant / working-renter base with shorter leases; only 19% free/reduced lunch — higher-income household profile.
- Zoned schools: Greenfield Elementary (math 57% / reading 51%, grade C, #205 of 1,041 statewide, top 20%, 845 students, 27% FRL); Viking Middle (math 41% / reading 54%, grade C-, #68 of 383 statewide, top 19%, 391 students, 28% FRL); Baldwin-Woodville High (math 27% / reading 37%, grade F, #184 of 483 statewide, top 41%, 505 students, 23% FRL).
- Market conditions: 30 active listings in the ZIP; 411 units permitted in St. Croix County in 2024 (36 in 5+ unit buildings).
Forward outlook
- Local home prices are declining (-3.0%/yr); year-one equity from $2k of loan paydown is wiped out by about $9k of value loss. Plan a longer hold.
- St. Croix County population projected at +4% by 2050 — modest demand growth; plan on rents tracking national, not racing it.
- At projected returns (-3.0% appreciation + 3.0% rent growth), your $84k cash investment doubles in ~4 years — after that, you're playing with house money.
Negotiation context
- It's been on market 77 days — a 6% lower offer ($281k) is reasonable based on typical stale-listing flexibility.
- 8 sale attempts since 26y ago; this cycle's ask has dropped $16k (5%) from the opening price — seller is motivated, your offer sets the floor, not the list.
- Current owner paid $150k; list at $299k implies a 99% gain — meaningful room to come down on a strong offer.
Risks & watch-outs
- Watch-outs: built in 1900 — expect roof / HVAC / electrical / plumbing capex.
Questions for the listing agent
- It's been on market 77 days. Have you received any prior offers? Is the seller open to a 6% concession, seller financing, or rate buy-down credit?
- Can we see the unit-by-unit rent roll, current vacancy, and any below-market leases? What's the average tenancy length?
- What capital expenditures (roof, boiler, parking lot, exteriors) have been made in the last 5 years, and what's planned in the next 2?
- Built in 1900 — when were the roof, HVAC, electrical panel, plumbing, and water heater last replaced?
- Why hasn't it sold? Are there any deal-killer items the seller is aware of (foundation, flood, title, zoning, code violations)?
- Is there a deadline driving the sale (1031 exchange, divorce, estate, relocation)? That informs how much negotiation room exists.
- What's the average days-on-market for RENTAL listings here right now (not sales)? A rising rental-DOM trend means longer vacancies and softer asking-rent achievability than the comps imply.
- What's the recent tenant-quality profile in this submarket — average credit score on applications, eviction rate, late-payment / NSF rate, and stable-employment percentage? A property-management company in the area should have these aggregated.
- How much new apartment / multifamily construction is in the pipeline within 1–3 miles? Heavy new supply (>2% of stock underway) typically softens rents 12–24 months out; light construction supports rent growth.
Investment metrics
- 1% rule
- 1.94% ✓
- Cap rate
- 16.41%
- Cash-on-cash
- 36.14%
- DSCR
- 2.61
- GRM
- 4.3
CMA / ARV
No comps found within radius.
Projected returns pro-forma
-3.0% appreciation · 3.0% rent growth · sell at horizon
- IRR
- 31.9%
- Equity multiple
- 2.34×
- Total profit
- $112,214
- Equity at exit
- $44,582
- IRR
- 39.0%
- Equity multiple
- 4.64×
- Total profit
- $304,839
- Equity at exit
- $25,852
Cash invested: $83,720 (down + closing). Projections, not guarantees.
Landlord ↔ Tenant lean methodology
- Overall (STATE)
- 73 Landlord-Friendly
- State Wisconsin
- 73 Landlord-Friendly · R+2
- County
- — inherits STATE
- City
- — inherits STATE
ZIP-level market 54002
- Home prices YoY
- -9.6%
- Active inventory
- 30
- Price-to-rent
- 17.2×
Monthly cashflow live
- Estimated rent
- $5,807 medium interval (Pro) →
- Mortgage (P&I)
- −$1,568
- Tax est. 1.5%
- −$374 /mo · $4,485/yr
- Insurance
- −$125
- HOA
- −$0
- Vacancy / Maint / Mgmt
- −$1,219
- Net cashflow
- $2,521
Break-even live
Sensitivity live
| Price | -10% $2,728 | -5% $2,625 | +0% $2,521 | +5% $2,418 | +10% $2,315 |
|---|---|---|---|---|---|
| Rent | -10% $2,062 | -5% $2,292 | +0% $2,521 | +5% $2,751 | +10% $2,980 |
| Rate | -1.0pp $2,672 | -0.5pp $2,597 | base $2,521 | +0.5pp $2,444 | +1.0pp $2,365 |
4-unit breakdown (identical units grouped — click to expand)
| Units | Beds | Baths | Est. rent |
|---|---|---|---|
| 4× units | 5 | 4 | $5,808 |
| #1 | 5 | 4 | $1,452 |
| #2 | 5 | 4 | $1,452 |
| #3 | 5 | 4 | $1,452 |
| #4 | 5 | 4 | $1,452 |
| Total (4 units) | $5,807 | ||
UW: 25.0% down · 7.5% · 30yr · 1.5% tax · 5.0% vac · 8.0% maint · 8.0% mgmt
Financing live
Cash to close
- Down payment
- $74,750
- Closing costs
- $8,970
- Reserves months
- —
- Total cash needed
- —
Loan-product check · same deal, 3 products live
Conventional
25% down · 7.5% · 30yr
- Down + closing
- —
- Monthly P&I
- —
- Monthly cashflow
- —
- DSCR
- —
- Eligible?
- —
Personal DTI + credit; lowest rate.
DSCR
20% down · 8.5% · 30yr
- Down + closing
- —
- Monthly P&I
- —
- Monthly cashflow
- —
- DSCR
- —
- Eligible?
- —
No personal income docs; deal must DSCR.
Hard money
10% down · 12.0% · 12mo
- Down + closing
- —
- Monthly P&I
- —
- Monthly cashflow
- —
- DSCR
- —
- Eligible?
- —
Short-term bridge; refi at stabilization.
Listing history 33 events
-
2026-06-21days on market $299,000 Active 77 DOM
-
2026-06-18days on market $299,000 Active 74 DOM
-
2026-06-17days on market $299,000 Active 73 DOM
-
2026-06-16days on market $299,000 Active 72 DOM
-
2026-06-15pricedays on market $299,000 Active 71 DOM
-
2026-06-13days on market $315,000 Active 69 DOM
-
2026-06-13days on market $315,000 Active 68 DOM
-
2026-06-09days on market $315,000 Active 65 DOM
-
2026-06-08days on market $315,000 Active 64 DOM
-
2026-06-07days on market $315,000 Active 63 DOM
-
2026-06-04days on market $315,000 Active 60 DOM
-
2026-06-03days on market $315,000 Active 59 DOM
-
2026-06-02days on market $315,000 Active 58 DOM
-
2026-06-01days on market $315,000 Active 57 DOM
-
2026-05-31days on market $315,000 Active 56 DOM
-
2026-04-05$315,000 Active 637-char remark
Show marketing remark (637 chars)
Baldwin apartments is a fully stabilized 4-unit located a block off the busy main street. With it being 100% occupied this property is easy to keep full offering one & two bedroom units. All residents pay for their own unit electric and gas for heat. The owner just pays for water and trash. Built around the turn of the century the units are spacious and have some original hardwood floors, original trim, and tall ceilings. A lot of newer vinyl replacement windows. Plenty of off-street parking on the side of the property. Rents are currently below market and have room to organically improve! Net operating income $20,113+
-
2026-01-01historical
-
2025-08-03price $325,000
-
2025-07-05$349,900 Active
-
2015-05-29historical
-
2015-04-10$189,900 Active
-
2014-02-09historical
-
2013-12-09$189,900
-
2013-10-30historical
-
2013-09-03$194,900
-
2008-08-30historical
-
2008-02-28$154,900
-
2007-05-01soldstatus $150,000
-
2007-04-25historical
-
2006-09-20$155,000
-
2000-11-01soldstatus $129,900
-
2000-09-21historical
-
2000-03-28$129,900
ⓘ Source: listings_history table (triggers on properties + properties_extension) + one-shot
backfill from property_details.listing_events for pre-trigger history.
Climate risk First Street
- Flood 1/10 Low FEMA zone X (unshaded) · 0% chance over 30 yrs
- Wildfire 1/10 Low
- Heat 2/10 Low 7 d/yr ≥97°F today · 14 d/yr by 30 yrs out
- Wind 1/10 Low
- Air quality 2/10 Low 1 unhealthy d/yr today · 1 by 30 yrs out
Nearby sold comps map
Loading sold comps map…
Walkable amenities ~0.75 mi
Loading nearby amenities…
Taxation est. · year 1
- Rental income
- $69,684
- − Mortgage interest
- −$16,749
- − Property taxes
- −$4,485
- − Insurance
- −$1,495
- − Repairs & maintenance
- −$5,575
- − Management
- −$5,575
- − Depreciation
- −$8,698
- Taxable income
- $27,108
- Est. tax owed @ 24.0%
- −$6,506
- After-tax cash flow
- $23,749/yr
For passive investors: Depreciation is non-cash, so a rental often shows a tax loss while cash-flowing — sheltering income. Rental losses are passive: they offset passive income freely, and up to $25,000/yr can offset ordinary (W-2) income if you actively participate and your MAGI is under $100k (phasing out to $0 by $150k); unused losses carry forward. On sale, claimed depreciation is recaptured at up to 25%, and gains may owe capital-gains tax (a 1031 exchange can defer both). Figures are a year-1 estimate at your 24.0% rate — not tax advice; consult a CPA.
Schools (NCES district)
- District
- Baldwin-Woodville Area School District
- NCES district ID
- 5500720
- Math proficiency
- 46% ▼ -11.00%
- Reading proficiency
- 51% ▬ 0.00%
- Median HH income
- $59,534
- Composite
- 42.44/100
- National rank
- #3227
- State rank
- #58 of 342 in WI
Livability — Baldwin
- Score
- 75/100
- State rank
- #162
- US rank
- #4286
Category grades
Schools grade is shown separately in the Schools card above.
Census & demographics
- Census place
- Baldwin, WI
- City population
- 6,887
- Population (ZIP)
- 6,887
Population outlook (St. Croix County) Hauer SSP2
- Today (2025)
- 93,270 people
- By 2030
- 95,376 · +2.3%
- By 2040
- 97,820 · +4.9%
- By 2050
- 97,231 · +4.2%
- By 2075
- 92,282 · -1.1%
- By 2100
- 80,364 · -13.8%
Race, ethnicity, and origin ACS 2023
- Neighborhood character
- Predominantly White (95%)
- Race & ethnicity
- White 95% Two or more races 2% Black 1% Hispanic / Latino 1%
- Common ancestry
- Portuguese 18% Scottish 7% Romanian 6%
- Foreign-born
- 1% · Canada
- Languages at home
- 98% English-only · Spanish 1%
Political lean MEDSL · St. Croix
- 2024 margin
- R (+19.3) · D 39.5% · R 58.8% · Other 1.8%
- 2008→2024 swing
- -15.6pp toward R · 2008: -3.7pp · 2024: -19.3pp
- All cycles
- 2024: R+19.3 2020: R+15.9 2016: R+18.4 2012: R+12.2 2008: R+3.7
Not yet ingested
- Civics
- —
Market trends
- HPI YoY
- ▼ -36.36%
- Current HPI
- 343.8733
- Rent YoY
- —
- Metro
- —
- State GDP YoY
- ▲ 2.10%
- F500 in state
- 20
Industry mix (Fortune 500 HQ in WI)
| Industry | F500 HQs | Revenue |
|---|---|---|
| Industrial Machinery | 4 | $23B |
|
||
| Industrial Technology | 2 | $36B |
|
||
| Insurance | 1 | $36B |
|
||
| Professional Services | 1 | $19B |
|
||
| Utilities | 1 | $9B |
|
||
| Consumer Goods | 1 | $3B |
|
||
Price history
+142.5% since first listed18 events — show timeline
- 2026-04-05 Listed $315,000 NORTHSTARMLS as Distributed by MLS Grid
- 2026-01-01 Listing Removed — NORTHSTARMLS as Distributed by MLS Grid
- 2025-08-03 Price Changed $325,000 NORTHSTARMLS as Distributed by MLS Grid
- 2025-07-05 Listed $349,900 NORTHSTARMLS as Distributed by MLS Grid
- 2015-05-29 Listing Removed — NORTHSTARMLS as Distributed by MLS Grid
- 2015-04-10 Listed $189,900 NORTHSTARMLS as Distributed by MLS Grid
- 2014-02-09 Listing Removed — NORTHSTARMLS as Distributed by MLS Grid
- 2013-12-09 Listed $189,900 NORTHSTARMLS as Distributed by MLS Grid
- 2013-10-30 Listing Removed — NORTHSTARMLS as Distributed by MLS Grid
- 2013-09-03 Listed $194,900 NORTHSTARMLS as Distributed by MLS Grid
- 2008-08-30 Listing Removed — NORTHSTARMLS as Distributed by MLS Grid
- 2008-02-28 Listed $154,900 NORTHSTARMLS as Distributed by MLS Grid
- 2007-05-01 Sold (MLS) $150,000 NORTHSTARMLS as Distributed by MLS Grid
- 2007-04-25 Listing Removed — NORTHSTARMLS as Distributed by MLS Grid
- 2006-09-20 Listed $155,000 NORTHSTARMLS as Distributed by MLS Grid
- 2000-11-01 Sold (MLS) $129,900 NORTHSTARMLS as Distributed by MLS Grid
- 2000-09-21 Listing Removed — NORTHSTARMLS as Distributed by MLS Grid
- 2000-03-28 Listed $129,900 NORTHSTARMLS as Distributed by MLS Grid
Cash-flow waterfall
monthlySold comps — $/sqft
last 12 mo · ≤1 miLoading sold comps…