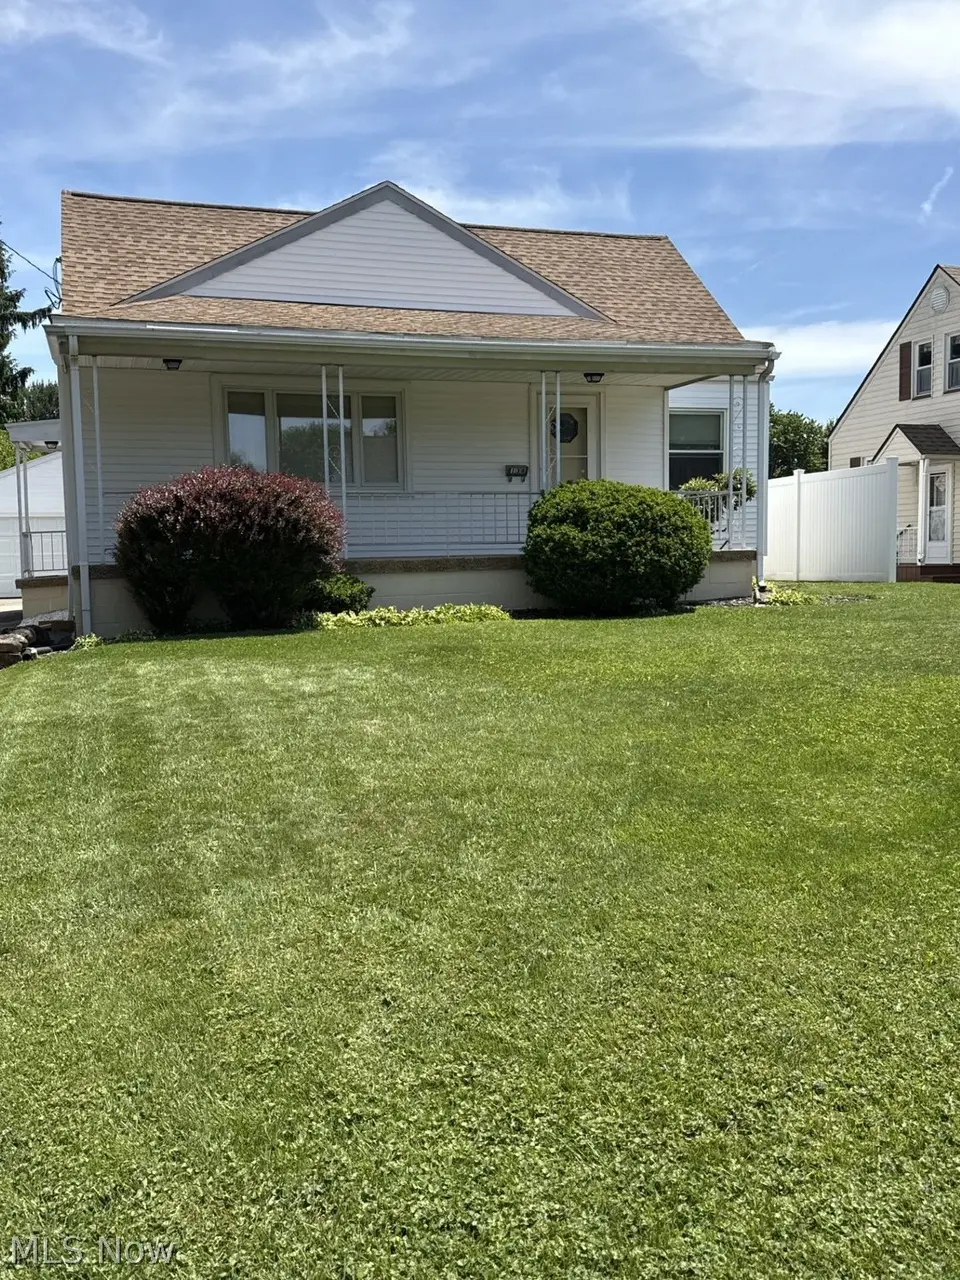
138 Iroquois St · Struthers, OH
Flood risk 1/10 · Minimal
- FEMA flood zone
- X (unshaded)
- Chance of flooding over 30 yrs
- 0.0%
- Est. flood insurance / yr
- $473 – $860
Fire risk 1/10 · Minimal
- Est. fire insurance / yr
- $713 – $1,323
Heat risk 3/10 · Minor
- Hot days now (above 96°F)
- 7 days/yr
- Hot days in 30 yrs
- 17 days/yr
Wind risk 1/10 · Minimal
- Chance of severe wind over 30 yrs
- —
Air-quality risk 2/10 · Minimal
- Unhealthy air days now
- 1 days/yr
- Unhealthy air days in 30 yrs
- 3 days/yr
Risk factors via First Street. Map © Google.
Why this score? — see what drove the B- grade
The composite is a weighted blend of 9 inputs, each scored 0–100. Each bar is that input's sub-score; the figure is the points it added to the 100-point composite (weight × sub-score).
- Cash flow +27.3/30.0
- DSCR +9.5/10.0
- ARV discount +8.8/15.0
- 1% rule +6.6/10.0
- Schools +4.0/10.0
- Livability +3.6/5.0
- Appreciation +2.9/10.0
- Rent growth +2.5/5.0
- Condition / age +2.5/5.0
$165,900
🖨 Deal sheet 📄 Offer letter ✓ Due diligence
Listing remarks MLS
Wonder full floor plan offering updated beautiful eat in kitchen with granite counters Ceramic flooring and back splash. relaxing living room with hard wood flooring. two bedrooms on main level and second level 34x13 bedroom offering office area or play room with loads of built in storage. partially finished basement with bar, full bath and separate laundry area. Some newer lighting fixtures. Nature stone covered front porch and side entre area, Detached two car garage with opener. Home has glass block windows, and current appliances are staying including large freezer in basement. pane furnace. Home is being sol as is but has been very well maintained, sellers are also including FREE one year home warranty to buyers . call now
Key facts
- Ceramic flooring
- Stylish backsplash
- Natural light
Tags
Neighborhood map
What this means for you Summary
Snapshot
- This is a 3-bed/1.0-bath single-family listed at $166k.
Deal economics
- At list price, monthly cash flow is $481 ($6k/yr) — positive.
- The deal already cash-flows at list — no discount required.
- Meets the 1% rule at list price ($2k rent vs $166k).
- Cap rate 9.8% vs local median 6.4% in Struthers — top-decile yield for the area; either an underpriced asset or a hidden risk that comps aren't pricing in. Stress-test before assuming the spread holds.
Location & tenants
- Location reads 71/100 on livability (#418 in OH) — a middle-class / working-renter tenant base. Strengths: cost of living A+, housing A+, crime B; Watch: commute C-, amenities F, employment F.
- Struthers City (suburban): math 45% / reading 52% proficiency, ranked #475 of 656 in OH (top 72%) — families likely to look elsewhere, expect single-tenant / working-renter base with shorter leases.
- Market conditions: 66 active listings in the ZIP; 3 comparable units currently listed for rent nearby; rentals leasing fast (median 13d on market — plan ~1-2 weeks tenant-placement turnaround); 147 units permitted in Mahoning County in 2024 (0 in 5+ unit buildings).
- This rent runs 44% of the median local income ($53k/yr) — at the standard rent-burdened threshold; future hikes will face affordability resistance.
Forward outlook
- Local home prices are declining (-3.0%/yr); year-one equity from $1k of loan paydown is wiped out by about $5k of value loss. Plan a longer hold.
- Mahoning County population projected at -14% by 2050 — secular population decline; favor cash flow + early exit over multi-decade hold.
- At projected returns (-3.0% appreciation + 3.0% rent growth), your $46k cash investment doubles in ~10 years — after that, you're playing with house money.
Negotiation context
- Only 2 days on market — expect competitive offers; lowballing is unlikely to land.
- 2 sale attempts since 8y ago with the ask held roughly flat each time — persistent listings suggest the price (not the market) is what's stuck; bring a comps-based counter.
- Current owner paid $65k; list at $166k implies a 155% gain — meaningful room to come down on a strong offer.
Risks & watch-outs
- Watch-outs: built in 1951 — expect roof / HVAC / electrical / plumbing capex.
Questions for the listing agent
- Built in 1951 — when were the roof, HVAC, electrical panel, plumbing, and water heater last replaced?
- Is there a deadline driving the sale (1031 exchange, divorce, estate, relocation)? That informs how much negotiation room exists.
- Schools are B-rated — typically a magnet for longer-tenancy family renters. What's the average tenant stay here, and is there a school-zone premium baked into asking?
- What's the average days-on-market for RENTAL listings here right now (not sales)? A rising rental-DOM trend means longer vacancies and softer asking-rent achievability than the comps imply.
- What's the recent tenant-quality profile in this submarket — average credit score on applications, eviction rate, late-payment / NSF rate, and stable-employment percentage? A property-management company in the area should have these aggregated.
- How much new for-sale + rental construction is in the pipeline within 1–3 miles? Heavy new supply typically softens prices + rents 12–24 months out; constrained supply supports both.
Investment metrics
- 1% rule
- 1.16% ✓
- Cap rate
- 9.77%
- Cash-on-cash
- 12.42%
- DSCR
- 1.55
- GRM
- 7.2
CMA / ARV
- ARV (on-the-fly)
- $171,000
- Comps found
- 12
Show comp detail 12 sales within ~0.75 mi
| Address | Dist | Beds/Ba | Sqft | Sold | Price | $/sf | Match |
|---|---|---|---|---|---|---|---|
| 556 Idora Ln | 0.11mi | 3/1.5 | 1,326 (-3%) | 1mo | $198,000 | $149 | 87 |
| 90 Harvey St | 0.34mi | 3/2.0 | 1,392 (+2%) | 10mo | $112,000 | $80 | 69 |
| 32 Como St | 0.54mi | 3/2.5 | 1,358 (-1%) | 1mo | $115,000 | $85 | 67 |
| 155 Smithfield St | 0.36mi | 4/2.0 (+1) | 1,366 (-0%) | 10mo | $80,000 | $59 | 65 |
| 42 E Wilson St | 0.61mi | 3/2.0 | 1,409 (+3%) | 2mo | $155,000 | $110 | 61 |
| 19 Renee Dr | 0.39mi | 3/1.5 | 1,250 (-9%) | 6mo | $192,000 | $154 | 60 |
| 110 Grimm Heights Ave | 0.38mi | 4/2.0 (+1) | 1,395 (+2%) | 13mo | $162,500 | $116 | 59 |
| 81 Renee Dr | 0.41mi | 3/2.0 | 1,298 (-5%) | 13mo | $162,000 | $125 | 57 |
| 230 Hamilton Blvd | 0.54mi | 3/2.0 | 1,286 (-6%) | 11mo | $185,000 | $144 | 52 |
| 95 Clingan Rd | 0.52mi | 3/1.0 | 1,518 (+11%) | 8mo | $230,000 | $152 | 51 |
| 101 Ridgeway St | 0.73mi | 3/2.0 | 1,536 (+12%) | 1mo | $136,000 | $89 | 40 |
| 14 Clingan Rd | 0.60mi | 2/2.5 (-1) | 1,205 (-12%) | 8mo | $265,000 | $220 | 35 |
Match score weights: distance 35% · size 25% · config 20% · recency 20%. Top-matched comps best support the ARV.
Projected returns pro-forma
-3.0% appreciation · 3.0% rent growth · sell at horizon
- IRR
- 2.1%
- Equity multiple
- 1.08×
- Total profit
- $3,710
- Equity at exit
- $24,736
- IRR
- 11.7%
- Equity multiple
- 1.92×
- Total profit
- $42,532
- Equity at exit
- $14,344
Cash invested: $46,452 (down + closing). Projections, not guarantees.
Landlord ↔ Tenant lean methodology
- Overall (STATE)
- 73 Landlord-Friendly
- State Ohio
- 73 Landlord-Friendly · R+6
- County
- — inherits STATE
- City
- — inherits STATE
ZIP-level market 44471
- Home prices YoY
- -1.5%
- Active inventory
- 66
- Price-to-rent
- 7.2×
Monthly cashflow live
- Estimated rent
- $1,931 medium interval (Pro) →
- Mortgage (P&I)
- −$870
- Tax from tax record
- −$106 /mo · $1,270/yr
- Insurance
- −$69
- HOA
- −$0
- Vacancy / Maint / Mgmt
- −$406
- Net cashflow
- $481
Break-even live
UW: 25.0% down · 7.5% · 30yr · 1.5% tax · 5.0% vac · 8.0% maint · 8.0% mgmt
Financing live
Cash to close
- Down payment
- $41,475
- Closing costs
- $4,977
- Reserves months
- —
- Total cash needed
- —
Loan-product check · same deal, 3 products live
Conventional
25% down · 7.5% · 30yr
- Down + closing
- —
- Monthly P&I
- —
- Monthly cashflow
- —
- DSCR
- —
- Eligible?
- —
Personal DTI + credit; lowest rate.
DSCR
20% down · 8.5% · 30yr
- Down + closing
- —
- Monthly P&I
- —
- Monthly cashflow
- —
- DSCR
- —
- Eligible?
- —
No personal income docs; deal must DSCR.
Hard money
10% down · 12.0% · 12mo
- Down + closing
- —
- Monthly P&I
- —
- Monthly cashflow
- —
- DSCR
- —
- Eligible?
- —
Short-term bridge; refi at stabilization.
Rent comps 3 comps
| Address | Beds | Baths | Sqft | Rent | $/sqft | DOM | Units | Dist |
|---|---|---|---|---|---|---|---|---|
| 465 W Omar St Struthers, OH | 3.0 | 2.0 | 1544 | $1,800 | $1.17 | 13d | 1 | 0.89mi |
| 2670 Center Rd Youngstown, OH | 3.0 | 2.5 | 1722 | $2,500 | $1.45 | 21d | 1 | 1.28mi |
| 610 Elm St Struthers, OH | 3.0 | 1.0 | 1050 | $1,500 | $1.43 | 13d | 1 | 1.50mi |
Listing history 3 events
-
2026-06-08status $165,900 Pending 2 DOM
-
2026-06-07remarks 699-char remark
-
2026-06-07$165,900 Active 2 DOM
ⓘ Source: listings_history table (triggers on properties + properties_extension) + one-shot
backfill from property_details.listing_events for pre-trigger history.
Tax reassessment forecast OH · Partial reset (capped growth)
- Current annual tax
- $1,270 · $106/mo
- Projected year-2 tax
- $1,929 · $161/mo
- Expected delta
- +$659/yr (+$55/mo · 51.9%)
ⓘ Screening estimate from a state-policy table — verify with the county assessor before closing.
Climate risk First Street
- Flood 1/10 Low FEMA zone X (unshaded) · 0% chance over 30 yrs
- Wildfire 1/10 Low
- Heat 3/10 Moderate 7 d/yr ≥96°F today · 17 d/yr by 30 yrs out
- Wind 1/10 Low
- Air quality 2/10 Low 1 unhealthy d/yr today · 3 by 30 yrs out
Nearby sold comps map
Loading sold comps map…
Walkable amenities ~0.75 mi
Loading nearby amenities…
Taxation est. · year 1
- Rental income
- $23,178
- − Mortgage interest
- −$9,293
- − Property taxes
- −$1,270
- − Insurance
- −$830
- − Repairs & maintenance
- −$1,854
- − Management
- −$1,854
- − Depreciation
- −$4,826
- Taxable income
- $3,250
- Est. tax owed @ 24.0%
- −$780
- After-tax cash flow
- $4,990/yr
For passive investors: Depreciation is non-cash, so a rental often shows a tax loss while cash-flowing — sheltering income. Rental losses are passive: they offset passive income freely, and up to $25,000/yr can offset ordinary (W-2) income if you actively participate and your MAGI is under $100k (phasing out to $0 by $150k); unused losses carry forward. On sale, claimed depreciation is recaptured at up to 25%, and gains may owe capital-gains tax (a 1031 exchange can defer both). Figures are a year-1 estimate at your 24.0% rate — not tax advice; consult a CPA.
Schools (NCES district)
- District
- Struthers City
- NCES district ID
- 3904485
- Math proficiency
- 45% ▼ -12.00%
- Reading proficiency
- 52% ▼ -8.00%
- Median HH income
- $37,753
- Composite
- 40.35/100
- National rank
- #3742
- State rank
- #475 of 656 in OH
Livability — Struthers
- Score
- 71/100
- State rank
- #418
- US rank
- #6867
Category grades
Schools grade is shown separately in the Schools card above.
Census & demographics
- Census place
- Struthers, OH
- County
- Mahoning · 224,175 people
- City population
- 10,296
- Metro
- Youngstown-Warren, OH
- Population (ZIP)
- 10,296
- Household income
- $52,811
- Rent vs Own
- Severe rent burden
- 12.2
Population outlook (Mahoning County) Hauer SSP2
- Today (2025)
- 223,932 people
- By 2030
- 218,387 · -2.5%
- By 2040
- 205,367 · -8.3%
- By 2050
- 193,606 · -13.5%
- By 2075
- 173,694 · -22.4%
- By 2100
- 151,147 · -32.5%
Race, ethnicity, and origin ACS 2023
- Neighborhood character
- Predominantly White (82%)
- Race & ethnicity
- White 82% Hispanic / Latino 8% Two or more races 8% Black 4% Asian 1%
- Hispanic origin (detail)
- Mexican 2% Puerto Rican 5%
- Common ancestry
- Romanian 8% Lithuanian 4% Slovak 1%
- Foreign-born
- 2% · Canada
- Languages at home
- 94% English-only · Spanish 4% Arabic 1% Other Indo-European 1%
Political lean MEDSL · Mahoning
- 2024 margin
- Lean R (+9.4) · D 44.9% · R 54.4%
- 2008→2024 swing
- -36.1pp toward R · 2008: 26.6pp · 2024: -9.4pp
- All cycles
- 2024: R+9.4 2020: R+1.9 2016: D+3.0 2012: D+27.7 2008: D+26.6
Not yet ingested
- Civics
- —
Market trends
- HPI YoY
- ▼ -4.12%
- Current HPI
- 274.6394
- Rent YoY
- —
- Metro
- —
- State GDP YoY
- ▲ 1.98%
- F500 in state
- 48
Industry mix (Fortune 500 HQ in OH)
| Industry | F500 HQs | Revenue |
|---|---|---|
| Insurance | 3 | $145B |
|
||
| Industrial Machinery | 3 | $49B |
|
||
| Financial Services | 3 | $24B |
|
||
| Consumer Goods | 2 | $93B |
|
||
| Aerospace / Defense | 2 | $47B |
|
||
| Utilities | 2 | $33B |
|
||
Price history
+130.4% since first listed5 events — show timeline
- 2026-05-04 Listed $165,900 MLSNOW
- 2018-12-07 Sold (Public Records) $65,000 Public Records
- 2018-12-05 Sold (MLS) $65,000 MLSNOW
- 2018-11-26 Pending — MLSNOW
- 2018-11-11 Listed $72,000 MLSNOW
Property tax history
+1.8%/yrLatest (2025): $1,270 · -24.9% YoY. Source: county tax records.
Cash-flow waterfall
monthlySold comps — $/sqft
last 12 mo · ≤1 miLoading sold comps…