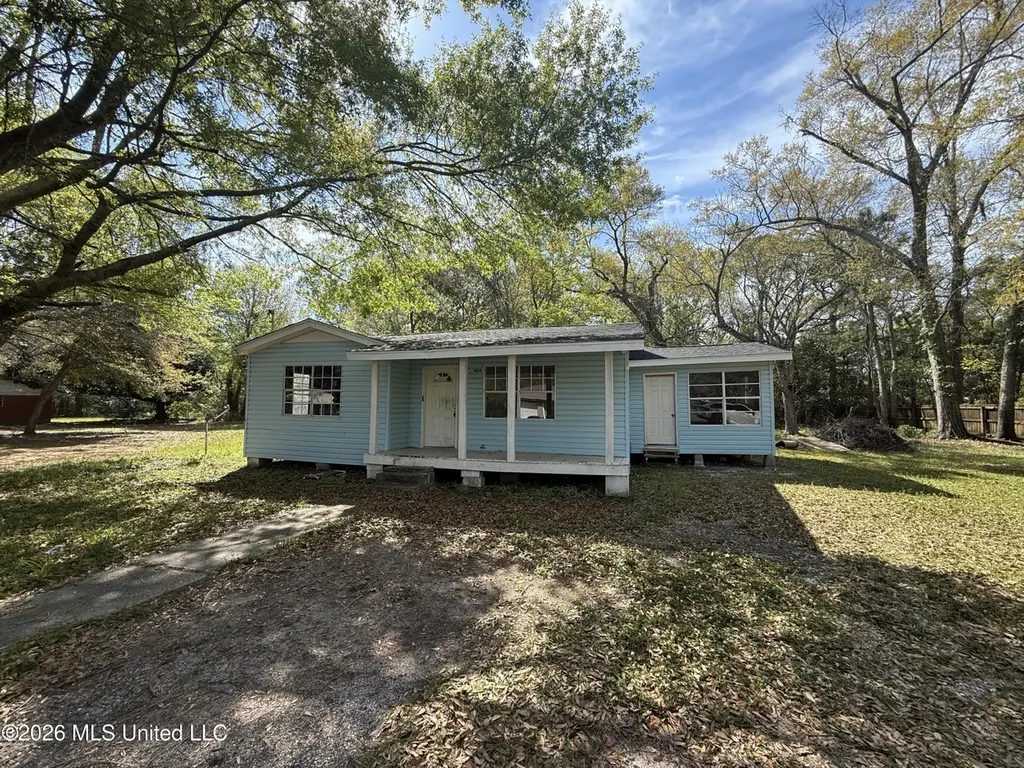
3424 Howze St · Moss Point, MS
Flood risk 4/10 · Minor
- FEMA flood zone
- X (shaded)
- Chance of flooding over 30 yrs
- 0.23%
- Est. flood insurance / yr
- $507 – $1,088
Fire risk 1/10 · Minimal
- Est. fire insurance / yr
- $1,241 – $2,305
Heat risk 10/10 · Severe
- Hot days now (above 106°F)
- 7 days/yr
- Hot days in 30 yrs
- 22 days/yr
Wind risk 9/10 · Severe
- Chance of severe wind over 30 yrs
- 99.0%
Air-quality risk 2/10 · Minimal
- Unhealthy air days now
- 1 days/yr
- Unhealthy air days in 30 yrs
- 2 days/yr
Risk factors via First Street. Map © Google.
Why this score? — see what drove the D+ grade
The composite is a weighted blend of 9 inputs, each scored 0–100. Each bar is that input's sub-score; the figure is the points it added to the 100-point composite (weight × sub-score).
- Cash flow +15.0/30.0
- ARV discount +7.5/15.0
- Appreciation +7.3/10.0
- 1% rule +5.0/10.0
- DSCR +5.0/10.0
- Livability +3.4/5.0
- Rent growth +2.5/5.0
- Condition / age +2.5/5.0
- Schools +1.6/10.0
$29,900
🖨 Deal sheet 📄 Offer letter ✓ Due diligence
Listing remarks
Investor special with solid upside potential! This 3-bedroom, 1-bath home offers 1,052 square feet of living space and is ready for your finishing touches. Key updates have already been completed, including a newer roof and updated electrical within the past year--providing a strong foundation for your renovation plans. With the right vision, this property could make an excellent rental or profitable flip. Priced to reflect its current condition--don't miss the opportunity to add value and maximize returns. Property to be conveyed via quitclaim deed.
Key facts
- Roof updated
- Flip opportunity
- 0.3 acre lot
Tags
Property features AI
Exterior
- Parking: Gravel parking
- Utilities: Public water; Public sewer; Electricity connected
- Home design: Single-family residence; House; One story; Fixer condition; Raised foundation with pillar/post/pier
- Construction: Shingle roof; Construction details: see remarks; 1,052 total building area; Year built: public records
- Exterior features: See remarks for exterior features
Interior
- Kitchen: See remarks for appliances
- Flooring: See remarks for flooring
- Bathrooms: 1 full bathroom
- Heating & cooling: See remarks for heating; See remarks for cooling
- Interior features: See remarks for interior features
Neighborhood map
What this means for you Summary
Snapshot
- This is a 3-bed/1.0-bath single-family listed at $30k.
Deal economics
- At list price, monthly cash flow is $880 ($11k/yr) — positive.
- The deal already cash-flows at list — no discount required.
- Meets the 1% rule at list price ($1k rent vs $30k).
- Recommended offer: $29k (3.0% below list) — sets the bar for market timing.
- Cap rate 41.6% vs local median 6.8% in Moss Point — top-decile yield for the area; either an underpriced asset or a hidden risk that comps aren't pricing in. Stress-test before assuming the spread holds.
Location & tenants
- Location reads 67/100 on livability (#77 in MS) — a middle-class / working-renter tenant base. Strengths: cost of living A+, housing A+, crime A-; Watch: health & safety D+, schools D, amenities F.
- Moss Point Separate School District (suburban): math 17% / reading 22% proficiency, ranked #94 of 130 in MS (top 72%) — low school quality limits family demand, transient renter base, plan for 1-2y turnover; 83% free/reduced lunch — lower-income household profile, screen leases tightly.
- Market conditions: 86 active listings in the ZIP; 516 units permitted in Jackson County in 2024 (6 in 5+ unit buildings).
Forward outlook
- In year one you build about $2k of equity ($207 loan paydown + $1k appreciation (4.6% local appreciation)).
- At projected returns (4.6% appreciation + 3.0% rent growth), your $8k cash investment doubles in ~1 year — after that, you're playing with house money.
Negotiation context
- It's been on market 47 days — a 3% lower offer ($29k) is reasonable based on typical stale-listing flexibility.
- 3 sale attempts; this cycle's ask has dropped $9k (23%) from the opening price — seller is motivated, your offer sets the floor, not the list.
Risks & watch-outs
- Watch-outs: built in 1953 — expect roof / HVAC / electrical / plumbing capex.
- Climate carrying-cost: severe wind risk, 99% chance of damaging wind over 30y; extreme-heat days projected 7→22/yr by 2055 (HVAC capex compounding) — expect insurance premiums to compound above CPI over the hold.
Questions for the listing agent
- It's been on market 47 days. Have you received any prior offers? Is the seller open to a 3% concession, seller financing, or rate buy-down credit?
- Built in 1953 — when were the roof, HVAC, electrical panel, plumbing, and water heater last replaced?
- Is there a deadline driving the sale (1031 exchange, divorce, estate, relocation)? That informs how much negotiation room exists.
- Schools are D-rated, which usually means shorter tenancies and higher turnover. Who's the typical renter profile here, and what's been the actual vacancy rate?
- The area grade is low — what's the realistic commute time and amenity access for the typical tenant pool here? Any planned neighborhood developments (good or bad) we should know about?
- What's the average days-on-market for RENTAL listings here right now (not sales)? A rising rental-DOM trend means longer vacancies and softer asking-rent achievability than the comps imply.
- What's the recent tenant-quality profile in this submarket — average credit score on applications, eviction rate, late-payment / NSF rate, and stable-employment percentage? A property-management company in the area should have these aggregated.
- How much new for-sale + rental construction is in the pipeline within 1–3 miles? Heavy new supply typically softens prices + rents 12–24 months out; constrained supply supports both.
Investment metrics
- 1% rule
- 4.69% ✓
- Cap rate
- 41.62%
- Cash-on-cash
- 126.17%
- DSCR
- 6.61
- GRM
- 1.8
CMA / ARV
- ARV (on-the-fly)
- $98,888
- Comps found
- 9
Show comp detail 9 sales within ~0.75 mi
| Address | Dist | Beds/Ba | Sqft | Sold | Price | $/sf | Match |
|---|---|---|---|---|---|---|---|
| 3424 Howze St | 0.00mi | 3/1.0 | 1,052 (0%) | 1mo | $29,900 | $28 | 99 |
| 3625 Rollins Ave | 0.24mi | 3/1.0 | 1,040 (-1%) | 16mo | $89,900 | $86 | 74 |
| 3718 Howze St | 0.31mi | 2/1.0 (-1) | 962 (-9%) | 0mo | $90,000 | $94 | 66 |
| 3312 Mcnair Dr | 0.32mi | 3/1.5 | 1,200 (+14%) | 0mo | $143,900 | $120 | 59 |
| 4848 Devon St | 0.47mi | 2/1.0 (-1) | 960 (-9%) | 11mo | $103,000 | $107 | 49 |
| 3507 Lawrence St | 0.25mi | 3/1.0 | 1,200 (+14%) | 20mo | $105,000 | $88 | 48 |
| 3536 Lawrence St | 0.29mi | 2/2.0 (-1) | 1,160 (+10%) | 21mo | $99,999 | $86 | 43 |
| 4949 Magnolia St | 0.63mi | 2/1.5 (-1) | 1,200 (+14%) | 3mo | $125,000 | $104 | 38 |
| 4912 Forrest St | 0.65mi | 4/1.5 (+1) | 1,170 (+11%) | 10mo | $125,000 | $107 | 36 |
Match score weights: distance 35% · size 25% · config 20% · recency 20%. Top-matched comps best support the ARV.
Projected returns pro-forma
4.6% appreciation · 3.0% rent growth · sell at horizon
- IRR
- —
- Equity multiple
- 8.44×
- Total profit
- $62,313
- Equity at exit
- $16,226
- IRR
- —
- Equity multiple
- 17.76×
- Total profit
- $140,307
- Equity at exit
- $27,427
Cash invested: $8,372 (down + closing). Projections, not guarantees.
Landlord ↔ Tenant lean methodology
- Overall (STATE)
- 90 Strongly Landlord-Friendly
- State Mississippi
- 90 Strongly Landlord-Friendly · R+11
- County
- — inherits STATE
- City
- — inherits STATE
ZIP-level market 39563
- Home prices YoY
- 3.0%
- Active inventory
- 86
- Price-to-rent
- 1.8×
Monthly cashflow live
- Estimated rent
- $1,402 medium interval (Pro) →
- Mortgage (P&I)
- −$157
- Tax from tax record
- −$58 /mo · $695/yr
- Insurance
- −$12
- HOA
- −$0
- Vacancy / Maint / Mgmt
- −$294
- Net cashflow
- $880
Break-even live
UW: 25.0% down · 7.5% · 30yr · 1.5% tax · 5.0% vac · 8.0% maint · 8.0% mgmt
Financing live
Cash to close
- Down payment
- $7,475
- Closing costs
- $897
- Reserves months
- —
- Total cash needed
- —
Loan-product check · same deal, 3 products live
Conventional
25% down · 7.5% · 30yr
- Down + closing
- —
- Monthly P&I
- —
- Monthly cashflow
- —
- DSCR
- —
- Eligible?
- —
Personal DTI + credit; lowest rate.
DSCR
20% down · 8.5% · 30yr
- Down + closing
- —
- Monthly P&I
- —
- Monthly cashflow
- —
- DSCR
- —
- Eligible?
- —
No personal income docs; deal must DSCR.
Hard money
10% down · 12.0% · 12mo
- Down + closing
- —
- Monthly P&I
- —
- Monthly cashflow
- —
- DSCR
- —
- Eligible?
- —
Short-term bridge; refi at stabilization.
Listing history 8 events
-
2026-05-18status Pending
-
2026-05-13status Active
-
2026-05-13status Pending
-
2026-05-07price $29,900
-
2026-04-08price $38,000
-
2026-04-08status Active
-
2026-04-06status Pending
-
2026-03-30$39,000 Active
ⓘ Source: listings_history table (triggers on properties + properties_extension) + one-shot
backfill from property_details.listing_events for pre-trigger history.
Tax reassessment forecast MS · Resets to sale price
- Current annual tax
- $695 · $58/mo
- Projected year-2 tax
- $695 · $58/mo
- Expected delta
- $0/yr ($0/mo · 0.0%)
ⓘ Screening estimate from a state-policy table — verify with the county assessor before closing.
Climate risk First Street
- Flood 4/10 Moderate FEMA zone X (shaded) · 23% chance over 30 yrs
- Wildfire 1/10 Low
- Heat 10/10 Extreme 7 d/yr ≥106°F today · 22 d/yr by 30 yrs out
- Wind 9/10 Extreme 99% chance of damaging wind over 30 yrs
- Air quality 2/10 Low 1 unhealthy d/yr today · 2 by 30 yrs out
Nearby sold comps map
Loading sold comps map…
Walkable amenities ~0.75 mi
Loading nearby amenities…
Taxation est. · year 1
- Rental income
- $16,822
- − Mortgage interest
- −$1,675
- − Property taxes
- −$695
- − Insurance
- −$150
- − Repairs & maintenance
- −$1,346
- − Management
- −$1,346
- − Depreciation
- −$870
- Taxable income
- $10,741
- Est. tax owed @ 24.0%
- −$2,578
- After-tax cash flow
- $7,985/yr
For passive investors: Depreciation is non-cash, so a rental often shows a tax loss while cash-flowing — sheltering income. Rental losses are passive: they offset passive income freely, and up to $25,000/yr can offset ordinary (W-2) income if you actively participate and your MAGI is under $100k (phasing out to $0 by $150k); unused losses carry forward. On sale, claimed depreciation is recaptured at up to 25%, and gains may owe capital-gains tax (a 1031 exchange can defer both). Figures are a year-1 estimate at your 24.0% rate — not tax advice; consult a CPA.
Schools (NCES district)
- District
- Moss Point Separate School District
- NCES district ID
- 2803000
- Math proficiency
- 17% ▼ -3.00%
- Reading proficiency
- 22% ▬ 0.00%
- Median HH income
- $38,041
- Composite
- 16.34/100
- National rank
- #9205
- State rank
- #94 of 130 in MS
Livability — Moss Point
- Score
- 67/100
- State rank
- #77
- US rank
- #10398
Category grades
Schools grade is shown separately in the Schools card above.
Census & demographics
- Census place
- Moss Point, MS
- City population
- 12,023
- Population (ZIP)
- 12,023
Population outlook (Jackson County) Hauer SSP2
- Today (2025)
- 146,926 people
- By 2030
- 148,442 · +1.0%
- By 2040
- 149,631 · +1.8%
- By 2050
- 148,723 · +1.2%
- By 2075
- 147,845 · +0.6%
- By 2100
- 144,510 · -1.6%
Race, ethnicity, and origin ACS 2023
- Neighborhood character
- Predominantly Black (74%)
- Race & ethnicity
- Black 74% White 18% Hispanic / Latino 4% Two or more races 2%
- Common ancestry
- Lithuanian 0%
- Foreign-born
- 1% · Canada
- Languages at home
- 97% English-only · Spanish 3%
Political lean MEDSL · Jackson
- 2024 margin
- Solid R (+39.9) · D 29.5% · R 69.4% · Other 1.1%
- 2008→2024 swing
- -6.4pp toward R · 2008: -33.5pp · 2024: -39.9pp
- All cycles
- 2024: R+39.9 2020: R+34.6 2016: R+39.9 2012: R+36.1 2008: R+33.5
Not yet ingested
- Civics
- —
Market trends
- HPI YoY
- ▲ 4.60%
- Current HPI
- 155.3138
- Rent YoY
- —
- Metro
- —
- State GDP YoY
- —
- F500 in state
- 0
Price history
-23.3% since first listed8 events — show timeline
- 2026-05-18 Pending — MLSU
- 2026-05-13 Relisted — MLSU
- 2026-05-13 Pending — MLSU
- 2026-05-07 Price Changed $29,900 MLSU
- 2026-04-08 Price Changed $38,000 MLSU
- 2026-04-08 Relisted — MLSU
- 2026-04-06 Pending — MLSU
- 2026-03-30 Listed $39,000 MLSU
Property tax history
+11.4%/yrLatest (2025): $695 · +6.3% YoY. Source: county tax records.
Cash-flow waterfall
monthlySold comps — $/sqft
last 12 mo · ≤1 miLoading sold comps…