 🏢 Co-op
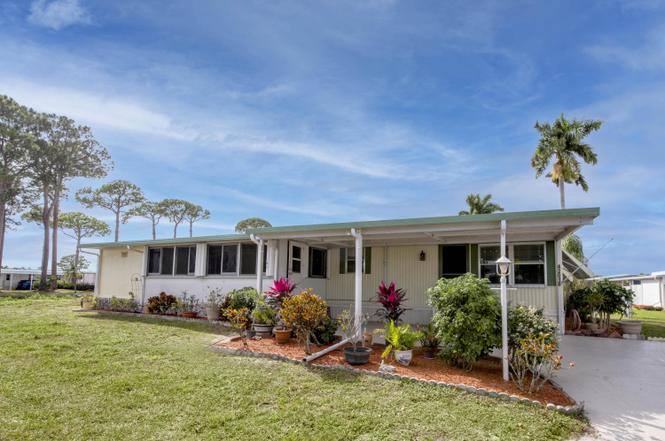
42016 Jima Bay · Boynton Beach, FL
Flood risk 1/10 · Minimal
- FEMA flood zone
- X (unshaded)
- Chance of flooding over 30 yrs
- 0.0%
- Est. flood insurance / yr
- $507 – $1,088
Fire risk 1/10 · Minimal
- Est. fire insurance / yr
- $947 – $1,759
Heat risk 9/10 · Severe
- Hot days now (above 106°F)
- 6 days/yr
- Hot days in 30 yrs
- 20 days/yr
Wind risk 10/10 · Severe
- Chance of severe wind over 30 yrs
- 99.0%
Air-quality risk 2/10 · Minimal
- Unhealthy air days now
- 1 days/yr
- Unhealthy air days in 30 yrs
- 2 days/yr
Risk factors via First Street. Map © Google.
Why this score? — see what drove the B grade
The composite is a weighted blend of 9 inputs, each scored 0–100. Each bar is that input's sub-score; the figure is the points it added to the 100-point composite (weight × sub-score).
- Cash flow +30.0/30.0
- 1% rule +10.0/10.0
- DSCR +10.0/10.0
- ARV discount +7.5/15.0
- Schools +4.3/10.0
- Livability +3.6/5.0
- Condition / age +2.5/5.0
- Rent growth +2.4/5.0
- Appreciation +0.0/10.0
$149,880
🖨 Deal sheet (PDF) 📄 Offer letter ✓ Due diligence
Listing remarks
NO land lease and LOW HOA! Spacious and full of potential, this 2-bedroom, 2-bath home offers 1,344 sq ft of living space, one of the largest two-bedroom floor plans in the Jamaica Bay 55+ community in Boynton Beach. Located at the end of a quiet cul-de-sac, the home offers added privacy and open green space to the rear. The interior is in original condition, providing a blank canvas to enjoy as-is, update gradually, or fully remodel. The expansive layout includes generous living and dining areas with excellent flow. Both bedrooms are well sized, with the primary suite featuring an en-suite bath. Jamaica Bay is a gated, resident-owned co-op community with no land lease. HOA is approximately
Key facts
- Gated community
- Quiet cul-de-sac
- Open green space
Tags
Property features AI
Finance
- Other: Pets allowed (restrictions and limits may apply)
- HOA & community: Has association; $270 monthly; Association covers maintenance of grounds, security, sewer, water, and common areas; Community amenities include clubhouse, pool, fitness center, billiard/game room, laundry, dog park, bocce, shuffleboard, pickleball courts, community room, and street lights; Senior community
Exterior
- Parking: Attached covered carport (1 space); 2 open parking spaces
- Security: Gated community with guard
- Utilities: Public water; Public sewer; Three-phase electric; Sewer and water available
- Home design: Manufactured home; Single-story; Entry-level living area; Faces east
- Construction: Modular construction; Aluminum and stone skirting; Aluminum roof; Built as resale
- Exterior features: Screened patio; Patio; Cul-de-sac lot; Waterfront
Interior
- Kitchen: Kitchen island
- Bedrooms: 2 bedrooms (all on the main level)
- Flooring: Carpet; Laminate; Vinyl
- Bathrooms: 2 full bathrooms (main level)
- Heating & cooling: Central heating (electric); Central air conditioning (electric); Ceiling fan(s)
- Interior features: Built-in features; Kitchen island; Wet bar; Walk-in closet(s); Decorative fireplace
- Laundry & utility: Inside laundry
Neighborhood map
What this means for you Summary
Snapshot
- This is a 3-bed/2.0-bath condo listed at $150k.
Deal economics
- At list price, monthly cash flow is $1k ($12k/yr) — positive.
- The deal already cash-flows at list — no discount required.
- Meets the 1% rule at list price ($3k rent vs $150k).
- Recommended offer: $132k (12.0% below list) — sets the bar for market timing.
- Cap rate 14.3% vs local median 4.3% in Boynton Beach — top-decile yield for the area; either an underpriced asset or a hidden risk that comps aren't pricing in. Stress-test before assuming the spread holds.
Location & tenants
- Location reads 72/100 on livability (#351 in FL) — a middle-class / working-renter tenant base. Strengths: housing A+, health & safety B+, cost of living B; Watch: amenities D+, crime D-, commute F.
- Palm Beach (suburban): math 46% / reading 53% proficiency, ranked #34 of 73 in FL (top 47%) — families likely to look elsewhere, expect single-tenant / working-renter base with shorter leases.
- Zoned schools: Hidden Oaks K-8 (math 42% / reading 53%, grade D, #1,182 of 2,144 statewide, top 55%, 785 students, 54% FRL); Congress Community Middle School (math 21% / reading 28%, grade F, #522 of 571 statewide, top 93%, 988 students, 72% FRL); Boynton Beach Community High (math 13% / reading 25%, grade F, #565 of 667 statewide, top 85%, 1,547 students, 65% FRL).
- Zoned-school proficiency averages 30% at this address vs 50% district-wide (-19 pts) — the specific schools serving this property underperform the Palm Beach average; the district grade overstates school quality for this exact location.
- Market conditions: Rents soft (-0.6%/yr); 456 active listings in the ZIP; 40 comparable units currently listed for rent nearby; rentals at typical pace (median 23d on market — plan ~3-4 weeks tenant-placement turnaround); solid renter incomes; 3,974 units permitted in Palm Beach County in 2024 (1,012 in 5+ unit buildings).
- This rent runs 44% of the median local income ($76k/yr) — at the standard rent-burdened threshold; future hikes will face affordability resistance.
Forward outlook
- Local home prices are declining (-3.0%/yr); year-one equity from $1k of loan paydown is wiped out by about $4k of value loss. Plan a longer hold.
- Palm Beach County population projected at +30% by 2050 — long-run rental-demand tailwind backs the buy-and-hold thesis.
- At projected returns (-3.0% appreciation + 0.0% rent growth), your $42k cash investment doubles in ~5 years — after that, you're playing with house money.
Negotiation context
- It's been on market 142 days — a 12% lower offer ($132k) is reasonable based on typical stale-listing flexibility.
Risks & watch-outs
- Climate carrying-cost: severe wind risk, 99% chance of damaging wind over 30y; extreme-heat days projected 6→20/yr by 2055 (HVAC capex compounding) — expect insurance premiums to compound above CPI over the hold.
Questions for the listing agent
- It's been on market 142 days. Have you received any prior offers? Is the seller open to a 12% concession, seller financing, or rate buy-down credit?
- What does the HOA fee cover, when was the last increase, and are there any pending special assessments or reserve-fund shortfalls?
- Any open or pending special assessments — roof, HVAC, plumbing, elevator, façade? What's the per-unit balance and payoff schedule, and is the seller paying it off at close or rolling it to the buyer?
- Why hasn't it sold? Are there any deal-killer items the seller is aware of (foundation, flood, title, zoning, code violations)?
- Is there a deadline driving the sale (1031 exchange, divorce, estate, relocation)? That informs how much negotiation room exists.
- Crime grade is D in this area — have there been break-ins, vandalism, or insurance claims at this property in the last 3 years? What carrier currently insures it and at what premium?
- What's the average days-on-market for RENTAL listings here right now (not sales)? A rising rental-DOM trend means longer vacancies and softer asking-rent achievability than the comps imply.
- What's the recent tenant-quality profile in this submarket — average credit score on applications, eviction rate, late-payment / NSF rate, and stable-employment percentage? A property-management company in the area should have these aggregated.
- How much new apartment / multifamily construction is in the pipeline within 1–3 miles? Heavy new supply (>2% of stock underway) typically softens rents 12–24 months out; light construction supports rent growth.
Investment metrics
- 1% rule
- 1.83% ✓
- Cap rate
- 14.30%
- Cash-on-cash
- 28.58%
- DSCR
- 2.27
- GRM
- 4.5
CMA / ARV
No comps found within radius.
Projected returns pro-forma
-3.0% appreciation · 0.0% rent growth · sell at horizon
- IRR
- 19.2%
- Equity multiple
- 1.75×
- Total profit
- $31,452
- Equity at exit
- $22,348
- IRR
- 25.3%
- Equity multiple
- 2.88×
- Total profit
- $78,751
- Equity at exit
- $12,959
Cash invested: $41,966 (down + closing). Projections, not guarantees.
Landlord ↔ Tenant lean methodology
- Overall (STATE)
- 87 Strongly Landlord-Friendly
- State Florida
- 87 Strongly Landlord-Friendly · R+3
- County
- — inherits STATE
- City
- — inherits STATE
ZIP-level market 33436
- Home prices YoY
- -26.0%
- Rents YoY
- -0.6%
- Active inventory
- 456
- Price-to-rent
- 4.5×
Monthly cashflow live
- Estimated rent
- $2,748 high interval (Pro) →
- Mortgage (P&I)
- −$786
- Tax from tax record
- −$53 /mo · $636/yr
- Insurance
- −$62
- HOA
- −$270
- Vacancy / Maint / Mgmt
- −$577
- Net cashflow
- $1,000
Break-even live
Sensitivity live
| Price | -10% $1,084 | -5% $1,042 | +0% $1,000 | +5% $957 | +10% $915 |
|---|---|---|---|---|---|
| Rent | -10% $783 | -5% $891 | +0% $1,000 | +5% $1,108 | +10% $1,217 |
| Rate | -1.0pp $1,075 | -0.5pp $1,038 | base $1,000 | +0.5pp $961 | +1.0pp $921 |
UW: 25.0% down · 7.5% · 30yr · 1.5% tax · 5.0% vac · 8.0% maint · 8.0% mgmt
Financing live
Cash to close
- Down payment
- $37,470
- Closing costs
- $4,496
- Reserves months
- —
- Total cash needed
- —
Loan-product check · same deal, 3 products live
Conventional
25% down · 7.5% · 30yr
- Down + closing
- —
- Monthly P&I
- —
- Monthly cashflow
- —
- DSCR
- —
- Eligible?
- —
Personal DTI + credit; lowest rate.
DSCR
20% down · 8.5% · 30yr
- Down + closing
- —
- Monthly P&I
- —
- Monthly cashflow
- —
- DSCR
- —
- Eligible?
- —
No personal income docs; deal must DSCR.
Hard money
10% down · 12.0% · 12mo
- Down + closing
- —
- Monthly P&I
- —
- Monthly cashflow
- —
- DSCR
- —
- Eligible?
- —
Short-term bridge; refi at stabilization.
Rent comps 40 comps
| Address | Beds | Baths | Sqft | Rent | $/sqft | DOM | Units | Dist |
|---|---|---|---|---|---|---|---|---|
| 4045 White Pine Dr Boynton Beach, FL | 3.0 | 2.0 | 1566 | $1,800 | $1.15 | 3d | 1 | 0.22mi |
| 8949 Oak St Boynton Beach, FL | 2.0 | 2.0 | 1040 | $1,300 | $1.25 | 26d | 1 | 0.39mi |
| 9498 S Military Trl #5 Boynton Beach, FL | 3.0 | 2.5 | 1317 | $2,900 | $2.20 | 26d | 1 | 0.65mi |
| 8202 White Rock Cir Boynton Beach, FL | 3.0 | 2.0 | 1738 | $3,300 | $1.90 | 9d | 1 | 0.67mi |
| 3962 Winfield Rd Unit 3962 Boynton Beach, FL | 4.0 | 2.0 | 1592 | $3,300 | $2.07 | 15d | 1 | 0.79mi |
| 3962 Winfield Rd Boynton Beach, FL | 4.0 | 2.0 | 1592 | $3,300 | $2.07 | 16d | 1 | 0.79mi |
| 3962 Winfield Rd Boynton Beach, FL | 4.0 | 2.0 | 1592 | $3,300 | $2.07 | 1d | 1 | 0.79mi |
| 3736 Coelebs Ave Boynton Beach, FL | 3.0 | 2.0 | 1232 | $3,000 | $2.44 | 26d | 1 | 0.86mi |
| 5155 Europa Dr Unit J Boynton Beach, FL | 3.0 | 2.0 | 1333 | $2,750 | $2.06 | 26d | 1 | 0.89mi |
| 3930 Max Pl Boynton Beach, FL | 3.0 | 2.0 | 1550 | $2,825 | $1.82 | 26d | 1 | 0.94mi |
| 3930 Max Pl Boynton Beach, FL | 2.0 | 2.0 | 1250 | $2,370 | $1.90 | 1d | 1 | 0.94mi |
| 9900 Pineapple Tree Dr #106 Boynton Beach, FL | 2.0 | 2.0 | 1008 | $2,250 | $2.23 | 26d | 1 | 0.94mi |
| 5373 Mirror Lakes Blvd Boynton Beach, FL | 3.0 | 2.0 | 1310 | $2,100 | $1.60 | 26d | 1 | 0.96mi |
| 9935 Pineapple Tree Dr #202 Boynton Beach, FL | 2.0 | 2.0 | 1008 | $2,575 | $2.55 | 16d | 1 | 0.98mi |
| 9766 Kamena Cir Boynton Beach, FL | 3.0 | 2.5 | 1596 | $3,300 | $2.07 | 7d | 1 | 1.00mi |
| 3500 Sandpiper Dr Boynton Beach, FL | 1.0–2.0 | 1.0–2.0 | 1147 | $2,579 | $2.25 | 23d | 22 | 1.01mi |
| 5299 Europa Dr Unit P Boynton Beach, FL | 3.0 | 2.0 | 1606 | $3,000 | $1.87 | 15d | 1 | 1.01mi |
| 5157 Floria Way Unit J Boynton Beach, FL | 3.0 | 2.0 | 1447 | $3,300 | $2.28 | 26d | 1 | 1.01mi |
| 4525 Nutmeg Tree Ln Unit A Boynton Beach, FL | 2.0 | 2.0 | 1404 | $3,000 | $2.14 | 26d | 1 | 1.01mi |
| 5234 Europa Dr Unit A Boynton Beach, FL | 3.0 | 2.0 | 1578 | $2,500 | $1.58 | 21d | 1 | 1.03mi |
| 9873 Lawrence Rd Boynton Beach, FL | 2.0 | 2.0 | 1200 | $2,267 | $1.89 | 23d | 1 | 1.06mi |
| 9873 Lawrence Rd Boynton Beach, FL | 2.0 | 2.0 | 1200 | $2,315 | $1.93 | 5d | 1 | 1.06mi |
| 920 Sun Acres Ln Boynton Beach, FL | 2.0 | 2.0 | 1352 | $2,200 | $1.63 | 26d | 1 | 1.07mi |
| 5133 Brisata Cir Unit P Boynton Beach, FL | 3.0 | 2.0 | 1374 | $2,800 | $2.04 | 26d | 1 | 1.09mi |
| 5537 Pebble Brook Ln Boynton Beach, FL | 3.0 | 2.0 | 1166 | $2,825 | $2.42 | 16d | 1 | 1.10mi |
| 5275 Europa Dr Unit I Boynton Beach, FL | 3.0 | 2.0 | 1282 | $2,500 | $1.95 | 3d | 1 | 1.14mi |
| 9842 Kamena Cir Boynton Beach, FL | 3.0 | 2.5 | 1596 | $2,800 | $1.75 | 26d | 1 | 1.14mi |
| 5072 Arbor Glen Cir Lake Worth, FL | 3.0 | 2.0 | 1232 | $3,300 | $2.68 | 16d | 1 | 1.16mi |
| 3561 Oberon Ave Boynton Beach, FL | 3.0 | 2.0 | 1248 | $2,850 | $2.28 | 22d | 1 | 1.17mi |
| 5418 Firenze Dr Unit P Boynton Beach, FL | 2.0 | 2.0 | 1139 | $2,400 | $2.11 | 4d | 1 | 1.19mi |
| 9746 Nickels Blvd Boynton Beach, FL | 2.0 | 2.0 | 1215 | $2,800 | $2.30 | 26d | 1 | 1.23mi |
| 190 Temple Ave Boynton Beach, FL | 3.0 | 2.0 | 1781 | $4,200 | $2.36 | 26d | 1 | 1.23mi |
| 4296 Grove Park Ln Boynton Beach, FL | 3.0 | 2.0 | 1696 | $3,350 | $1.98 | 26d | 1 | 1.26mi |
| 4220 Grove Park Ln Unit 1 Boynton Beach, FL | 3.0 | 2.0 | 1406 | $3,400 | $2.42 | 5d | 1 | 1.30mi |
| 4220 Grove Park Ln Unit 1 Boynton Beach, FL | 3.0 | 2.0 | 1406 | $3,600 | $2.56 | 26d | 1 | 1.30mi |
| 8520 Tourmaline Blvd Boynton Beach, FL | 4.0 | 2.0 | 1699 | $4,000 | $2.35 | 20d | 1 | 1.30mi |
| 9565 El Clair Ranch Rd Boynton Beach, FL | 3.0 | 2.0 | 1867 | $3,500 | $1.87 | 22d | 1 | 1.31mi |
| 9565 El Clair Ranch Rd Boynton Beach, FL | 3.0 | 2.0 | 1867 | $3,500 | $1.87 | 9d | 1 | 1.31mi |
| 7705 Forest Green Ln Boynton Beach, FL | 3.0 | 2.0 | 1379 | $3,200 | $2.32 | 26d | 1 | 1.32mi |
| 7705 Forest Green Ln Boynton Beach, FL | 2.0 | 2.0 | 1379 | $3,200 | $2.32 | 19d | 1 | 1.32mi |
HOA detail condo
- Monthly dues
- $270 · $3,240/yr
- Likely covers
- security
- Assessments
- None detected in remarks — confirm with the listing agent.
Listing history 18 events
-
2026-06-21days on market $149,880 Active 142 DOM
-
2026-06-18days on market $149,880 Active 139 DOM
-
2026-06-17days on market $149,880 Active 138 DOM
-
2026-06-16days on market $149,880 Active 137 DOM
-
2026-06-15days on market $149,880 Active 136 DOM
-
2026-06-13days on market $149,880 Active 134 DOM
-
2026-06-09days on market $149,880 Active 130 DOM
-
2026-06-07days on market $149,880 Active 128 DOM
-
2026-06-04days on market $149,880 Active 125 DOM
-
2026-06-03days on market $149,880 Active 124 DOM
-
2026-06-01days on market $149,880 Active 122 DOM
-
2026-05-31days on market $149,880 Active 121 DOM
-
2026-04-30price $149,890
-
2026-04-22price $149,900
-
2026-03-31price $154,990
-
2026-03-01price $155,000
-
2026-02-27price $158,990
-
2026-01-30$159,000 Active
ⓘ Source: listings_history table (triggers on properties + properties_extension) + one-shot
backfill from property_details.listing_events for pre-trigger history.
Tax reassessment forecast FL · Resets to sale price
- Current annual tax
- $636 · $53/mo
- Projected year-2 tax
- $1,244 · $104/mo
- Expected delta
- +$608/yr (+$51/mo · 95.5%)
ⓘ Screening estimate from a state-policy table — verify with the county assessor before closing.
Climate risk First Street
- Flood 1/10 Low FEMA zone X (unshaded) · 0% chance over 30 yrs
- Wildfire 1/10 Low
- Heat 9/10 Extreme 6 d/yr ≥106°F today · 20 d/yr by 30 yrs out
- Wind 10/10 Extreme 99% chance of damaging wind over 30 yrs
- Air quality 2/10 Low 1 unhealthy d/yr today · 2 by 30 yrs out
Nearby sold comps map
Loading sold comps map…
Walkable amenities ~0.75 mi
Loading nearby amenities…
Taxation est. · year 1
- Rental income
- $32,979
- − Mortgage interest
- −$8,396
- − Property taxes
- −$636
- − Insurance
- −$749
- − Repairs & maintenance
- −$2,638
- − Management
- −$2,638
- − HOA
- −$3,240
- − Depreciation
- −$4,360
- Taxable income
- $10,321
- Est. tax owed @ 24.0%
- −$2,477
- After-tax cash flow
- $9,519/yr
For passive investors: Depreciation is non-cash, so a rental often shows a tax loss while cash-flowing — sheltering income. Rental losses are passive: they offset passive income freely, and up to $25,000/yr can offset ordinary (W-2) income if you actively participate and your MAGI is under $100k (phasing out to $0 by $150k); unused losses carry forward. On sale, claimed depreciation is recaptured at up to 25%, and gains may owe capital-gains tax (a 1031 exchange can defer both). Figures are a year-1 estimate at your 24.0% rate — not tax advice; consult a CPA.
Schools (NCES district)
- District
- Palm Beach
- NCES district ID
- 1201500
- Math proficiency
- 46% ▼ -16.00%
- Reading proficiency
- 53% ▼ -4.00%
- Median HH income
- $53,943
- Composite
- 42.72/100
- National rank
- #3160
- State rank
- #34 of 73 in FL
Livability — Boynton Beach
- Score
- 72/100
- State rank
- #351
- US rank
- #6098
Category grades
Schools grade is shown separately in the Schools card above.
Census & demographics
- County
- Palm Beach County · 1,438,312 people
- City population
- 148,060
- Metro
- Miami-Fort Lauderdale-Pompano Beach, FL
- Population (ZIP)
- 48,743
- Household income
- $75,789
- Rent vs Own
- Severe rent burden
- 1813.0
Population outlook (Palm Beach County) Hauer SSP2
- Today (2025)
- 1,637,487 people
- By 2030
- 1,743,255 · +6.5%
- By 2040
- 1,948,712 · +19.0%
- By 2050
- 2,132,979 · +30.3%
- By 2075
- 2,530,027 · +54.5%
- By 2100
- 2,706,979 · +65.3%
Race, ethnicity, and origin ACS 2023
- Neighborhood character
- Diverse neighborhood (Simpson 0.64)
- Race & ethnicity
- White 52% Black 24% Hispanic / Latino 19% Two or more races 10% Asian 2%
- Hispanic origin (detail)
- Mexican 2% Puerto Rican 4% Cuban 3% Dominican 1%
- Common ancestry
- Hispanic 12% Romanian 3% Scotch-Irish 2%
- Foreign-born
- 27% · Canada, Jamaica, Vietnam
- Languages at home
- 64% English-only · Spanish 14% French/Haitian/Cajun 13% Other Indo-European 2%
Political lean MEDSL · Palm Beach
- 2024 margin
- Toss-up / Even · D 50.0% · R 49.2%
- 2008→2024 swing
- -22.1pp toward R · 2008: 22.9pp · 2024: 0.8pp
- All cycles
- 2024: D+0.8 2020: D+12.8 2016: D+15.3 2012: D+17.0 2008: D+22.9
Not yet ingested
- Civics
- —
Market trends
- HPI YoY
- ▼ -109.59%
- Current HPI
- 311.7742
- Rent YoY
- ▼ -0.57%
- Metro
- Miami-Fort Lauderdale-Pompano Beach, FL
- State GDP YoY
- ▲ 3.28%
- F500 in state
- 36
Industry mix (Fortune 500 HQ in FL)
| Industry | F500 HQs | Revenue |
|---|---|---|
| Industrial Technology | 2 | $29B |
|
||
| Insurance | 2 | $17B |
|
||
| Retail | 1 | $60B |
|
||
| Technology Distribution | 1 | $58B |
|
||
| Homebuilding | 1 | $35B |
|
||
| Technology Manufacturing | 1 | $35B |
|
||
Price history
-5.7% since first listed6 events — show timeline
- 2026-04-30 Price Changed $149,890 Beaches MLS
- 2026-04-22 Price Changed $149,900 Beaches MLS
- 2026-03-31 Price Changed $154,990 Beaches MLS
- 2026-03-01 Price Changed $155,000 Beaches MLS
- 2026-02-27 Price Changed $158,990 Beaches MLS
- 2026-01-30 Listed $159,000 Beaches MLS
Property tax history
+0.8%/yrLatest (2025): $636 · +4.1% YoY. Source: county tax records.
Cash-flow waterfall
monthlySold comps — $/sqft
last 12 mo · ≤1 miLoading sold comps…