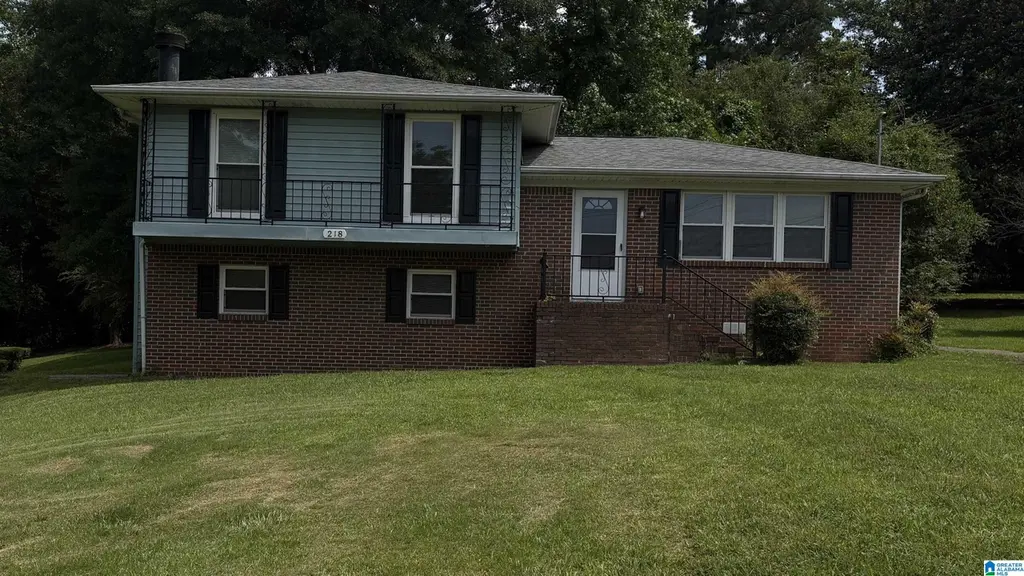
218 Mulberry Pl · Forestdale, AL
Flood risk 1/10 · Minimal
- FEMA flood zone
- X (unshaded)
- Chance of flooding over 30 yrs
- 0.0%
- Est. flood insurance / yr
- $473 – $860
Fire risk 2/10 · Minimal
- Est. fire insurance / yr
- $916 – $1,700
Heat risk 6/10 · Moderate
- Hot days now (above 106°F)
- 7 days/yr
- Hot days in 30 yrs
- 19 days/yr
Wind risk 6/10 · Moderate
- Chance of severe wind over 30 yrs
- 27.0%
Air-quality risk 4/10 · Minor
- Unhealthy air days now
- 4 days/yr
- Unhealthy air days in 30 yrs
- 8 days/yr
Risk factors via First Street. Map © Google.
Why this score? — see what drove the C- grade
The composite is a weighted blend of 9 inputs, each scored 0–100. Each bar is that input's sub-score; the figure is the points it added to the 100-point composite (weight × sub-score).
- Cash flow +19.0/30.0
- ARV discount +15.0/15.0
- DSCR +6.0/10.0
- 1% rule +4.3/10.0
- Livability +2.9/5.0
- Rent growth +2.7/5.0
- Condition / age +2.5/5.0
- Schools +1.8/10.0
- Appreciation +0.0/10.0
$144,900
🖨 Deal sheet 📄 Offer letter ✓ Due diligence
Listing remarks
Welcome to a charming single-family home in Birmingham, AL 35214, with 1438 square feet of living space with 3 bedrooms and 2 full bathrooms. Built in 1965, this well-located property sits on a spacious near half-acre lot in an established neighborhood, providing a peaceful residential setting with mature surroundings and plenty of outdoor potential. Inside, the home features a functional layout with generous living areas, comfortable bedroom sizes, and a fireplace that adds warmth and character. The exterior showcases a traditional wood and brick design, complemented by off-street parking for convenience. Ideally situated, the property offers easy access to local schools, shopping, dining,
Key facts
- Off street parking
- 0.47 acre lot
- Built 1965
Tags
Property features AI
Finance
- Other: Lot size approximately 0.47 acres; Subdivision: Darren Estates
- HOA & community: No association fee
Exterior
- Parking: Driveway parking; Off-street parking
- Utilities: Public water; Electric water heater; Internet service available
- Home design: Brick-over-foundation construction; Basement foundation; Existing (previously built) property
- Construction: Brick-over-foundation exterior; Basement foundation; Finished basement with poured concrete walls
- Exterior features: Fenced yard; Porch; BBQ area; Paved road access
Interior
- Kitchen: Laminate countertops; Dishwasher (built-in), refrigerator, electric stove
- Bedrooms: Master bedroom on main level; Additional bedrooms on main level (total of 3 bedrooms)
- Flooring: Carpet flooring
- Bathrooms: Two full bathrooms with tub/shower combos
- Heating & cooling: Electric forced-air heating; Central cooling
- Interior features: Finished full basement with poured concrete walls; Brick fireplace in the living room; Ceilings: other (see remarks); No additional interior features listed
- Laundry & utility: Main-level laundry with washer hookup; Dryer hookups for both electric and gas
Neighborhood map
What this means for you Summary
Snapshot
- This is a 3-bed/2.0-bath single-family listed at $145k.
Deal economics
- At list price, monthly cash flow is $151 ($2k/yr) — positive.
- The deal already cash-flows at list — no discount required.
- To meet the 1% rule (rent ≥ 1% of price), the offer needs to be $134k (7.3% below list).
- Recommended offer: $134k (7.3% below list) — sets the bar for 1% rule.
Location & tenants
- Location reads 58/100 on livability (#367 in AL) — a working-class tenant base; expect higher turnover. Strengths: cost of living A+, housing A+; Watch: employment D+, amenities F, commute F.
- Jefferson County (suburban): math 9% / reading 32% proficiency, ranked #104 of 129 in AL (top 81%) — low school quality limits family demand, transient renter base, plan for 1-2y turnover.
- Zoned schools: Minor High School (math 4% / reading 8%, grade F, #275 of 305 statewide, top 90%, 915 students, 84% FRL) — zoned schools average 84% FRL vs 49% district-wide (35 pts higher); higher-poverty schools than district average — tighter screening recommended.
- Zoned-school proficiency averages 6% at this address vs 20% district-wide (-15 pts) — the specific schools serving this property underperform the Jefferson County average; the district grade overstates school quality for this exact location.
- Market conditions: Rents flat; 116 active listings in the ZIP; 13 comparable units currently listed for rent nearby; rentals at typical pace (median 19d on market — plan ~3-4 weeks tenant-placement turnaround); 2,114 units permitted in Jefferson County in 2024 (556 in 5+ unit buildings).
Forward outlook
- Local home prices are declining (-3.0%/yr); year-one equity from $1k of loan paydown is wiped out by about $4k of value loss. Plan a longer hold.
- Jefferson County population projected to shrink 4% by 2050 — rents likely to lag national; underwrite the cash flow, not the appreciation.
Negotiation context
- Only 6 days on market — expect competitive offers; lowballing is unlikely to land.
Risks & watch-outs
- Climate carrying-cost: major wind risk, 27% chance of damaging wind over 30y; extreme-heat days projected 7→19/yr by 2055 (HVAC capex compounding) — expect insurance premiums to compound above CPI over the hold.
Questions for the listing agent
- Built in 1965 — when were the roof, HVAC, electrical panel, plumbing, and water heater last replaced?
- Is there a deadline driving the sale (1031 exchange, divorce, estate, relocation)? That informs how much negotiation room exists.
- Schools are D-rated, which usually means shorter tenancies and higher turnover. Who's the typical renter profile here, and what's been the actual vacancy rate?
- What's the average days-on-market for RENTAL listings here right now (not sales)? A rising rental-DOM trend means longer vacancies and softer asking-rent achievability than the comps imply.
- What's the recent tenant-quality profile in this submarket — average credit score on applications, eviction rate, late-payment / NSF rate, and stable-employment percentage? A property-management company in the area should have these aggregated.
- How much new for-sale + rental construction is in the pipeline within 1–3 miles? Heavy new supply typically softens prices + rents 12–24 months out; constrained supply supports both.
Investment metrics
- 1% rule
- 0.93% ✗
- Cap rate
- 7.54%
- Cash-on-cash
- 4.46%
- DSCR
- 1.20
- GRM
- 9.0
CMA / ARV
- ARV (on-the-fly)
- $190,532
- Comps found
- 12
Show comp detail 12 sales within ~0.75 mi
| Address | Dist | Beds/Ba | Sqft | Sold | Price | $/sf | Match |
|---|---|---|---|---|---|---|---|
| 2133 Arcadia Rd | 0.17mi | 3/2.0 | 1,770 (+1%) | 5mo | $207,000 | $117 | 86 |
| 360 Merrywood Dr | 0.39mi | 3/2.5 | 1,737 (-1%) | 16mo | $204,000 | $117 | 65 |
| 2057 Forestdale Blvd | 0.38mi | 3/2.0 | 1,880 (+8%) | 6mo | $147,450 | $78 | 64 |
| 533 Lanewood Dr | 0.61mi | 3/2.0 | 1,682 (-4%) | 2mo | $190,000 | $113 | 63 |
| 308 Echo Dr | 0.55mi | 3/2.0 | 1,618 (-7%) | 5mo | $100,000 | $62 | 58 |
| 2008 Roberta Rd | 0.25mi | 3/2.0 | 1,972 (+13%) | 11mo | $215,000 | $109 | 58 |
| 628 Heflin Ave E | 0.63mi | 4/3.0 (+1) | 1,753 (+0%) | 8mo | $76,000 | $43 | 55 |
| 288 Merrywood Dr | 0.47mi | 3/2.5 | 1,912 (+9%) | 10mo | $229,000 | $120 | 52 |
| 375 Clinton St | 0.33mi | 4/2.0 (+1) | 1,500 (-14%) | 9mo | $155,000 | $103 | 48 |
| 2021 Hanchey Rd | 0.59mi | 4/2.0 (+1) | 1,566 (-10%) | 8mo | $160,000 | $102 | 43 |
| 420 Heflin Ave | 0.63mi | 4/1.5 (+1) | 1,774 (+2%) | 24mo | $200,000 | $113 | 41 |
| 1740 Roberta Rd | 0.37mi | 2/1.0 (-1) | 1,512 (-14%) | 22mo | $85,405 | $56 | 33 |
Match score weights: distance 35% · size 25% · config 20% · recency 20%. Top-matched comps best support the ARV.
Projected returns pro-forma
-3.0% appreciation · 0.74% rent growth · sell at horizon
- IRR
- -11.7%
- Equity multiple
- 0.58×
- Total profit
- $-16,896
- Equity at exit
- $21,605
- IRR
- -6.0%
- Equity multiple
- 0.65×
- Total profit
- $-14,203
- Equity at exit
- $12,528
Cash invested: $40,572 (down + closing). Projections, not guarantees.
Landlord ↔ Tenant lean methodology
- Overall (STATE)
- 90 Strongly Landlord-Friendly
- State Alabama
- 90 Strongly Landlord-Friendly · R+15
- County
- — inherits STATE
- City
- — inherits STATE
ZIP-level market 35214
- Home prices YoY
- -20.0%
- Rents YoY
- 0.7%
- Active inventory
- 116
- Price-to-rent
- 9.0×
Monthly cashflow live
- Estimated rent
- $1,344 high interval (Pro) →
- Mortgage (P&I)
- −$760
- Tax from tax record
- −$90 /mo · $1,085/yr
- Insurance
- −$60
- HOA
- −$0
- Vacancy / Maint / Mgmt
- −$282
- Net cashflow
- $151
Break-even live
UW: 25.0% down · 7.5% · 30yr · 1.5% tax · 5.0% vac · 8.0% maint · 8.0% mgmt
Financing live
Cash to close
- Down payment
- $36,225
- Closing costs
- $4,347
- Reserves months
- —
- Total cash needed
- —
Loan-product check · same deal, 3 products live
Conventional
25% down · 7.5% · 30yr
- Down + closing
- —
- Monthly P&I
- —
- Monthly cashflow
- —
- DSCR
- —
- Eligible?
- —
Personal DTI + credit; lowest rate.
DSCR
20% down · 8.5% · 30yr
- Down + closing
- —
- Monthly P&I
- —
- Monthly cashflow
- —
- DSCR
- —
- Eligible?
- —
No personal income docs; deal must DSCR.
Hard money
10% down · 12.0% · 12mo
- Down + closing
- —
- Monthly P&I
- —
- Monthly cashflow
- —
- DSCR
- —
- Eligible?
- —
Short-term bridge; refi at stabilization.
Rent comps 13 comps
| Address | Beds | Baths | Sqft | Rent | $/sqft | DOM | Units | Dist |
|---|---|---|---|---|---|---|---|---|
| 1712 Riderwood Trl Birmingham, AL | 3.0 | 1.0 | 1456 | $1,150 | $0.79 | 16d | 1 | 0.39mi |
| 1533 Choctaw Dr Birmingham, AL | 3.0 | 1.0 | 1241 | $1,175 | $0.95 | 43d | 1 | 0.73mi |
| 308 Cimmaron Dr Birmingham, AL | 3.0 | 2.0 | 1479 | $1,250 | $0.85 | 43d | 1 | 0.76mi |
| 328 Cimmaron Dr Birmingham, AL | 3.0 | 1.0 | 1472 | $1,100 | $0.75 | 43d | 1 | 0.81mi |
| 656 Kenwood Dr Birmingham, AL | 3.0 | 1.0 | 1252 | $1,175 | $0.94 | 16d | 1 | 0.89mi |
| 779 Heflin Ave E Birmingham, AL | 3.0 | 1.5 | 1052 | $1,100 | $1.05 | 19d | 1 | 1.09mi |
| 2410 Roberta Rd Birmingham, AL | 3.0 | 2.0 | 1560 | $1,586 | $1.02 | 21d | 1 | 1.16mi |
| 634 Broken Bow Cir Birmingham, AL | 3.0 | 2.0 | 1890 | $1,625 | $0.86 | 19d | 1 | 1.22mi |
| 161 Cindy Ln Birmingham, AL | 3.0 | 2.0 | 1388 | $1,425 | $1.03 | 23d | 1 | 1.22mi |
| 305 Rose Hill Rd Birmingham, AL | 3.0 | 1.5 | 1285 | $1,200 | $0.93 | 10d | 1 | 1.38mi |
| 828 Clover Dr Birmingham, AL | 3.0 | 2.0 | 2028 | $1,500 | $0.74 | 1d | 1 | 1.41mi |
| 905 Lynndale Ln Birmingham, AL | 4.0 | 2.0 | 1625 | $1,550 | $0.95 | 1d | 1 | 1.42mi |
| 1647 Cherry Ave Birmingham, AL | 3.0 | 2.0 | 1079 | $1,150 | $1.07 | 11d | 1 | 1.48mi |
Listing history 6 events
-
2026-06-18days on market $144,900 Active 6 DOM
-
2026-06-17days on market $144,900 Active 5 DOM
-
2026-06-16days on market $144,900 Active 4 DOM
-
2026-06-15days on market $144,900 Active 3 DOM
-
2026-06-13remarks 699-char remark
-
2026-06-13$144,900 Active 1 DOM
ⓘ Source: listings_history table (triggers on properties + properties_extension) + one-shot
backfill from property_details.listing_events for pre-trigger history.
Tax reassessment forecast AL · Resets to sale price
- Current annual tax
- $1,085 · $90/mo
- Projected year-2 tax
- $1,085 · $90/mo
- Expected delta
- $0/yr ($0/mo · 0.0%)
ⓘ Screening estimate from a state-policy table — verify with the county assessor before closing.
Climate risk First Street
- Flood 1/10 Low FEMA zone X (unshaded) · 0% chance over 30 yrs
- Wildfire 2/10 Low
- Heat 6/10 Major 7 d/yr ≥106°F today · 19 d/yr by 30 yrs out
- Wind 6/10 Major 27% chance of damaging wind over 30 yrs
- Air quality 4/10 Moderate 4 unhealthy d/yr today · 8 by 30 yrs out
Nearby sold comps map
Loading sold comps map…
Walkable amenities ~0.75 mi
Loading nearby amenities…
Taxation est. · year 1
- Rental income
- $16,125
- − Mortgage interest
- −$8,117
- − Property taxes
- −$1,085
- − Insurance
- −$724
- − Repairs & maintenance
- −$1,290
- − Management
- −$1,290
- − Depreciation
- −$4,215
- Taxable loss
- −$597
- Est. tax savings @ 24.0%
- +$143
- After-tax cash flow
- $1,954/yr
For passive investors: Depreciation is non-cash, so a rental often shows a tax loss while cash-flowing — sheltering income. Rental losses are passive: they offset passive income freely, and up to $25,000/yr can offset ordinary (W-2) income if you actively participate and your MAGI is under $100k (phasing out to $0 by $150k); unused losses carry forward. On sale, claimed depreciation is recaptured at up to 25%, and gains may owe capital-gains tax (a 1031 exchange can defer both). Figures are a year-1 estimate at your 24.0% rate — not tax advice; consult a CPA.
Schools (NCES district)
- District
- Jefferson County
- NCES district ID
- 0101920
- Math proficiency
- 9% ▼ -24.00%
- Reading proficiency
- 32% ▼ -5.00%
- Median HH income
- $51,712
- Composite
- 18.4/100
- National rank
- #8937
- State rank
- #104 of 129 in AL
Livability — Forestdale
- Score
- 58/100
- State rank
- #367
- US rank
- #21236
Category grades
Schools grade is shown separately in the Schools card above.
Census & demographics
- Census place
- Forestdale, AL
- County
- Jefferson County · 527,445 people
- City population
- 17,027
- Metro
- Birmingham-Hoover, AL
- Population (ZIP)
- 17,027
- Household income
- $56,383
- Rent vs Own
- Severe rent burden
- 578.0
Population outlook (Jefferson County) Hauer SSP2
- Today (2025)
- 669,185 people
- By 2030
- 669,694 · +0.1%
- By 2040
- 661,388 · -1.2%
- By 2050
- 643,086 · -3.9%
- By 2075
- 577,267 · -13.7%
- By 2100
- 474,758 · -29.1%
Race, ethnicity, and origin ACS 2023
- Neighborhood character
- Predominantly Black (77%)
- Race & ethnicity
- Black 77% White 18% Two or more races 2%
- Foreign-born
- 1% · Canada
- Languages at home
- 98% English-only · Spanish 2%
Political lean MEDSL · Jefferson
- 2024 margin
- D (+10.4) · D 54.6% · R 44.2% · Other 1.2%
- 2008→2024 swing
- +5.4pp toward D · 2008: 5.1pp · 2024: 10.4pp
- All cycles
- 2024: D+10.4 2020: D+13.2 2016: D+7.2 2012: D+6.0 2008: D+5.1
Not yet ingested
- Civics
- —
Market trends
- HPI YoY
- ▼ -54.48%
- Current HPI
- 218.5233
- Rent YoY
- ▲ 0.74%
- Metro
- Birmingham-Hoover, AL
- State GDP YoY
- ▲ 2.94%
- F500 in state
- 4
Industry mix (Fortune 500 HQ in AL)
| Industry | F500 HQs | Revenue |
|---|---|---|
| Financial Services | 1 | $8B |
|
||
| Healthcare | 1 | $5B |
|
||
Price history
+326.2% since first listed6 events — show timeline
- 2026-06-12 Listed $144,900 Greater Alabama MLS
- 2024-03-12 Sold (Public Records) $417,784,000 Public Records
- 2018-06-19 Sold (Public Records) $70,000 Public Records
- 2007-05-02 Sold (Public Records) $92,900 Public Records
- 1987-04-10 Sold (Public Records) $49,500 Public Records
- 1980-10-01 Sold (Public Records) $34,000 Public Records
Property tax history
+9.6%/yrLatest (2025): $1,085 · +0.7% YoY. Source: county tax records.
Cash-flow waterfall
monthlySold comps — $/sqft
last 12 mo · ≤1 miLoading sold comps…