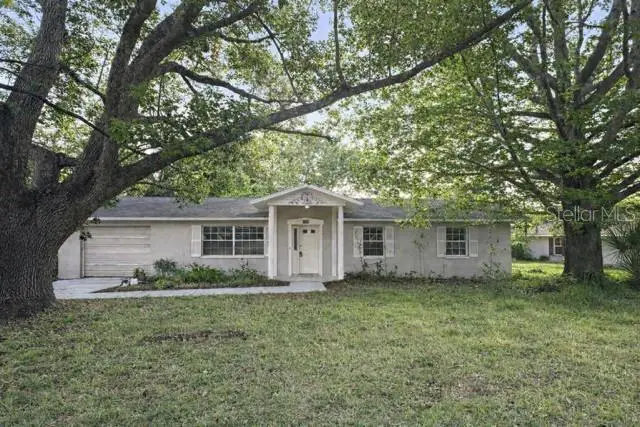
11836 Orange St · San Antonio, FL
Flood risk 1/10 · Minimal
- FEMA flood zone
- X (unshaded)
- Chance of flooding over 30 yrs
- 0.0%
- Est. flood insurance / yr
- $507 – $1,088
Fire risk 3/10 · Minor
- Est. fire insurance / yr
- $947 – $1,759
Heat risk 9/10 · Severe
- Hot days now (above 109°F)
- 7 days/yr
- Hot days in 30 yrs
- 26 days/yr
Wind risk 10/10 · Severe
- Chance of severe wind over 30 yrs
- 99.0%
Air-quality risk 2/10 · Minimal
- Unhealthy air days now
- 2 days/yr
- Unhealthy air days in 30 yrs
- 2 days/yr
Risk factors via First Street. Map © Google.
Why this score? — see what drove the B- grade
The composite is a weighted blend of 9 inputs, each scored 0–100. Each bar is that input's sub-score; the figure is the points it added to the 100-point composite (weight × sub-score).
- Cash flow +23.2/30.0
- ARV discount +14.5/15.0
- DSCR +7.5/10.0
- 1% rule +5.0/10.0
- Schools +4.3/10.0
- Appreciation +3.8/10.0
- Livability +3.5/5.0
- Rent growth +2.6/5.0
- Condition / age +2.5/5.0
$250,000
🖨 Deal sheet 📄 Offer letter ✓ Due diligence
Listing remarks
Under contract-accepting backup offers. Back on Market! Welcome to 11836 Orange Street, located in the beautiful community of Rosewood in San Antonio, Florida with NO HOA. This well-loved home has had only one owner and offers solid construction, wonderful bones, and endless potential for someone ready to bring their vision to life. Situated on one-third of an acre, the property provides space, privacy, and room to grow. Inside, you’ll find a large open family room filled with natural light from oversized windows. The kitchen features an eat-at island, a spacious pantry, and a sliding glass door that leads to the screened-in porch—perfect for enjoying Florida’s weather ye
Key facts
- In-law suite
- Eat-at island
- Spacious pantry
Tags
Property features AI
Finance
- Other: Zoned R2; Homestead exempt; Living area reported as 1,464 (public records); Total building area reported as 1,988 (public records)
- Financial info: No lease restrictions reported
- HOA & community: No HOA association reported; Pets allowed (cats and dogs)
Exterior
- Parking: Attached 1-car garage
- Utilities: Public water; Septic tank; Cable available; Electricity connected; Phone available
- Home design: Single-family residence; One story; Northwest facing
- Construction: Block construction; Shingle roof; Block foundation; Built on a 0.33-acre lot (approx. 1/4 to less than 1/2 acre)
- Exterior features: Paved lot/drive; Sliding doors
Interior
- Kitchen: Range; Refrigerator
- Bedrooms: 4 bedrooms
- Flooring: Laminate; Other
- Bathrooms: 2 full baths; 1 half bath
- Heating & cooling: Central heating (electric); Central air conditioning
- Interior features: Open floorplan; Sliding doors
- Laundry & utility: Laundry room; Laundry area in garage
Neighborhood map
What this means for you Summary
Snapshot
- This is a 4-bed/2.0-bath single-family listed at $250k.
Deal economics
- At list price, monthly cash flow is $453 ($5k/yr) — positive.
- The deal already cash-flows at list — no discount required.
- Meets the 1% rule at list price ($3k rent vs $250k).
- Cap rate 8.5% vs local median 3.4% in San Antonio — top-decile yield for the area; either an underpriced asset or a hidden risk that comps aren't pricing in. Stress-test before assuming the spread holds.
Location & tenants
- Location reads 69/100 on livability (#454 in FL) — a middle-class / working-renter tenant base. Strengths: crime A+, housing A+, cost of living A; Watch: amenities F, commute F, health & safety D-.
- Pasco (suburban): math 50% / reading 52% proficiency, ranked #32 of 73 in FL (top 44%) — acceptable for families but not a draw, mixed tenant base, ~2y average lease.
- Zoned schools: Pasco High School (math 40% / reading 40%, grade F, #296 of 667 statewide, top 45%, 1,639 students, 66% FRL) — zoned schools average 66% FRL vs 48% district-wide (17 pts higher); higher-poverty schools than district average — tighter screening recommended.
- Market conditions: Rents flat; 364 active listings in the ZIP; 21 comparable units currently listed for rent nearby; rentals at typical pace (median 22d on market — plan ~3-4 weeks tenant-placement turnaround); solid renter incomes; 6,765 units permitted in Pasco County in 2024 (1,250 in 5+ unit buildings).
- This rent runs 39% of the median local income ($76k/yr) — at the standard rent-burdened threshold; future hikes will face affordability resistance.
Forward outlook
- Local home prices are declining (-2.3%/yr); year-one equity from $2k of loan paydown is wiped out by about $6k of value loss. Plan a longer hold.
- Pasco County population projected at +29% by 2050 — long-run rental-demand tailwind backs the buy-and-hold thesis.
Negotiation context
- Only 13 days on market — expect competitive offers; lowballing is unlikely to land.
- 2 sale attempts with the ask held roughly flat each time — persistent listings suggest the price (not the market) is what's stuck; bring a comps-based counter.
Risks & watch-outs
- Climate carrying-cost: severe wind risk, 99% chance of damaging wind over 30y; extreme-heat days projected 7→26/yr by 2055 (HVAC capex compounding) — expect insurance premiums to compound above CPI over the hold.
Questions for the listing agent
- Is there a deadline driving the sale (1031 exchange, divorce, estate, relocation)? That informs how much negotiation room exists.
- Schools are D-rated, which usually means shorter tenancies and higher turnover. Who's the typical renter profile here, and what's been the actual vacancy rate?
- What's the average days-on-market for RENTAL listings here right now (not sales)? A rising rental-DOM trend means longer vacancies and softer asking-rent achievability than the comps imply.
- What's the recent tenant-quality profile in this submarket — average credit score on applications, eviction rate, late-payment / NSF rate, and stable-employment percentage? A property-management company in the area should have these aggregated.
- How much new for-sale + rental construction is in the pipeline within 1–3 miles? Heavy new supply typically softens prices + rents 12–24 months out; constrained supply supports both.
Investment metrics
- 1% rule
- 1.00% ✓
- Cap rate
- 8.47%
- Cash-on-cash
- 7.76%
- DSCR
- 1.35
- GRM
- 8.3
CMA / ARV
- ARV (on-the-fly)
- $295,728
- Comps found
- 12
Show comp detail 12 sales within ~0.75 mi
| Address | Dist | Beds/Ba | Sqft | Sold | Price | $/sf | Match |
|---|---|---|---|---|---|---|---|
| 32934 Osprey Peak Way | 0.40mi | 3/2.0 (-1) | 1,560 (+7%) | 3mo | $314,990 | $202 | 63 |
| 32909 Osprey Peak Way | 0.43mi | 3/2.0 (-1) | 1,560 (+7%) | 3mo | $339,990 | $218 | 61 |
| 12202 Meadow Ln | 0.55mi | 3/2.0 (-1) | 1,318 (-10%) | 0mo | $354,900 | $269 | 52 |
| 32810 Rustic Rise Rd | 0.70mi | 3/2.0 (-1) | 1,564 (+7%) | 0mo | $301,721 | $193 | 51 |
| 32821 Rustic Rise Rd | 0.69mi | 3/2.0 (-1) | 1,564 (+7%) | 2mo | $319,990 | $205 | 50 |
| 32791 Rustic Rise Rd | 0.72mi | 3/2.0 (-1) | 1,564 (+7%) | 1mo | $319,990 | $205 | 49 |
| 32804 Rustic Rise Rd | 0.71mi | 3/2.0 (-1) | 1,564 (+7%) | 2mo | $299,990 | $192 | 49 |
| 32782 Rustic Rise Rd | 0.73mi | 3/2.0 (-1) | 1,564 (+7%) | 3mo | $309,990 | $198 | 47 |
| 32785 Rustic Rise Rd | 0.72mi | 3/2.0 (-1) | 1,564 (+7%) | 3mo | $322,490 | $206 | 47 |
| 32777 Rustic Rise Rd | 0.73mi | 3/2.0 (-1) | 1,564 (+7%) | 3mo | $310,000 | $198 | 47 |
| 32766 Rustic Rise Rd | 0.74mi | 3/2.0 (-1) | 1,564 (+7%) | 3mo | $299,990 | $192 | 46 |
| 32774 Rustic Rise Rd | 0.74mi | 3/2.0 (-1) | 1,564 (+7%) | 4mo | $313,990 | $201 | 46 |
Match score weights: distance 35% · size 25% · config 20% · recency 20%. Top-matched comps best support the ARV.
Projected returns pro-forma
-2.32% appreciation · 0.37% rent growth · sell at horizon
- IRR
- -4.1%
- Equity multiple
- 0.84×
- Total profit
- $-11,055
- Equity at exit
- $44,923
- IRR
- 1.7%
- Equity multiple
- 1.12×
- Total profit
- $8,246
- Equity at exit
- $34,983
Cash invested: $70,000 (down + closing). Projections, not guarantees.
Landlord ↔ Tenant lean methodology
- Overall (STATE)
- 87 Strongly Landlord-Friendly
- State Florida
- 87 Strongly Landlord-Friendly · R+3
- County
- — inherits STATE
- City
- — inherits STATE
ZIP-level market 33576
- Home prices YoY
- -0.8%
- Rents YoY
- 0.4%
- Active inventory
- 364
- Price-to-rent
- 8.3×
Monthly cashflow live
- Estimated rent
- $2,512 high interval (Pro) →
- Mortgage (P&I)
- −$1,311
- Tax from tax record
- −$117 /mo · $1,403/yr
- Insurance
- −$104
- HOA
- −$0
- Vacancy / Maint / Mgmt
- −$528
- Net cashflow
- $453
Break-even live
UW: 25.0% down · 7.5% · 30yr · 1.5% tax · 5.0% vac · 8.0% maint · 8.0% mgmt
Financing live
Cash to close
- Down payment
- $62,500
- Closing costs
- $7,500
- Reserves months
- —
- Total cash needed
- —
Loan-product check · same deal, 3 products live
Conventional
25% down · 7.5% · 30yr
- Down + closing
- —
- Monthly P&I
- —
- Monthly cashflow
- —
- DSCR
- —
- Eligible?
- —
Personal DTI + credit; lowest rate.
DSCR
20% down · 8.5% · 30yr
- Down + closing
- —
- Monthly P&I
- —
- Monthly cashflow
- —
- DSCR
- —
- Eligible?
- —
No personal income docs; deal must DSCR.
Hard money
10% down · 12.0% · 12mo
- Down + closing
- —
- Monthly P&I
- —
- Monthly cashflow
- —
- DSCR
- —
- Eligible?
- —
Short-term bridge; refi at stabilization.
Rent comps 21 comps
| Address | Beds | Baths | Sqft | Rent | $/sqft | DOM | Units | Dist |
|---|---|---|---|---|---|---|---|---|
| 32909 Osprey Peak Way San Antonio, FL | 3.0 | 2.0 | 1560 | $2,350 | $1.51 | 24d | 1 | 0.43mi |
| 32783 Osprey Peak Way San Antonio, FL | 4.0 | 2.0 | 1846 | $2,200 | $1.19 | 24d | 1 | 0.51mi |
| 32650 Osprey Peak Way San Antonio, FL | 4.0 | 2.0 | 1846 | $2,600 | $1.41 | 12d | 1 | 0.62mi |
| 10959 Cotton Vale Pl San Antonio, FL | 3.0 | 2.0 | 1844 | $2,100 | $1.14 | 20d | 1 | 0.91mi |
| 10959 Cotton Vale Pl San Antonio, FL | 3.0 | 2.0 | 1844 | $2,100 | $1.14 | 3d | 1 | 0.91mi |
| 11545 Radiant Shore Loop San Antonio, FL | 3.0 | 2.0 | 1451 | $2,250 | $1.55 | 24d | 1 | 0.92mi |
| 10888 Quail Grove Way San Antonio, FL | 3.0 | 2.0 | 1690 | $2,400 | $1.42 | 24d | 1 | 0.98mi |
| 11608 Ascend Mirada Blvd San Antonio, FL | 1.0–3.0 | 1.0–2.0 | 1178 | $2,550 | $2.16 | 2d | 21 | 1.00mi |
| 11672 Radiant Shore Loop San Antonio, FL | 4.0 | 2.5 | 1870 | $2,495 | $1.33 | 15d | 1 | 1.04mi |
| 31825 Kestrel Calling Dr San Antonio, FL | 3.0 | 2.5 | 1602 | $2,300 | $1.44 | 24d | 1 | 1.11mi |
| 31478 Ocean Ave San Antonio, FL | 1.0–3.0 | 1.0–2.5 | 1119 | $2,499 | $2.23 | 3d | 47 | 1.19mi |
| 32067 Eastern Redbud Br San Antonio, FL | 3.0 | 2.5 | 1639 | $2,250 | $1.37 | 24d | 1 | 1.23mi |
| 32112 Pond Apple Bnd Unit 1 San Antonio, FL | 3.0 | 2.5 | 1700 | $2,000 | $1.18 | 24d | 1 | 1.26mi |
| 32118 Pond Apple Bnd San Antonio, FL | 3.0 | 2.5 | 1732 | $2,400 | $1.39 | 24d | 1 | 1.26mi |
| 10817 Ironwood Tree Way San Antonio, FL | 3.0 | 2.5 | 1694 | $2,250 | $1.33 | 24d | 1 | 1.27mi |
| 10817 Ironwood Tree Way San Antonio, FL | 3.0 | 2.5 | 1694 | $2,250 | $1.33 | 2d | 1 | 1.27mi |
| 10708 Ironwood Tree Way San Antonio, FL | 3.0 | 2.5 | 1600 | $2,100 | $1.31 | 18d | 1 | 1.31mi |
| 10715 Ironwood Tree Way San Antonio, FL | 3.0 | 2.5 | 1681 | $2,050 | $1.22 | 15d | 1 | 1.32mi |
| 10647 Ironwood Tree Way San Antonio, FL | 3.0 | 2.5 | 1712 | $2,400 | $1.40 | 24d | 1 | 1.37mi |
| 11126 Tidepool Ct Unit Na San Antonio, FL | 3.0 | 2.5 | 1788 | $3,200 | $1.79 | 20d | 1 | 1.43mi |
| 11126 Tidepool Ct San Antonio, FL | 3.0 | 2.5 | 1788 | $3,200 | $1.79 | 22d | 1 | 1.43mi |
Listing history 4 events
-
2026-05-19status Pending
-
2026-05-11status Active
-
2026-04-21status Pending
-
2026-04-16$250,000 Active
ⓘ Source: listings_history table (triggers on properties + properties_extension) + one-shot
backfill from property_details.listing_events for pre-trigger history.
Tax reassessment forecast FL · Resets to sale price
- Current annual tax
- $1,403 · $117/mo
- Projected year-2 tax
- $2,075 · $173/mo
- Expected delta
- +$672/yr (+$56/mo · 47.9%)
ⓘ Screening estimate from a state-policy table — verify with the county assessor before closing.
Climate risk First Street
- Flood 1/10 Low FEMA zone X (unshaded) · 0% chance over 30 yrs
- Wildfire 3/10 Moderate
- Heat 9/10 Extreme 7 d/yr ≥109°F today · 26 d/yr by 30 yrs out
- Wind 10/10 Extreme 99% chance of damaging wind over 30 yrs
- Air quality 2/10 Low 2 unhealthy d/yr today · 2 by 30 yrs out
Nearby sold comps map
Loading sold comps map…
Walkable amenities ~0.75 mi
Loading nearby amenities…
Taxation est. · year 1
- Rental income
- $30,148
- − Mortgage interest
- −$14,004
- − Property taxes
- −$1,403
- − Insurance
- −$1,250
- − Repairs & maintenance
- −$2,412
- − Management
- −$2,412
- − Depreciation
- −$7,273
- Taxable income
- $1,395
- Est. tax owed @ 24.0%
- −$335
- After-tax cash flow
- $5,097/yr
For passive investors: Depreciation is non-cash, so a rental often shows a tax loss while cash-flowing — sheltering income. Rental losses are passive: they offset passive income freely, and up to $25,000/yr can offset ordinary (W-2) income if you actively participate and your MAGI is under $100k (phasing out to $0 by $150k); unused losses carry forward. On sale, claimed depreciation is recaptured at up to 25%, and gains may owe capital-gains tax (a 1031 exchange can defer both). Figures are a year-1 estimate at your 24.0% rate — not tax advice; consult a CPA.
Schools (NCES district)
- District
- Pasco
- NCES district ID
- 1201530
- Math proficiency
- 50% ▼ -10.00%
- Reading proficiency
- 52% ▼ -5.00%
- Median HH income
- $45,039
- Composite
- 43.14/100
- National rank
- #3074
- State rank
- #32 of 73 in FL
Livability — San Antonio
- Score
- 69/100
- State rank
- #454
- US rank
- #8221
Category grades
Schools grade is shown separately in the Schools card above.
Census & demographics
- Census place
- San Antonio, FL
- County
- Pasco County · 524,098 people
- City population
- 6,273
- Metro
- Tampa-St. Petersburg-Clearwater, FL
- Population (ZIP)
- 6,273
- Household income
- $76,388
- Rent vs Own
- Severe rent burden
- 31.0
Population outlook (Pasco County) Hauer SSP2
- Today (2025)
- 570,045 people
- By 2030
- 605,844 · +6.3%
- By 2040
- 674,806 · +18.4%
- By 2050
- 736,022 · +29.1%
- By 2075
- 862,900 · +51.4%
- By 2100
- 906,364 · +59.0%
Race, ethnicity, and origin ACS 2023
- Neighborhood character
- Predominantly White (81%)
- Race & ethnicity
- White 81% Hispanic / Latino 12% Two or more races 5% Black 5%
- Hispanic origin (detail)
- Mexican 3% Puerto Rican 5%
- Common ancestry
- Romanian 5% Lithuanian 3% Slovak 2%
- Foreign-born
- 7% · Canada
- Languages at home
- 91% English-only · Spanish 6% Other Indo-European 1%
Political lean MEDSL · Pasco
- 2024 margin
- Strong R (+25.2) · D 36.9% · R 62.1% · Other 1.0%
- 2008→2024 swing
- -21.6pp toward R · 2008: -3.6pp · 2024: -25.2pp
- All cycles
- 2024: R+25.2 2020: R+20.1 2016: R+21.6 2012: R+6.7 2008: R+3.6
Not yet ingested
- Civics
- —
Market trends
- HPI YoY
- ▼ -2.32%
- Current HPI
- 281.7138
- Rent YoY
- ▲ 0.37%
- Metro
- Tampa-St. Petersburg-Clearwater, FL
- State GDP YoY
- ▲ 3.28%
- F500 in state
- 36
Industry mix (Fortune 500 HQ in FL)
| Industry | F500 HQs | Revenue |
|---|---|---|
| Industrial Technology | 2 | $29B |
|
||
| Insurance | 2 | $17B |
|
||
| Retail | 1 | $60B |
|
||
| Technology Distribution | 1 | $58B |
|
||
| Homebuilding | 1 | $35B |
|
||
| Technology Manufacturing | 1 | $35B |
|
||
Price history
4 events — show timeline
- 2026-05-19 Pending — Stellar MLS as Distributed by MLS Grid
- 2026-05-11 Relisted — Stellar MLS as Distributed by MLS Grid
- 2026-04-21 Pending — Stellar MLS as Distributed by MLS Grid
- 2026-04-16 Listed $250,000 Stellar MLS as Distributed by MLS Grid
Property tax history
+2.5%/yrLatest (2025): $1,403 · +3.3% YoY. Source: county tax records.
Cash-flow waterfall
monthlySold comps — $/sqft
last 12 mo · ≤1 miLoading sold comps…