 🏗️ New Construction
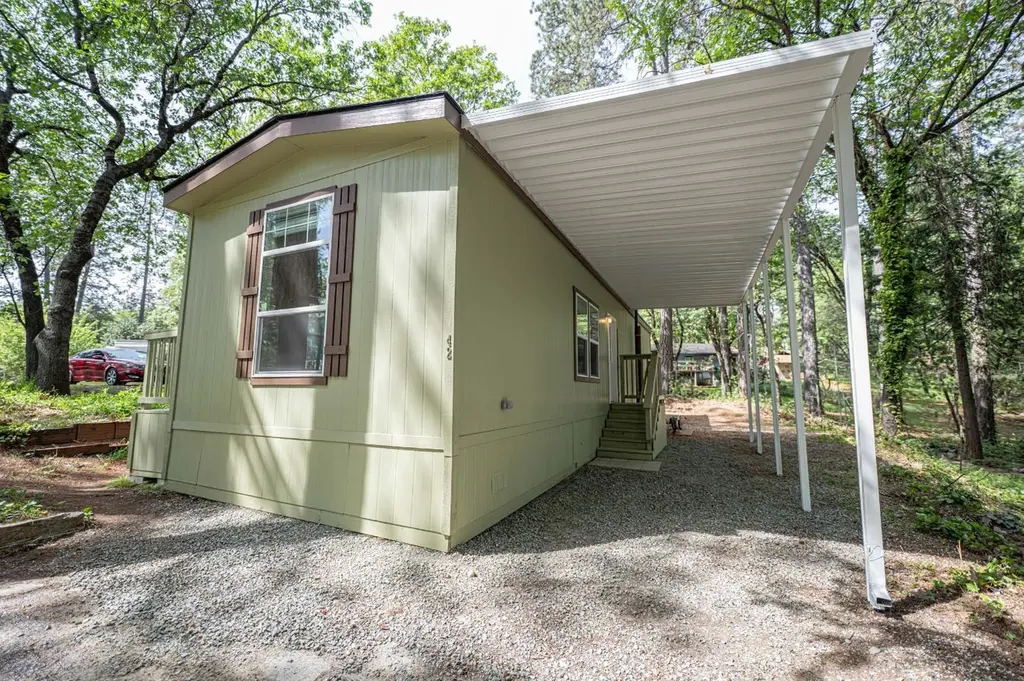
15329 Little Valley Rd #42 · Alta Sierra, CA
Flood risk 1/10 · Minimal
- FEMA flood zone
- X (unshaded)
- Chance of flooding over 30 yrs
- 0.0%
- Est. flood insurance / yr
- $507 – $1,088
Fire risk 9/10 · Severe
- Est. fire insurance / yr
- $659 – $1,223
Heat risk 5/10 · Moderate
- Hot days now (above 97°F)
- 7 days/yr
- Hot days in 30 yrs
- 16 days/yr
Wind risk 1/10 · Minimal
- Chance of severe wind over 30 yrs
- —
Air-quality risk 10/10 · Severe
- Unhealthy air days now
- 31 days/yr
- Unhealthy air days in 30 yrs
- 40 days/yr
Risk factors via First Street. Map © Google.
Why this score? — see what drove the B- grade
The composite is a weighted blend of 9 inputs, each scored 0–100. Each bar is that input's sub-score; the figure is the points it added to the 100-point composite (weight × sub-score).
- Cash flow +30.0/30.0
- 1% rule +10.0/10.0
- DSCR +10.0/10.0
- ARV discount +7.5/15.0
- Schools +3.8/10.0
- Livability +3.0/5.0
- Rent growth +2.5/5.0
- Condition / age +2.5/5.0
- Appreciation +0.0/10.0
$124,900
🖨 Deal sheet 📄 Offer letter ✓ Due diligence
Listing remarks
Don't miss this brand-new home, thoughtfully designed with modern finishes and everyday convenience in mind. The kitchen features stainless steel appliances, including a gas range, refrigerator, and dishwasher, complemented by elegant stone countertops. Inside, you'll find double sinks, a relaxing jetted bathtub, and the added convenience of in-home washer and dryer hookups. Set among towering trees in the quiet Grass Valley Mobile Home Village, this welcoming community blends comfort with convenience. Residents can enjoy a seasonal pool, a well-equipped clubhouse with laundry facilities, and a spacious layout that promotes a calm, relaxed atmosphere. Located just off Highway 49, the home i
Key facts
- Double sinks
- Stone countertops
- Jetted bathtub
Tags
Property features AI
Finance
- Other: Directions: Hwy 49 to Little Valley Road. Turn left into the park, keep left once in the park and follow the road up the hill. After the road turns to the right at the top of the hill, the home will be on your left.
- Financial info: Land lease: No (land lease amount listed but land lease indicated as No)
- HOA & community: No association
Exterior
- Parking: Attached covered parking; Guest parking available
- Utilities: Public water; Private sewer; Individual gas meter; Cable available; Electric: Other
- Home design: Manufactured in park; Single wide; New construction; Model: CREEKSIDE MANOR; Manufacturer: Champion Home Builders; Entry facing direction not specified; 2,025 year built (as listed)
- Construction: Shingle roof; Skirting: Other; Foundation details not specified
- Exterior features: Front yard
Interior
- Kitchen: Free standing gas range; Free standing gas oven; Hood over range; Dishwasher; Microwave; Stone counters
- Bedrooms: 1 bedroom (master bedroom)
- Flooring: Carpet; Linoleum
- Bathrooms: 1 full bathroom; Double sinks; Jetted tub
- Heating & cooling: Central heating; Cooling: Other
- Interior features: Covered patio; Dual-pane full windows; Pets allowed; Family room, kitchen and master bedroom included; Kitchen/Family combo layout; Stone countertops
- Laundry & utility: Inside laundry room; Washer/dryer hookups only; Electric and gas hookups
Neighborhood map
What this means for you Summary
Snapshot
- This is a 2-bed/1.0-bath manufactured listed at $125k.
Deal economics
- At list price, monthly cash flow is $933 ($11k/yr) — positive.
- The deal already cash-flows at list — no discount required.
- Meets the 1% rule at list price ($2k rent vs $125k).
- Recommended offer: $117k (6.0% below list) — sets the bar for market timing.
- Cap rate 16.3% vs local median 3.4% in Alta Sierra — top-decile yield for the area; either an underpriced asset or a hidden risk that comps aren't pricing in. Stress-test before assuming the spread holds.
Location & tenants
- Location reads 59/100 on livability (#662 in CA) — a working-class tenant base; expect higher turnover. Strengths: employment A+, housing A+; Watch: crime C-, schools D+, amenities F.
- Nevada Joint Union High (town): math 25% / reading 61% proficiency, ranked #201 of 517 in CA (top 39%) — families likely to look elsewhere, expect single-tenant / working-renter base with shorter leases.
- Market conditions: 252 active listings in the ZIP; 1 comparable units currently listed for rent nearby; solid renter incomes; 215 units permitted in Nevada County in 2024 (0 in 5+ unit buildings).
Forward outlook
- Local home prices are declining (-3.0%/yr); year-one equity from $772 of loan paydown is wiped out by about $3k of value loss. Plan a longer hold.
- Nevada County population projected at -14% by 2050 — secular population decline; favor cash flow + early exit over multi-decade hold.
- At projected returns (-3.0% appreciation + 3.0% rent growth), your $31k cash investment doubles in ~4 years — after that, you're playing with house money.
Negotiation context
- It's been on market 83 days — a 6% lower offer ($117k) is reasonable based on typical stale-listing flexibility.
Risks & watch-outs
- Climate carrying-cost: severe wildfire risk; extreme-heat days projected 7→16/yr by 2055 (HVAC capex compounding) — expect insurance premiums to compound above CPI over the hold.
Questions for the listing agent
- It's been on market 83 days. Have you received any prior offers? Is the seller open to a 6% concession, seller financing, or rate buy-down credit?
- Why hasn't it sold? Are there any deal-killer items the seller is aware of (foundation, flood, title, zoning, code violations)?
- Is there a deadline driving the sale (1031 exchange, divorce, estate, relocation)? That informs how much negotiation room exists.
- Schools are D-rated, which usually means shorter tenancies and higher turnover. Who's the typical renter profile here, and what's been the actual vacancy rate?
- What's the average days-on-market for RENTAL listings here right now (not sales)? A rising rental-DOM trend means longer vacancies and softer asking-rent achievability than the comps imply.
- What's the recent tenant-quality profile in this submarket — average credit score on applications, eviction rate, late-payment / NSF rate, and stable-employment percentage? A property-management company in the area should have these aggregated.
- How much new for-sale + rental construction is in the pipeline within 1–3 miles? Heavy new supply typically softens prices + rents 12–24 months out; constrained supply supports both.
Investment metrics
- 1% rule
- 1.93% ✓
- Cap rate
- 16.31%
- Cash-on-cash
- 35.79%
- DSCR
- 2.59
- GRM
- 4.3
CMA / ARV
- ARV (on-the-fly)
- $111,720
- Comps found
- 7
Show comp detail 7 sales within ~0.75 mi
| Address | Dist | Beds/Ba | Sqft | Sold | Price | $/sf | Match |
|---|---|---|---|---|---|---|---|
| 10070 Dalewood Way | 0.20mi | 2/2.0 | 1,152 (+1%) | 4mo | $130,000 | $113 | 82 |
| 10096 Daisy King Dr | 0.46mi | 2/2.0 | 1,200 (+5%) | 7mo | $27,500 | $23 | 60 |
| 10160 Timberland Dr | 0.20mi | 2/2.0 | 1,056 (-7%) | 22mo | $150,000 | $142 | 56 |
| 10088 Heritage Oak Dr | 0.34mi | 3/2.0 (+1) | 1,280 (+12%) | 9mo | $219,000 | $171 | 47 |
| 10235 Forest Springs Dr | 0.39mi | 2/2.0 | 1,296 (+14%) | 17mo | $63,000 | $49 | 41 |
| 10204 Stone Arch Dr | 0.64mi | 2/2.0 | 1,248 (+10%) | 12mo | $89,000 | $71 | 40 |
| 10123 Hidden Springs Dr #226 | 0.57mi | 2/2.0 | 1,274 (+12%) | 20mo | $125,000 | $98 | 33 |
Match score weights: distance 35% · size 25% · config 20% · recency 20%. Top-matched comps best support the ARV.
Projected returns pro-forma
-3.0% appreciation · 3.0% rent growth · sell at horizon
- IRR
- 31.5%
- Equity multiple
- 2.32×
- Total profit
- $41,346
- Equity at exit
- $16,658
- IRR
- 38.6%
- Equity multiple
- 4.60×
- Total profit
- $112,645
- Equity at exit
- $9,660
Cash invested: $31,282 (down + closing). Projections, not guarantees.
Landlord ↔ Tenant lean methodology
- Overall (STATE)
- 18 Strongly Tenant-Friendly
- State California
- 18 Strongly Tenant-Friendly · D+13
- County
- — inherits STATE
- City
- — inherits STATE
ZIP-level market 95949
- Home prices YoY
- -34.7%
- Active inventory
- 252
- Price-to-rent
- 4.8×
Monthly cashflow live
- Estimated rent
- $2,158 medium interval (Pro) →
- Mortgage (P&I)
- −$586
- Tax est. 1.5%
- −$140 /mo · $1,676/yr
- Insurance
- −$47
- HOA
- −$0
- Vacancy / Maint / Mgmt
- −$453
- Net cashflow
- $933
Break-even live
UW: 25.0% down · 7.5% · 30yr · 1.5% tax · 5.0% vac · 8.0% maint · 8.0% mgmt
Financing live
Cash to close
- Down payment
- $27,930
- Closing costs
- $3,352
- Reserves months
- —
- Total cash needed
- —
Loan-product check · same deal, 3 products live
Conventional
25% down · 7.5% · 30yr
- Down + closing
- —
- Monthly P&I
- —
- Monthly cashflow
- —
- DSCR
- —
- Eligible?
- —
Personal DTI + credit; lowest rate.
DSCR
20% down · 8.5% · 30yr
- Down + closing
- —
- Monthly P&I
- —
- Monthly cashflow
- —
- DSCR
- —
- Eligible?
- —
No personal income docs; deal must DSCR.
Hard money
10% down · 12.0% · 12mo
- Down + closing
- —
- Monthly P&I
- —
- Monthly cashflow
- —
- DSCR
- —
- Eligible?
- —
Short-term bridge; refi at stabilization.
Rent comps 1 comps
| Address | Beds | Baths | Sqft | Rent | $/sqft | DOM | Units | Dist |
|---|---|---|---|---|---|---|---|---|
| 15487 Kingsbury Cir Grass Valley, CA | 2.0 | 2.0 | 1200 | $2,000 | $1.67 | 3d | 1 | 1.46mi |
Listing history 16 events
-
2026-06-19days on market $124,900 Active 83 DOM
-
2026-06-18days on market $124,900 Active 82 DOM
-
2026-06-17days on market $124,900 Active 81 DOM
-
2026-06-16days on market $124,900 Active 80 DOM
-
2026-06-15days on market $124,900 Active 79 DOM
-
2026-06-13days on market $124,900 Active 77 DOM
-
2026-06-13days on market $124,900 Active 76 DOM
-
2026-06-10days on market $124,900 Active 74 DOM
-
2026-06-09days on market $124,900 Active 73 DOM
-
2026-06-08days on market $124,900 Active 72 DOM
-
2026-06-07days on market $124,900 Active 71 DOM
-
2026-06-05days on market $124,900 Active 68 DOM
-
2026-06-03days on market $124,900 Active 67 DOM
-
2026-06-02days on market $124,900 Active 66 DOM
-
2026-06-01days on market $124,900 Active 65 DOM
-
2026-05-31days on market $124,900 Active 64 DOM
ⓘ Source: listings_history table (triggers on properties + properties_extension) + one-shot
backfill from property_details.listing_events for pre-trigger history.
Climate risk First Street
- Flood 1/10 Low FEMA zone X (unshaded) · 0% chance over 30 yrs
- Wildfire 9/10 Extreme
- Heat 5/10 Major 7 d/yr ≥97°F today · 16 d/yr by 30 yrs out
- Wind 1/10 Low
- Air quality 10/10 Extreme 31 unhealthy d/yr today · 40 by 30 yrs out
Nearby sold comps map
Loading sold comps map…
Walkable amenities ~0.75 mi
Loading nearby amenities…
Taxation est. · year 1
- Rental income
- $25,898
- − Mortgage interest
- −$6,258
- − Property taxes
- −$1,676
- − Insurance
- −$559
- − Repairs & maintenance
- −$2,072
- − Management
- −$2,072
- − Depreciation
- −$3,250
- Taxable income
- $10,012
- Est. tax owed @ 24.0%
- −$2,403
- After-tax cash flow
- $8,792/yr
For passive investors: Depreciation is non-cash, so a rental often shows a tax loss while cash-flowing — sheltering income. Rental losses are passive: they offset passive income freely, and up to $25,000/yr can offset ordinary (W-2) income if you actively participate and your MAGI is under $100k (phasing out to $0 by $150k); unused losses carry forward. On sale, claimed depreciation is recaptured at up to 25%, and gains may owe capital-gains tax (a 1031 exchange can defer both). Figures are a year-1 estimate at your 24.0% rate — not tax advice; consult a CPA.
Schools (NCES district)
- District
- Nevada Joint Union High
- NCES district ID
- 0626880
- Math proficiency
- 25% ▼ -14.00%
- Reading proficiency
- 61% ▼ -7.00%
- Median HH income
- $57,336
- Composite
- 37.53/100
- National rank
- #4393
- State rank
- #201 of 517 in CA
Livability — Alta Sierra
- Score
- 59/100
- State rank
- #662
- US rank
- #20497
Category grades
Schools grade is shown separately in the Schools card above.
Census & demographics
- County
- Nevada County · 85,339 people
- Metro
- Truckee-Grass Valley, CA
- Population (ZIP)
- 20,552
- Household income
- $98,181
- Rent vs Own
- Severe rent burden
- 181.0
Population outlook (Nevada County) Hauer SSP2
- Today (2025)
- 98,490 people
- By 2030
- 97,295 · -1.2%
- By 2040
- 92,041 · -6.5%
- By 2050
- 85,164 · -13.5%
- By 2075
- 68,436 · -30.5%
- By 2100
- 49,536 · -49.7%
Race, ethnicity, and origin ACS 2023
- Neighborhood character
- Predominantly White (84%)
- Race & ethnicity
- White 84% Hispanic / Latino 8% Two or more races 8% Native American 1%
- Hispanic origin (detail)
- Mexican 6%
- Common ancestry
- Lithuanian 4% Italian 4% Slovak 2%
- Foreign-born
- 4% · Canada
- Languages at home
- 94% English-only · Spanish 3% Other Indo-European 1%
Political lean MEDSL · Nevada
- 2024 margin
- D (+12.2) · D 54.4% · R 42.1% · Other 3.5%
- 2008→2024 swing
- +6.9pp toward D · 2008: 5.3pp · 2024: 12.2pp
- All cycles
- 2024: D+12.2 2020: D+14.8 2016: D+4.5 2012: R+4.7 2008: D+5.3
Not yet ingested
- Civics
- —
Market trends
- HPI YoY
- ▼ -122.41%
- Current HPI
- 230.2373
- Rent YoY
- —
- Metro
- Truckee-Grass Valley, CA
- State GDP YoY
- ▲ 3.21%
- F500 in state
- 116
Industry mix (Fortune 500 HQ in CA)
| Industry | F500 HQs | Revenue |
|---|---|---|
| Technology | 27 | $1,492B |
|
||
| Financial Services | 3 | $174B |
|
||
| Retail | 3 | $44B |
|
||
| Insurance | 3 | $26B |
|
||
| Media / Entertainment | 2 | $115B |
|
||
| Pharmaceuticals / Biotech | 2 | $62B |
|
||
Property tax history
-64.5%/yrLatest (2021): $30 · -87.7% YoY. Source: county tax records.
Cash-flow waterfall
monthlySold comps — $/sqft
last 12 mo · ≤1 miLoading sold comps…