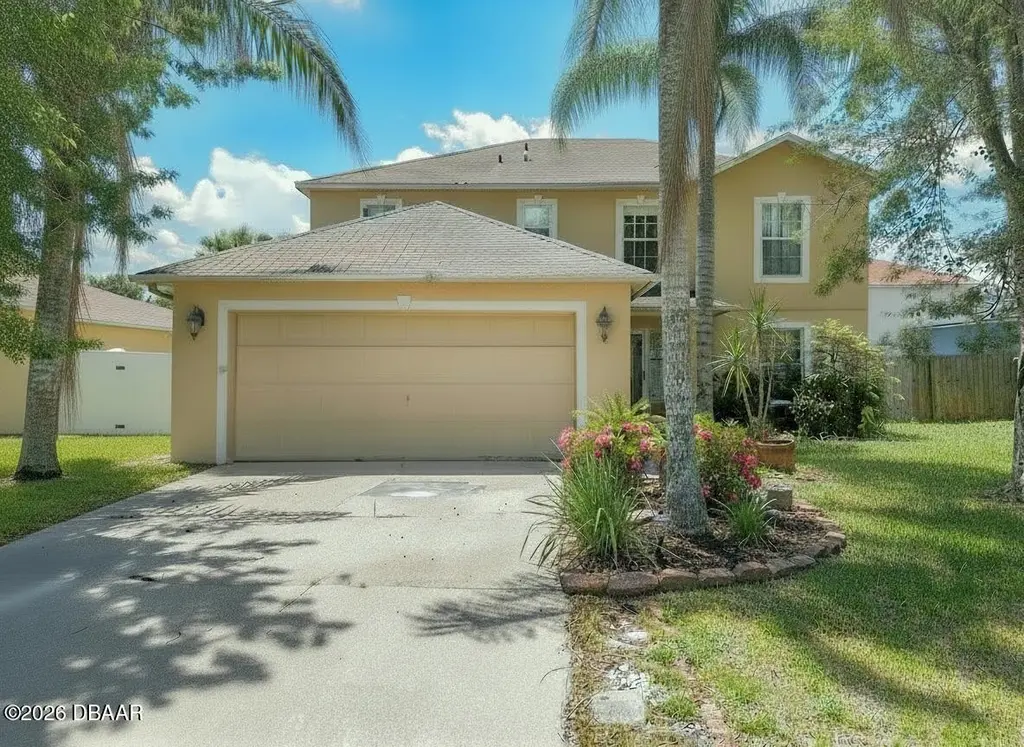
7346 High Bluff Rd N · Jacksonville, FL
Flood risk 1/10 · Minimal
- FEMA flood zone
- X (unshaded)
- Chance of flooding over 30 yrs
- 0.0%
- Est. flood insurance / yr
- $507 – $1,088
Fire risk 5/10 · Moderate
- Est. fire insurance / yr
- $947 – $1,759
Heat risk 9/10 · Severe
- Hot days now (above 107°F)
- 7 days/yr
- Hot days in 30 yrs
- 21 days/yr
Wind risk 10/10 · Severe
- Chance of severe wind over 30 yrs
- 99.0%
Air-quality risk 3/10 · Minor
- Unhealthy air days now
- 3 days/yr
- Unhealthy air days in 30 yrs
- 4 days/yr
Risk factors via First Street. Map © Google.
Why this score? — see what drove the D+ grade
The composite is a weighted blend of 9 inputs, each scored 0–100. Each bar is that input's sub-score; the figure is the points it added to the 100-point composite (weight × sub-score).
- ARV discount +15.0/15.0
- Cash flow +12.5/30.0
- Livability +4.2/5.0
- Schools +3.9/10.0
- DSCR +3.7/10.0
- Rent growth +3.1/5.0
- 1% rule +2.7/10.0
- Condition / age +2.5/5.0
- Appreciation +0.0/10.0
$269,900
🖨 Deal sheet 📄 Offer letter ✓ Due diligence
Listing remarks MLS
Move in Ready Home is very close to NAS JAX, shopping and schools. Nicely maintained and spacious 4/2 home. Lots of upgrades and improvements to interior and lawn. Summer kitchen in private backyard. Nice screen room and pool.Kitchen has 2 pantries and prep island. ********* NOT A SHORT SALE************
Key facts
- Close to schools
- Close to nas jax
- Close to shopping
Tags
Property features AI
Exterior
- Parking: 2-car garage
- Utilities: Public water; Electricity connected
- Home design: Single-family residential property
- Exterior features: Not in a subdivision; Directions: head north on Rampart Rd then left on Grey Fox Ln then turn right on high bluff Rd
Interior
- Kitchen: Convection oven
- Bathrooms: 2 full bathrooms; 1 half bathroom
- Heating & cooling: Central heating; Central air conditioning
- Interior features: Convection oven
Neighborhood map
What this means for you Summary
Snapshot
- This is a 4-bed/3.0-bath single-family listed at $270k.
Deal economics
- At list price, monthly cash flow is $-39 ($-474/yr) — negative.
- To cash-flow at today's rent, offer at most $263k (2.6% below list).
- To meet the 1% rule (rent ≥ 1% of price), the offer needs to be $207k (23.3% below list).
- Recommended offer: $207k (23.3% below list) — sets the bar for 1% rule.
- Cap rate 6.1% vs local median 4.0% in Jacksonville — top-decile yield for the area; either an underpriced asset or a hidden risk that comps aren't pricing in. Stress-test before assuming the spread holds.
Location & tenants
- Location reads 83/100 on livability (#50 in FL, #911 nationally) — a professional / high-income tenant draw. Strengths: amenities A+, commute A+, housing A+.
- Duval (urban): math 46% / reading 45% proficiency, ranked #48 of 73 in FL (top 66%) — families likely to look elsewhere, expect single-tenant / working-renter base with shorter leases.
- Market conditions: Rents rising (+2.2%/yr); 349 active listings in the ZIP; 25 comparable units currently listed for rent nearby; rentals at typical pace (median 17d on market — plan ~3-4 weeks tenant-placement turnaround); 6,503 units permitted in Duval County in 2024 (1,131 in 5+ unit buildings).
- This rent runs 40% of the median local income ($62k/yr) — at the standard rent-burdened threshold; future hikes will face affordability resistance.
Forward outlook
- Local home prices are declining (-3.0%/yr); year-one equity from $2k of loan paydown is wiped out by about $8k of value loss. Plan a longer hold.
- Duval County population projected at +19% by 2050 — long-run rental-demand tailwind backs the buy-and-hold thesis.
Negotiation context
- Only 10 days on market — expect competitive offers; lowballing is unlikely to land.
- 4 sale attempts since 24y ago with the ask held roughly flat each time — persistent listings suggest the price (not the market) is what's stuck; bring a comps-based counter.
- Current owner paid $120k; list at $270k implies a 125% gain — meaningful room to come down on a strong offer.
Risks & watch-outs
- Climate carrying-cost: severe wind risk, 99% chance of damaging wind over 30y; moderate wildfire risk; extreme-heat days projected 7→21/yr by 2055 (HVAC capex compounding) — expect insurance premiums to compound above CPI over the hold.
Questions for the listing agent
- What do current leases actually rent for vs. the listed asking? Can we see a recent rent roll and the last 12 months of T-12 income?
- Is there a deadline driving the sale (1031 exchange, divorce, estate, relocation)? That informs how much negotiation room exists.
- Schools are B-rated — typically a magnet for longer-tenancy family renters. What's the average tenant stay here, and is there a school-zone premium baked into asking?
- The area grade is low — what's the realistic commute time and amenity access for the typical tenant pool here? Any planned neighborhood developments (good or bad) we should know about?
- What's the average days-on-market for RENTAL listings here right now (not sales)? A rising rental-DOM trend means longer vacancies and softer asking-rent achievability than the comps imply.
- What's the recent tenant-quality profile in this submarket — average credit score on applications, eviction rate, late-payment / NSF rate, and stable-employment percentage? A property-management company in the area should have these aggregated.
- How much new for-sale + rental construction is in the pipeline within 1–3 miles? Heavy new supply typically softens prices + rents 12–24 months out; constrained supply supports both.
Investment metrics
- 1% rule
- 0.77% ✗
- Cap rate
- 6.12%
- Cash-on-cash
- -0.63%
- DSCR
- 0.97
- GRM
- 10.9
CMA / ARV
- ARV (on-the-fly)
- $358,869
- Comps found
- 12
Show comp detail 12 sales within ~0.75 mi
| Address | Dist | Beds/Ba | Sqft | Sold | Price | $/sf | Match |
|---|---|---|---|---|---|---|---|
| 7346 High Bluff Rd N | 0.00mi | 4/2.5 | 2,229 (0%) | 0mo | $250,000 | $112 | 98 |
| 7147 High Bluff Rd | 0.11mi | 4/2.5 | 2,215 (-1%) | 6mo | $289,900 | $131 | 87 |
| 7356 Overland Park Blvd W | 0.34mi | 4/2.5 | 2,149 (-4%) | 1mo | $268,000 | $125 | 75 |
| 7364 Edenfield Park Rd | 0.06mi | 3/2.0 (-1) | 2,059 (-8%) | 3mo | $264,900 | $129 | 73 |
| 7374 Wood Duck Rd | 0.19mi | 4/2.5 | 2,250 (+1%) | 18mo | $310,000 | $138 | 72 |
| 7287 Mahogany Run Dr | 0.30mi | 4/3.0 | 2,170 (-3%) | 19mo | $383,990 | $177 | 66 |
| 7207 Red Timber Rd | 0.28mi | 4/3.0 | 2,170 (-3%) | 22mo | $383,171 | $177 | 64 |
| 7215 Mahogany Run Dr | 0.34mi | 4/3.0 | 2,140 (-4%) | 21mo | $366,990 | $171 | 60 |
| 7197 Steventon Way | 0.53mi | 3/2.0 (-1) | 2,147 (-4%) | 5mo | $345,000 | $161 | 56 |
| 7836 Townsend Rd | 0.63mi | 4/3.0 | 2,180 (-2%) | 17mo | $472,000 | $217 | 53 |
| 6907 Playpark Trl | 0.63mi | 4/3.5 | 1,928 (-14%) | 7mo | $216,000 | $112 | 40 |
| 7250 Steventon Way | 0.62mi | 3/2.0 (-1) | 1,901 (-15%) | 10mo | $337,500 | $178 | 29 |
Match score weights: distance 35% · size 25% · config 20% · recency 20%. Top-matched comps best support the ARV.
Projected returns pro-forma
-3.0% appreciation · 2.25% rent growth · sell at horizon
- IRR
- -18.1%
- Equity multiple
- 0.37×
- Total profit
- $-47,885
- Equity at exit
- $40,243
- IRR
- -11.8%
- Equity multiple
- 0.32×
- Total profit
- $-51,549
- Equity at exit
- $23,336
Cash invested: $75,572 (down + closing). Projections, not guarantees.
Landlord ↔ Tenant lean methodology
- Overall (STATE)
- 87 Strongly Landlord-Friendly
- State Florida
- 87 Strongly Landlord-Friendly · R+3
- County
- — inherits STATE
- City
- — inherits STATE
ZIP-level market 32244
- Home prices YoY
- -17.8%
- Rents YoY
- 2.2%
- Active inventory
- 349
- Price-to-rent
- 10.9×
Monthly cashflow live
- Estimated rent
- $2,070 high interval (Pro) →
- Mortgage (P&I)
- −$1,415
- Tax from tax record
- −$147 /mo · $1,758/yr
- Insurance
- −$112
- HOA
- −$0
- Vacancy / Maint / Mgmt
- −$435
- Net cashflow
- $-39
Break-even live
UW: 25.0% down · 7.5% · 30yr · 1.5% tax · 5.0% vac · 8.0% maint · 8.0% mgmt
Financing live
Cash to close
- Down payment
- $67,475
- Closing costs
- $8,097
- Reserves months
- —
- Total cash needed
- —
Loan-product check · same deal, 3 products live
Conventional
25% down · 7.5% · 30yr
- Down + closing
- —
- Monthly P&I
- —
- Monthly cashflow
- —
- DSCR
- —
- Eligible?
- —
Personal DTI + credit; lowest rate.
DSCR
20% down · 8.5% · 30yr
- Down + closing
- —
- Monthly P&I
- —
- Monthly cashflow
- —
- DSCR
- —
- Eligible?
- —
No personal income docs; deal must DSCR.
Hard money
10% down · 12.0% · 12mo
- Down + closing
- —
- Monthly P&I
- —
- Monthly cashflow
- —
- DSCR
- —
- Eligible?
- —
Short-term bridge; refi at stabilization.
Rent comps 25 comps
| Address | Beds | Baths | Sqft | Rent | $/sqft | DOM | Units | Dist |
|---|---|---|---|---|---|---|---|---|
| 7379 Edenfield Park Rd Jacksonville, FL | 3.0 | 2.5 | 2215 | $2,000 | $0.90 | 21d | 1 | 0.09mi |
| 7390 Overland Park Blvd Jacksonville, FL | 3.0 | 2.0 | 1648 | $1,970 | $1.20 | 3d | 1 | 0.32mi |
| 6850 Rhapsody Rd Jacksonville, FL | 3.0 | 2.5 | 1970 | $1,995 | $1.01 | 23d | 1 | 0.42mi |
| 7242 Rampart Ridge Cir E Jacksonville, FL | 4.0 | 2.5 | 2476 | $2,265 | $0.91 | 7d | 1 | 0.45mi |
| 7559 Ginger Tea Trl W Jacksonville, FL | 3.0 | 2.0 | 1437 | $1,695 | $1.18 | 17d | 1 | 0.64mi |
| 7634 Fanning Dr Jacksonville, FL | 4.0 | 2.0 | 1658 | $1,850 | $1.12 | 23d | 1 | 0.70mi |
| 7377 Benes Trl Jacksonville, FL | 4.0 | 2.0 | 1861 | $2,250 | $1.21 | 23d | 1 | 0.86mi |
| 7811 Invermere Blvd N Jacksonville, FL | 4.0 | 2.0 | 1831 | $1,990 | $1.09 | 20d | 1 | 0.91mi |
| 6649 Georgia Jack Dr Jacksonville, FL | 4.0 | 2.0 | 1664 | $2,100 | $1.26 | 23d | 1 | 0.93mi |
| 6478 Silk Leaf Ln Jacksonville, FL | 3.0 | 2.0 | 1682 | $1,985 | $1.18 | 23d | 1 | 1.05mi |
| 6648 Gentle Oaks Dr E Jacksonville, FL | 3.0 | 2.0 | 1412 | $1,690 | $1.20 | 1d | 1 | 1.07mi |
| 6869 Southern Oaks Dr W Jacksonville, FL | 3.0 | 2.0 | 1660 | $1,861 | $1.12 | 13d | 1 | 1.11mi |
| 6931 Cane Grass Ln E Jacksonville, FL | 3.0 | 2.0 | 2100 | $2,300 | $1.10 | 4d | 1 | 1.15mi |
| 7472 Mishkie Dr Jacksonville, FL | 3.0 | 2.0 | 1884 | $1,965 | $1.04 | 2d | 1 | 1.16mi |
| 6241 Cranberry Ln E Jacksonville, FL | 4.0 | 2.0 | 2112 | $1,350 | $0.64 | 23d | 1 | 1.22mi |
| 6553 Big Stone Dr Jacksonville, FL | 4.0 | 2.0 | 1900 | $2,300 | $1.21 | 23d | 1 | 1.23mi |
| 7952 118th St Jacksonville, FL | 4.0 | 2.5 | 1407 | $1,895 | $1.35 | 10d | 1 | 1.25mi |
| 7952 118th St Jacksonville, FL | 4.0 | 2.5 | 1407 | $1,895 | $1.35 | 7d | 1 | 1.25mi |
| 8134 Rocky Creek Dr Jacksonville, FL | 3.0 | 2.0 | 1689 | $1,250 | $0.74 | 14d | 1 | 1.29mi |
| 7940 Collins Bay Ct Jacksonville, FL | 3.0 | 2.0 | 1554 | $2,025 | $1.30 | 20d | 1 | 1.31mi |
| 8341 Fire Fly Ln Jacksonville, FL | 3.0 | 2.5 | 1676 | $1,695 | $1.01 | 3d | 1 | 1.43mi |
| 8341 Fire Fly Ln Jacksonville, FL | 3.0 | 2.5 | 1676 | $1,695 | $1.01 | 23d | 1 | 1.43mi |
| 8236 Hot Springs Dr N Jacksonville, FL | 3.0 | 2.0 | 1734 | $1,865 | $1.08 | 7d | 1 | 1.43mi |
| 7178 Cypress Cove Rd #25 Jacksonville, FL | 3.0 | 2.0 | 1875 | $2,000 | $1.07 | 23d | 1 | 1.46mi |
| 6371 Collins Rd Jacksonville, FL | 3.0 | 1.0–2.0 | 1010 | $1,981 | $1.96 | 1d | 40 | 1.46mi |
Listing history 9 events
-
2026-06-10statusdays on market $269,900 Pending 10 DOM
-
2026-06-08days on market $269,900 Active 9 DOM
-
2026-06-07days on market $269,900 Active 8 DOM
-
2026-06-05days on market $269,900 Active 5 DOM
-
2026-06-03days on market $269,900 Active 4 DOM
-
2026-06-02days on market $269,900 Active 3 DOM
-
2026-06-01days on market $269,900 Active 2 DOM
-
2026-05-31remarks 169-char remark
-
2026-05-31$269,900 Active 1 DOM
ⓘ Source: listings_history table (triggers on properties + properties_extension) + one-shot
backfill from property_details.listing_events for pre-trigger history.
Tax reassessment forecast FL · Resets to sale price
- Current annual tax
- $1,758 · $147/mo
- Projected year-2 tax
- $2,240 · $187/mo
- Expected delta
- +$482/yr (+$40/mo · 27.4%)
ⓘ Screening estimate from a state-policy table — verify with the county assessor before closing.
Climate risk First Street
- Flood 1/10 Low FEMA zone X (unshaded) · 0% chance over 30 yrs
- Wildfire 5/10 Major
- Heat 9/10 Extreme 7 d/yr ≥107°F today · 21 d/yr by 30 yrs out
- Wind 10/10 Extreme 99% chance of damaging wind over 30 yrs
- Air quality 3/10 Moderate 3 unhealthy d/yr today · 4 by 30 yrs out
Nearby sold comps map
Loading sold comps map…
Walkable amenities ~0.75 mi
Loading nearby amenities…
Taxation est. · year 1
- Rental income
- $24,834
- − Mortgage interest
- −$15,119
- − Property taxes
- −$1,758
- − Insurance
- −$1,350
- − Repairs & maintenance
- −$1,987
- − Management
- −$1,987
- − Depreciation
- −$7,852
- Taxable loss
- −$5,217
- Est. tax savings @ 24.0%
- +$1,252
- After-tax cash flow
- $779/yr
For passive investors: Depreciation is non-cash, so a rental often shows a tax loss while cash-flowing — sheltering income. Rental losses are passive: they offset passive income freely, and up to $25,000/yr can offset ordinary (W-2) income if you actively participate and your MAGI is under $100k (phasing out to $0 by $150k); unused losses carry forward. On sale, claimed depreciation is recaptured at up to 25%, and gains may owe capital-gains tax (a 1031 exchange can defer both). Figures are a year-1 estimate at your 24.0% rate — not tax advice; consult a CPA.
Schools (NCES district)
- District
- Duval
- NCES district ID
- 1200480
- Math proficiency
- 46% ▼ -11.00%
- Reading proficiency
- 45% ▼ -4.00%
- Median HH income
- $48,987
- Composite
- 38.97/100
- National rank
- #4076
- State rank
- #48 of 73 in FL
Livability — Jacksonville
- Score
- 83/100
- State rank
- #50
- US rank
- #911
Category grades
Schools grade is shown separately in the Schools card above.
Census & demographics
- Census place
- Jacksonville, FL
- County
- Duval County · 1,015,274 people
- City population
- 979,034
- Metro
- Jacksonville, FL
- Population (ZIP)
- 63,592
- Household income
- $62,204
- Rent vs Own
- Severe rent burden
- 2799.0
Population outlook (Duval County) Hauer SSP2
- Today (2025)
- 1,013,010 people
- By 2030
- 1,059,228 · +4.6%
- By 2040
- 1,141,439 · +12.7%
- By 2050
- 1,205,258 · +19.0%
- By 2075
- 1,324,282 · +30.7%
- By 2100
- 1,319,620 · +30.3%
Race, ethnicity, and origin ACS 2023
- Neighborhood character
- Highly diverse neighborhood (Simpson 0.70)
- Race & ethnicity
- White 39% Black 35% Hispanic / Latino 15% Two or more races 10% Asian 6%
- Hispanic origin (detail)
- Mexican 3% Puerto Rican 6% Cuban 3%
- Common ancestry
- Hispanic 1% Lithuanian 1% Romanian 1%
- Foreign-born
- 12% · Canada, Vietnam, China
- Languages at home
- 83% English-only · Spanish 9% Tagalog/Filipino 3% French/Haitian/Cajun 2%
Political lean MEDSL · Duval
- 2024 margin
- Toss-up / Even · D 48.7% · R 50.1% · Other 1.2%
- 2008→2024 swing
- +0.4pp no change · 2008: -1.9pp · 2024: -1.5pp
- All cycles
- 2024: R+1.5 2020: D+3.8 2016: R+1.5 2012: R+3.6 2008: R+1.9
Not yet ingested
- Civics
- —
Market trends
- HPI YoY
- ▼ -64.22%
- Current HPI
- 296.5375
- Rent YoY
- ▲ 2.25%
- Metro
- Jacksonville, FL
- State GDP YoY
- ▲ 3.28%
- F500 in state
- 36
Industry mix (Fortune 500 HQ in FL)
| Industry | F500 HQs | Revenue |
|---|---|---|
| Industrial Technology | 2 | $29B |
|
||
| Insurance | 2 | $17B |
|
||
| Retail | 1 | $60B |
|
||
| Technology Distribution | 1 | $58B |
|
||
| Homebuilding | 1 | $35B |
|
||
| Technology Manufacturing | 1 | $35B |
|
||
Price history
+57.7% since first listed10 events — show timeline
- 2026-05-30 Listed $269,900 Daytona MLS
- 2012-06-06 Listing Removed — realMLS
- 2012-05-17 Sold (MLS) $120,000 realMLS
- 2012-03-02 Listed $124,900 realMLS
- 2012-02-27 Listing Removed — realMLS
- 2011-12-22 Listed $138,900 realMLS
- 2003-02-26 Sold (MLS) $133,820 realMLS
- 2002-12-18 Listing Removed — realMLS
- 2002-11-06 Listed $133,820 realMLS
- 2001-11-21 Sold (Public Records) $171,200 Public Records
Property tax history
+2.7%/yrLatest (2025): $1,758 · +14.2% YoY. Source: county tax records.
Cash-flow waterfall
monthlySold comps — $/sqft
last 12 mo · ≤1 miLoading sold comps…