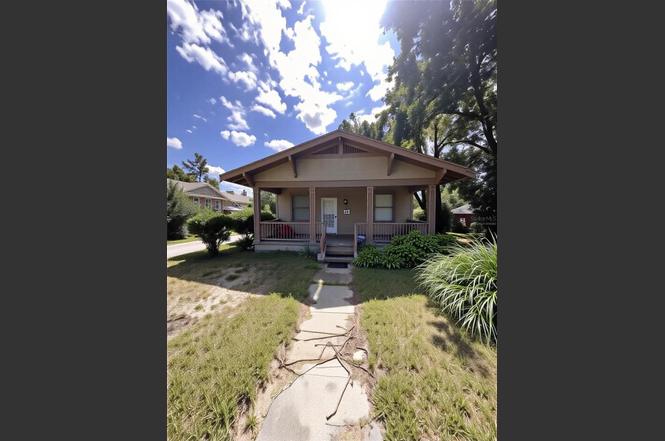
112 W Powhatan Ave · Tampa, FL
Flood risk 1/10 · Minimal
- FEMA flood zone
- X (unshaded)
- Chance of flooding over 30 yrs
- 0.0%
- Est. flood insurance / yr
- $507 – $1,088
Fire risk 1/10 · Minimal
- Est. fire insurance / yr
- $947 – $1,759
Heat risk 10/10 · Severe
- Hot days now (above 108°F)
- 6 days/yr
- Hot days in 30 yrs
- 22 days/yr
Wind risk 9/10 · Severe
- Chance of severe wind over 30 yrs
- 99.0%
Air-quality risk 3/10 · Minor
- Unhealthy air days now
- 3 days/yr
- Unhealthy air days in 30 yrs
- 3 days/yr
Risk factors via First Street. Map © Google.
Why this score? — see what drove the D grade
The composite is a weighted blend of 9 inputs, each scored 0–100. Each bar is that input's sub-score; the figure is the points it added to the 100-point composite (weight × sub-score).
- Cash flow +14.3/30.0
- ARV discount +7.5/15.0
- DSCR +4.4/10.0
- Schools +4.2/10.0
- Livability +4.0/5.0
- 1% rule +2.7/10.0
- Rent growth +2.6/5.0
- Condition / age +2.5/5.0
- Appreciation +0.0/10.0
$299,999
🖨 Deal sheet 📄 Offer letter ✓ Due diligence
Listing remarks
Under contract-accepting backup offers. PROPERTY PENDING COURT APPROVAL. Built in 1922, this 3-bedroom, 1-bath home spans just shy of 1,300 sq. ft. and sits on a large lot with a spacious backyard—offering endless possibilities for outdoor living, expansion, or new construction. The home itself is ready for a complete renovation or rebuild, providing an excellent opportunity for investors or visionaries. Not located within the local historic district, the property allows full flexibility for redevelopment. A rare find with this much space and potential. Whether you’re looking to restore a piece of old Florida charm or build something entirely new, this property is a blank canvas
Key facts
- Spacious backyard
- Complete renovation
- Large lot
Tags
Neighborhood map
What this means for you Summary
Snapshot
- This is a 3-bed/1.0-bath single-family listed at $300k.
Deal economics
- At list price, monthly cash flow is $58 ($692/yr) — positive.
- The deal already cash-flows at list — no discount required.
- To meet the 1% rule (rent ≥ 1% of price), the offer needs to be $230k (23.2% below list).
- Recommended offer: $230k (23.2% below list) — sets the bar for 1% rule.
Location & tenants
- Location reads 79/100 on livability (#142 in FL, #2,135 nationally) — a middle-class / working-renter tenant base. Strengths: commute A+, housing A+, health & safety A+; Watch: schools C-, crime D+.
- Hillsborough (suburban): math 47% / reading 50% proficiency, ranked #41 of 73 in FL (top 56%) — families likely to look elsewhere, expect single-tenant / working-renter base with shorter leases.
- Market conditions: Rents flat; 368 active listings in the ZIP; 40 comparable units currently listed for rent nearby; rentals at typical pace (median 21d on market — plan ~3-4 weeks tenant-placement turnaround); 9,053 units permitted in Hillsborough County in 2024 (4,555 in 5+ unit buildings).
- At $2,303/mo this rent would consume 47% of the median local household income ($59k/yr) (locally 2581% of renters already pay >50% of income on rent) — very limited rent-growth headroom before tenants either downsize or default.
Forward outlook
- Local home prices are declining (-3.0%/yr); year-one equity from $2k of loan paydown is wiped out by about $9k of value loss. Plan a longer hold.
- Hillsborough County population projected at +37% by 2050 — long-run rental-demand tailwind backs the buy-and-hold thesis.
Negotiation context
- It's been on market 51 days — a 3% lower offer ($291k) is reasonable based on typical stale-listing flexibility.
- 2 sale attempts with the ask held roughly flat each time — persistent listings suggest the price (not the market) is what's stuck; bring a comps-based counter.
- Current owner paid $24k; list at $300k implies a 1150% gain — meaningful room to come down on a strong offer.
Risks & watch-outs
- Watch-outs: built in 1922 — expect roof / HVAC / electrical / plumbing capex.
- Climate carrying-cost: severe wind risk, 99% chance of damaging wind over 30y; extreme-heat days projected 6→22/yr by 2055 (HVAC capex compounding) — expect insurance premiums to compound above CPI over the hold.
Questions for the listing agent
- It's been on market 51 days. Have you received any prior offers? Is the seller open to a 23% concession, seller financing, or rate buy-down credit?
- Built in 1922 — when were the roof, HVAC, electrical panel, plumbing, and water heater last replaced?
- Is there a deadline driving the sale (1031 exchange, divorce, estate, relocation)? That informs how much negotiation room exists.
- Crime grade is D in this area — have there been break-ins, vandalism, or insurance claims at this property in the last 3 years? What carrier currently insures it and at what premium?
- The area grade is low — what's the realistic commute time and amenity access for the typical tenant pool here? Any planned neighborhood developments (good or bad) we should know about?
- What's the average days-on-market for RENTAL listings here right now (not sales)? A rising rental-DOM trend means longer vacancies and softer asking-rent achievability than the comps imply.
- What's the recent tenant-quality profile in this submarket — average credit score on applications, eviction rate, late-payment / NSF rate, and stable-employment percentage? A property-management company in the area should have these aggregated.
- How much new for-sale + rental construction is in the pipeline within 1–3 miles? Heavy new supply typically softens prices + rents 12–24 months out; constrained supply supports both.
Investment metrics
- 1% rule
- 0.77% ✗
- Cap rate
- 6.52%
- Cash-on-cash
- 0.82%
- DSCR
- 1.04
- GRM
- 10.9
CMA / ARV
No comps found within radius.
Projected returns pro-forma
-3.0% appreciation · 0.52% rent growth · sell at horizon
- IRR
- -17.5%
- Equity multiple
- 0.40×
- Total profit
- $-50,707
- Equity at exit
- $44,731
- IRR
- -14.2%
- Equity multiple
- 0.26×
- Total profit
- $-61,962
- Equity at exit
- $25,938
Cash invested: $84,000 (down + closing). Projections, not guarantees.
Landlord ↔ Tenant lean methodology
- Overall (STATE)
- 87 Strongly Landlord-Friendly
- State Florida
- 87 Strongly Landlord-Friendly · R+3
- County
- — inherits STATE
- City
- — inherits STATE
ZIP-level market 33604
- Home prices YoY
- -31.3%
- Rents YoY
- 0.5%
- Active inventory
- 368
- Price-to-rent
- 10.9×
Monthly cashflow live
- Estimated rent
- $2,303 high interval (Pro) →
- Mortgage (P&I)
- −$1,573
- Tax from tax record
- −$64 /mo · $763/yr
- Insurance
- −$125
- HOA
- −$0
- Vacancy / Maint / Mgmt
- −$484
- Net cashflow
- $58
Break-even live
UW: 25.0% down · 7.5% · 30yr · 1.5% tax · 5.0% vac · 8.0% maint · 8.0% mgmt
Financing live
Cash to close
- Down payment
- $75,000
- Closing costs
- $9,000
- Reserves months
- —
- Total cash needed
- —
Loan-product check · same deal, 3 products live
Conventional
25% down · 7.5% · 30yr
- Down + closing
- —
- Monthly P&I
- —
- Monthly cashflow
- —
- DSCR
- —
- Eligible?
- —
Personal DTI + credit; lowest rate.
DSCR
20% down · 8.5% · 30yr
- Down + closing
- —
- Monthly P&I
- —
- Monthly cashflow
- —
- DSCR
- —
- Eligible?
- —
No personal income docs; deal must DSCR.
Hard money
10% down · 12.0% · 12mo
- Down + closing
- —
- Monthly P&I
- —
- Monthly cashflow
- —
- DSCR
- —
- Eligible?
- —
Short-term bridge; refi at stabilization.
Rent comps 40 comps
| Address | Beds | Baths | Sqft | Rent | $/sqft | DOM | Units | Dist |
|---|---|---|---|---|---|---|---|---|
| 5706 N Suwanee Ave Unit 1271940P Tampa, FL | 2.0 | 1.0 | 914 | $2,747 | $3.01 | 2d | 1 | 0.15mi |
| 503 W Idlewild Ave Tampa, FL | 2.0 | 2.0 | 968 | $2,200 | $2.27 | 17d | 1 | 0.31mi |
| 303 E Paris St Tampa, FL | 2.0 | 2.0 | 1442 | $2,200 | $1.53 | 24d | 1 | 0.33mi |
| 203 W Crest Ave Tampa, FL | 2.0 | 1.0 | 900 | $2,100 | $2.33 | 24d | 1 | 0.34mi |
| 203 W Haya St Tampa, FL | 2.0 | 1.0 | 990 | $1,950 | $1.97 | 5d | 1 | 0.40mi |
| 5305 N Boulevard Tampa, FL | 1.0–2.0 | 1.0–2.5 | 970 | $2,100 | $2.16 | 3d | 4 | 0.41mi |
| 5205 N Boulevard Tampa, FL | 1.0–3.0 | 1.0–2.0 | 1175 | $2,241 | $1.91 | 3d | 17 | 0.47mi |
| 325 W Jean St Tampa, FL | 3.0 | 2.0 | 1200 | $2,500 | $2.08 | 24d | 1 | 0.52mi |
| 310 E Lambright St Unit 310-1 Tampa, FL | 2.0 | 1.0 | 800 | $1,650 | $2.06 | 24d | 1 | 0.60mi |
| 310 E Lambright St Unit 310-3 Tampa, FL | 2.0 | 1.0 | 800 | $1,650 | $2.06 | 12d | 1 | 0.60mi |
| 816 E Frierson Ave Tampa, FL | 3.0 | 1.0 | 864 | $2,250 | $2.60 | 24d | 1 | 0.64mi |
| 309 W Osborne Ave Tampa, FL | 3.0 | 1.5 | 1462 | $3,300 | $2.26 | 24d | 1 | 0.70mi |
| 113 W Elm St Tampa, FL | 3.0 | 2.0 | 1473 | $3,400 | $2.31 | 18d | 1 | 0.77mi |
| 118 W Sligh Ave Unit Main Tampa, FL | 2.0 | 1.0 | 865 | $2,750 | $3.18 | 16d | 1 | 0.79mi |
| 809 W Hiawatha St Tampa, FL | 3.0 | 2.0 | 1345 | $2,600 | $1.93 | 20d | 1 | 0.80mi |
| 5611 N McKay Ave Tampa, FL | 2.0 | 1.0 | 912 | $1,795 | $1.97 | 22d | 1 | 0.82mi |
| 5611 N McKay Ave Tampa, FL | 2.0 | 1.0 | 912 | $1,795 | $1.97 | 24d | 1 | 0.82mi |
| 4513 N Florida Ave Tampa, FL | 2.0 | 1.0 | 887 | $2,299 | $2.59 | 2d | 6 | 0.85mi |
| 6905 N Duncan Ave Unit A Tampa, FL | 2.0 | 2.0 | 1214 | $1,850 | $1.52 | 24d | 1 | 0.85mi |
| 6712 N Harer St Tampa, FL | 2.0 | 1.0 | 720 | $1,525 | $2.12 | 24d | 1 | 0.86mi |
| 6712 N Harer St Unit 2 Tampa, FL | 2.0 | 1.0 | 720 | $1,425 | $1.98 | 5d | 1 | 0.86mi |
| 1212 E Mohawk Ave Tampa, FL | 3.0 | 1.0 | 1266 | $1,995 | $1.58 | 20d | 1 | 0.88mi |
| 6416 N Orleans Ave Tampa, FL | 2.0 | 1.0 | 1008 | $2,300 | $2.28 | 15d | 1 | 0.89mi |
| 203 W Emma St Tampa, FL | 3.0 | 2.0 | 1279 | $2,700 | $2.11 | 24d | 1 | 0.89mi |
| 203 W Emma St Tampa, FL | 3.0 | 2.0 | 1279 | $2,500 | $1.95 | 11d | 1 | 0.89mi |
| 4501 N Highland Ave Unit Main House Tampa, FL | 4.0 | 2.0 | 1500 | $3,300 | $2.20 | 16d | 1 | 0.89mi |
| 1215 E Mohawk Ave Tampa, FL | 2.0 | 1.0 | 840 | $1,800 | $2.14 | 11d | 1 | 0.89mi |
| 7005 N Duncan Ave Unit A Tampa, FL | 2.0 | 1.0 | 814 | $2,000 | $2.46 | 20d | 1 | 0.90mi |
| 102 W Emma St Unit 1271942P Tampa, FL | 2.0 | 2.0 | 775 | $3,310 | $4.27 | 2d | 1 | 0.92mi |
| 7201 N Highland Ave Tampa, FL | 2.0 | 1.0 | 1400 | $2,350 | $1.68 | 24d | 1 | 0.96mi |
| 411 W Flora St Tampa, FL | 2.0 | 1.0 | 1400 | $2,750 | $1.96 | 22d | 1 | 0.97mi |
| 902 E Curtis St Unit 1 Tampa, FL | 2.0 | 2.0 | 1325 | $3,200 | $2.42 | 18d | 1 | 0.98mi |
| 4412 N Clearfield Ave Tampa, FL | 3.0 | 2.0 | 1336 | $2,250 | $1.68 | 24d | 1 | 0.98mi |
| 1202 E Caracas St Tampa, FL | 3.0 | 3.0 | 1224 | $2,595 | $2.12 | 24d | 1 | 0.99mi |
| 706 E Flora St Tampa, FL | 3.0 | 1.0 | 832 | $2,225 | $2.67 | 24d | 1 | 1.05mi |
| 900 E Sligh Ave Tampa, FL | 2.0 | 1.0–2.0 | 888 | $2,630 | $2.96 | 2d | 33 | 1.05mi |
| 7218 N Highland Ave Tampa, FL | 3.0 | 2.0 | 1448 | $2,950 | $2.04 | 5d | 1 | 1.05mi |
| 406 W Alva St Tampa, FL | 2.0 | 1.0 | 936 | $2,500 | $2.67 | 24d | 1 | 1.07mi |
| 806 E Chelsea St Unit 4 Tampa, FL | 2.0 | 1.0 | 850 | $1,790 | $2.11 | 24d | 1 | 1.07mi |
| 314 W Alva St Tampa, FL | 3.0 | 2.0 | 1170 | $3,000 | $2.56 | 24d | 1 | 1.07mi |
Listing history 6 events
-
2026-02-04status Pending
-
2026-01-19status Active
-
2025-11-26status Pending
-
2025-10-22$299,999 Active
-
1978-03-01soldstatus $24,000
-
1977-05-01soldstatus $24,000
ⓘ Source: listings_history table (triggers on properties + properties_extension) + one-shot
backfill from property_details.listing_events for pre-trigger history.
Tax reassessment forecast FL · Resets to sale price
- Current annual tax
- $763 · $64/mo
- Projected year-2 tax
- $2,490 · $207/mo
- Expected delta
- +$1,727/yr (+$144/mo · 226.5%)
ⓘ Screening estimate from a state-policy table — verify with the county assessor before closing.
Climate risk First Street
- Flood 1/10 Low FEMA zone X (unshaded) · 0% chance over 30 yrs
- Wildfire 1/10 Low
- Heat 10/10 Extreme 6 d/yr ≥108°F today · 22 d/yr by 30 yrs out
- Wind 9/10 Extreme 99% chance of damaging wind over 30 yrs
- Air quality 3/10 Moderate 3 unhealthy d/yr today · 3 by 30 yrs out
Nearby sold comps map
Loading sold comps map…
Walkable amenities ~0.75 mi
Loading nearby amenities…
Taxation est. · year 1
- Rental income
- $27,637
- − Mortgage interest
- −$16,805
- − Property taxes
- −$763
- − Insurance
- −$1,500
- − Repairs & maintenance
- −$2,211
- − Management
- −$2,211
- − Depreciation
- −$8,727
- Taxable loss
- −$4,580
- Est. tax savings @ 24.0%
- +$1,099
- After-tax cash flow
- $1,791/yr
For passive investors: Depreciation is non-cash, so a rental often shows a tax loss while cash-flowing — sheltering income. Rental losses are passive: they offset passive income freely, and up to $25,000/yr can offset ordinary (W-2) income if you actively participate and your MAGI is under $100k (phasing out to $0 by $150k); unused losses carry forward. On sale, claimed depreciation is recaptured at up to 25%, and gains may owe capital-gains tax (a 1031 exchange can defer both). Figures are a year-1 estimate at your 24.0% rate — not tax advice; consult a CPA.
Schools (NCES district)
- District
- Hillsborough
- NCES district ID
- 1200870
- Math proficiency
- 47% ▼ -8.00%
- Reading proficiency
- 50% ▼ -4.00%
- Median HH income
- $50,622
- Composite
- 41.6/100
- National rank
- #3435
- State rank
- #41 of 73 in FL
Livability — Tampa
- Score
- 79/100
- State rank
- #142
- US rank
- #2135
Category grades
Schools grade is shown separately in the Schools card above.
Census & demographics
- Census place
- Tampa, FL
- County
- Hillsborough County · 1,540,968 people
- City population
- 523,346
- Metro
- Tampa-St. Petersburg-Clearwater, FL
- Population (ZIP)
- 40,055
- Household income
- $58,766
- Rent vs Own
- Severe rent burden
- 2581.0
Population outlook (Hillsborough County) Hauer SSP2
- Today (2025)
- 1,607,022 people
- By 2030
- 1,733,968 · +7.9%
- By 2040
- 1,979,565 · +23.2%
- By 2050
- 2,203,427 · +37.1%
- By 2075
- 2,667,893 · +66.0%
- By 2100
- 2,891,558 · +79.9%
Race, ethnicity, and origin ACS 2023
- Neighborhood character
- Diverse neighborhood (Simpson 0.69)
- Race & ethnicity
- Hispanic / Latino 38% White 35% Two or more races 22% Black 21% Asian 2%
- Hispanic origin (detail)
- Mexican 3% Puerto Rican 11% Cuban 13% Dominican 2%
- Common ancestry
- Romanian 3% Lithuanian 2% Slovak 1%
- Foreign-born
- 18% · Canada, Vietnam, Jamaica
- Languages at home
- 66% English-only · Spanish 30% Vietnamese 1% French/Haitian/Cajun 1%
Political lean MEDSL · Hillsborough
- 2024 margin
- Toss-up / Even · D 47.8% · R 50.9% · Other 1.3%
- 2008→2024 swing
- -10.2pp toward R · 2008: 7.1pp · 2024: -3.1pp
- All cycles
- 2024: R+3.1 2020: D+6.9 2016: D+6.8 2012: D+6.7 2008: D+7.1
Not yet ingested
- Civics
- —
Market trends
- HPI YoY
- ▼ -200.24%
- Current HPI
- 439.7084
- Rent YoY
- ▲ 0.52%
- Metro
- Tampa-St. Petersburg-Clearwater, FL
- State GDP YoY
- ▲ 3.28%
- F500 in state
- 36
Industry mix (Fortune 500 HQ in FL)
| Industry | F500 HQs | Revenue |
|---|---|---|
| Industrial Technology | 2 | $29B |
|
||
| Insurance | 2 | $17B |
|
||
| Retail | 1 | $60B |
|
||
| Technology Distribution | 1 | $58B |
|
||
| Homebuilding | 1 | $35B |
|
||
| Technology Manufacturing | 1 | $35B |
|
||
Price history
+1150.0% since first listed6 events — show timeline
- 2026-02-04 Pending — Stellar MLS as Distributed by MLS Grid
- 2026-01-19 Relisted — Stellar MLS as Distributed by MLS Grid
- 2025-11-26 Pending — Stellar MLS as Distributed by MLS Grid
- 2025-10-22 Listed $299,999 Stellar MLS as Distributed by MLS Grid
- 1978-03-01 Sold (Public Records) $24,000 Public Records
- 1977-05-01 Sold (Public Records) $24,000 Public Records
Property tax history
+2.1%/yrLatest (2025): $763 · +6.1% YoY. Source: county tax records.
Cash-flow waterfall
monthlySold comps — $/sqft
last 12 mo · ≤1 miLoading sold comps…