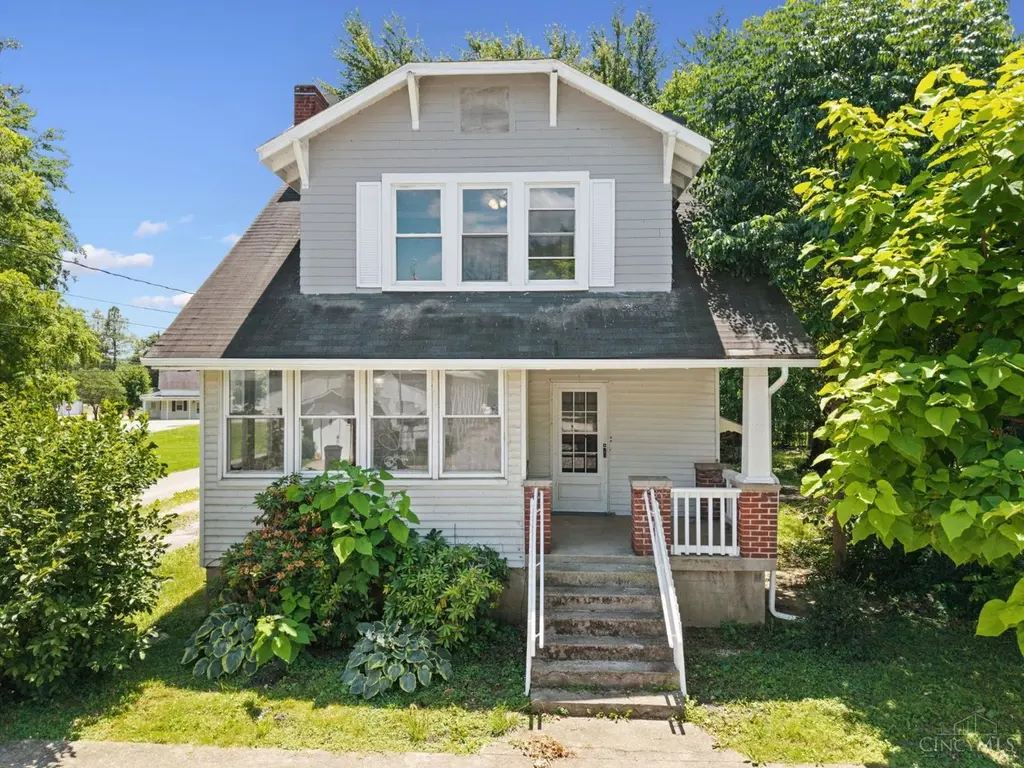
107 College Ave · Sardinia, OH
Flood risk 1/10 · Minimal
- FEMA flood zone
- X (unshaded)
- Chance of flooding over 30 yrs
- 0.0%
- Est. flood insurance / yr
- $473 – $860
Fire risk 3/10 · Minor
- Est. fire insurance / yr
- $713 – $1,323
Heat risk 4/10 · Minor
- Hot days now (above 100°F)
- 7 days/yr
- Hot days in 30 yrs
- 19 days/yr
Wind risk 2/10 · Minimal
- Chance of severe wind over 30 yrs
- 1.0%
Air-quality risk 2/10 · Minimal
- Unhealthy air days now
- 1 days/yr
- Unhealthy air days in 30 yrs
- 1 days/yr
Risk factors via First Street. Map © Google.
Why this score? — see what drove the C grade
The composite is a weighted blend of 9 inputs, each scored 0–100. Each bar is that input's sub-score; the figure is the points it added to the 100-point composite (weight × sub-score).
- Cash flow +22.7/30.0
- ARV discount +7.5/15.0
- DSCR +7.3/10.0
- 1% rule +5.9/10.0
- Schools +4.8/10.0
- Livability +3.3/5.0
- Rent growth +2.5/5.0
- Condition / age +2.5/5.0
- Appreciation +0.0/10.0
$188,000
🖨 Deal sheet 📄 Offer letter ✓ Due diligence
Listing remarks MLS
Charming older home with spacious interiors awaits your personal touch. Featuring solid wood floors, two sets of glass French doors, and a cozy breakfast nook adjacent to the kitchen. TLC will restore its former charm effortlessly. Opportunity awaits in this character-filled property.
Key facts
- Built 1935
- Listed 12 days
Property features AI
Finance
- HOA & community: No HOA
Exterior
- Utilities: Public water; Public sewer; Electric water heating; Public power (assumed)
- Home design: Cape Cod style; Single family home; Two levels; Block foundation
- Construction: Vinyl and wood siding construction; Block foundation; Shingle roof
- Exterior features: Shingle roof; Vinyl siding and wood siding; Wood window frames; Lot described as less than 0.5 acre
Interior
- Kitchen: Kitchen approximately 15 x 20; Appliances included: Dishwasher, Oven/Range, Refrigerator
- Bedrooms: 3 bedrooms total; Primary bedroom on level 2, approximately 16 x 11; Second bedroom on level 2, approximately 12 x 12; Third bedroom on level 2, approximately 12 x 11
- Bathrooms: 2 full bathrooms; Primary bathroom includes a tub; One full bath on level 2 and one full bath in the basement
- Heating & cooling: Forced air heating; Heat pump; Central air conditioning; Electric water heater
- Interior features: Total of 7 rooms; Full basement
- Laundry & utility: Washer and Dryer included
Neighborhood map
What this means for you Summary
Snapshot
- This is a 3-bed/2.0-bath single-family listed at $188k.
Deal economics
- At list price, monthly cash flow is $324 ($4k/yr) — positive.
- The deal already cash-flows at list — no discount required.
- Meets the 1% rule at list price ($2k rent vs $188k).
Location & tenants
- Location reads 66/100 on livability (#643 in OH) — a middle-class / working-renter tenant base. Strengths: crime A+, cost of living A+, housing A+; Watch: employment C-, amenities F, commute F.
- Eastern Local (rural): math 51% / reading 61% proficiency, ranked #350 of 656 in OH (top 53%) — acceptable for families but not a draw, mixed tenant base, ~2y average lease.
- Market conditions: 85 active listings in the ZIP; 147 units permitted in Brown County in 2024 (0 in 5+ unit buildings).
- This rent runs 39% of the median local income ($64k/yr) — at the standard rent-burdened threshold; future hikes will face affordability resistance.
Forward outlook
- Local home prices are declining (-3.0%/yr); year-one equity from $1k of loan paydown is wiped out by about $6k of value loss. Plan a longer hold.
- Brown County population projected at -26% by 2050 — secular population decline; favor cash flow + early exit over multi-decade hold.
Negotiation context
- Only 12 days on market — expect competitive offers; lowballing is unlikely to land.
- 3 sale attempts since 16y ago with the ask held roughly flat each time — persistent listings suggest the price (not the market) is what's stuck; bring a comps-based counter.
- Current owner paid $115k; list at $188k implies a 63% gain — meaningful room to come down on a strong offer.
Risks & watch-outs
- Watch-outs: built in 1935 — expect roof / HVAC / electrical / plumbing capex.
Questions for the listing agent
- Built in 1935 — when were the roof, HVAC, electrical panel, plumbing, and water heater last replaced?
- Is there a deadline driving the sale (1031 exchange, divorce, estate, relocation)? That informs how much negotiation room exists.
- What's the average days-on-market for RENTAL listings here right now (not sales)? A rising rental-DOM trend means longer vacancies and softer asking-rent achievability than the comps imply.
- What's the recent tenant-quality profile in this submarket — average credit score on applications, eviction rate, late-payment / NSF rate, and stable-employment percentage? A property-management company in the area should have these aggregated.
- How much new for-sale + rental construction is in the pipeline within 1–3 miles? Heavy new supply typically softens prices + rents 12–24 months out; constrained supply supports both.
Investment metrics
- 1% rule
- 1.09% ✓
- Cap rate
- 8.36%
- Cash-on-cash
- 7.39%
- DSCR
- 1.33
- GRM
- 7.6
CMA / ARV
No comps found within radius.
Projected returns pro-forma
-3.0% appreciation · 3.0% rent growth · sell at horizon
- IRR
- -5.0%
- Equity multiple
- 0.81×
- Total profit
- $-9,781
- Equity at exit
- $28,031
- IRR
- 4.7%
- Equity multiple
- 1.35×
- Total profit
- $18,203
- Equity at exit
- $16,255
Cash invested: $52,640 (down + closing). Projections, not guarantees.
Landlord ↔ Tenant lean methodology
- Overall (STATE)
- 73 Landlord-Friendly
- State Ohio
- 73 Landlord-Friendly · R+6
- County
- — inherits STATE
- City
- — inherits STATE
ZIP-level market 45171
- Home prices YoY
- -10.8%
- Active inventory
- 85
- Price-to-rent
- 7.6×
Monthly cashflow live
- Estimated rent
- $2,055 medium interval (Pro) →
- Mortgage (P&I)
- −$986
- Tax est. 1.5%
- −$235 /mo · $2,820/yr
- Insurance
- −$78
- HOA
- −$0
- Vacancy / Maint / Mgmt
- −$432
- Net cashflow
- $324
Break-even live
UW: 25.0% down · 7.5% · 30yr · 1.5% tax · 5.0% vac · 8.0% maint · 8.0% mgmt
Financing live
Cash to close
- Down payment
- $47,000
- Closing costs
- $5,640
- Reserves months
- —
- Total cash needed
- —
Loan-product check · same deal, 3 products live
Conventional
25% down · 7.5% · 30yr
- Down + closing
- —
- Monthly P&I
- —
- Monthly cashflow
- —
- DSCR
- —
- Eligible?
- —
Personal DTI + credit; lowest rate.
DSCR
20% down · 8.5% · 30yr
- Down + closing
- —
- Monthly P&I
- —
- Monthly cashflow
- —
- DSCR
- —
- Eligible?
- —
No personal income docs; deal must DSCR.
Hard money
10% down · 12.0% · 12mo
- Down + closing
- —
- Monthly P&I
- —
- Monthly cashflow
- —
- DSCR
- —
- Eligible?
- —
Short-term bridge; refi at stabilization.
Listing history 10 events
-
2026-06-18days on market $188,000 Active 12 DOM
-
2026-06-17days on market $188,000 Active 11 DOM
-
2026-06-16days on market $188,000 Active 10 DOM
-
2026-06-15days on market $188,000 Active 9 DOM
-
2026-06-13days on market $188,000 Active 7 DOM
-
2026-06-12days on market $188,000 Active 6 DOM
-
2026-06-09days on market $188,000 Active 3 DOM
-
2026-06-08days on market $188,000 Active 2 DOM
-
2026-06-07remarks 699-char remark
-
2026-06-07$188,000 Active 1 DOM
ⓘ Source: listings_history table (triggers on properties + properties_extension) + one-shot
backfill from property_details.listing_events for pre-trigger history.
Climate risk First Street
- Flood 1/10 Low FEMA zone X (unshaded) · 0% chance over 30 yrs
- Wildfire 3/10 Moderate
- Heat 4/10 Moderate 7 d/yr ≥100°F today · 19 d/yr by 30 yrs out
- Wind 2/10 Low 100% chance of damaging wind over 30 yrs
- Air quality 2/10 Low 1 unhealthy d/yr today · 1 by 30 yrs out
Nearby sold comps map
Loading sold comps map…
Walkable amenities ~0.75 mi
Loading nearby amenities…
Taxation est. · year 1
- Rental income
- $24,661
- − Mortgage interest
- −$10,531
- − Property taxes
- −$2,820
- − Insurance
- −$940
- − Repairs & maintenance
- −$1,973
- − Management
- −$1,973
- − Depreciation
- −$5,469
- Taxable income
- $955
- Est. tax owed @ 24.0%
- −$229
- After-tax cash flow
- $3,662/yr
For passive investors: Depreciation is non-cash, so a rental often shows a tax loss while cash-flowing — sheltering income. Rental losses are passive: they offset passive income freely, and up to $25,000/yr can offset ordinary (W-2) income if you actively participate and your MAGI is under $100k (phasing out to $0 by $150k); unused losses carry forward. On sale, claimed depreciation is recaptured at up to 25%, and gains may owe capital-gains tax (a 1031 exchange can defer both). Figures are a year-1 estimate at your 24.0% rate — not tax advice; consult a CPA.
Schools (NCES district)
- District
- Eastern Local
- NCES district ID
- 3904603
- Math proficiency
- 51% ▼ -9.00%
- Reading proficiency
- 61% ▼ -8.00%
- Median HH income
- $50,895
- Composite
- 47.81/100
- National rank
- #2226
- State rank
- #350 of 656 in OH
Livability — Sardinia
- Score
- 66/100
- State rank
- #643
- US rank
- #11399
Category grades
Schools grade is shown separately in the Schools card above.
Census & demographics
- Census place
- Sardinia, OH
- County
- Brown · 38,418 people
- Metro
- Cincinnati, OH-KY-IN
- Population (ZIP)
- 5,770
- Household income
- $63,780
- Rent vs Own
- Severe rent burden
- 2.0
Population outlook (Brown County) Hauer SSP2
- Today (2025)
- 41,243 people
- By 2030
- 39,382 · -4.5%
- By 2040
- 35,196 · -14.7%
- By 2050
- 30,743 · -25.5%
- By 2075
- 21,870 · -47.0%
- By 2100
- 15,069 · -63.5%
Race, ethnicity, and origin ACS 2023
- Neighborhood character
- Predominantly White (93%)
- Race & ethnicity
- White 93% Two or more races 4% Hispanic / Latino 2%
- Common ancestry
- Lithuanian 4% Iranian 2% Slovak 2%
- Foreign-born
- 0% · Canada
Political lean MEDSL · Brown
- 2024 margin
- Solid R (+61.5) · D 19.0% · R 80.5%
- 2008→2024 swing
- -38.2pp toward R · 2008: -23.3pp · 2024: -61.5pp
- All cycles
- 2024: R+61.5 2020: R+57.4 2016: R+52.2 2012: R+25.1 2008: R+23.3
Not yet ingested
- Civics
- —
Market trends
- HPI YoY
- ▼ -35.85%
- Current HPI
- 295.9141
- Rent YoY
- —
- Metro
- —
- State GDP YoY
- ▲ 1.98%
- F500 in state
- 48
Industry mix (Fortune 500 HQ in OH)
| Industry | F500 HQs | Revenue |
|---|---|---|
| Insurance | 3 | $145B |
|
||
| Industrial Machinery | 3 | $49B |
|
||
| Financial Services | 3 | $24B |
|
||
| Consumer Goods | 2 | $93B |
|
||
| Aerospace / Defense | 2 | $47B |
|
||
| Utilities | 2 | $33B |
|
||
Price history
+526.7% since first listed7 events — show timeline
- 2026-06-06 Listed $188,000 Cincy MLS
- 2024-08-12 Sold (MLS) $115,000 Cincy MLS
- 2024-07-09 Contingent — Cincy MLS
- 2024-06-07 Price Changed $140,000 Cincy MLS
- 2024-03-13 Listed $150,000 Cincy MLS
- 2011-04-22 Sold (MLS) $30,000 Cincy MLS
- 2010-09-23 Listed $30,000 Cincy MLS
Cash-flow waterfall
monthlySold comps — $/sqft
last 12 mo · ≤1 miLoading sold comps…