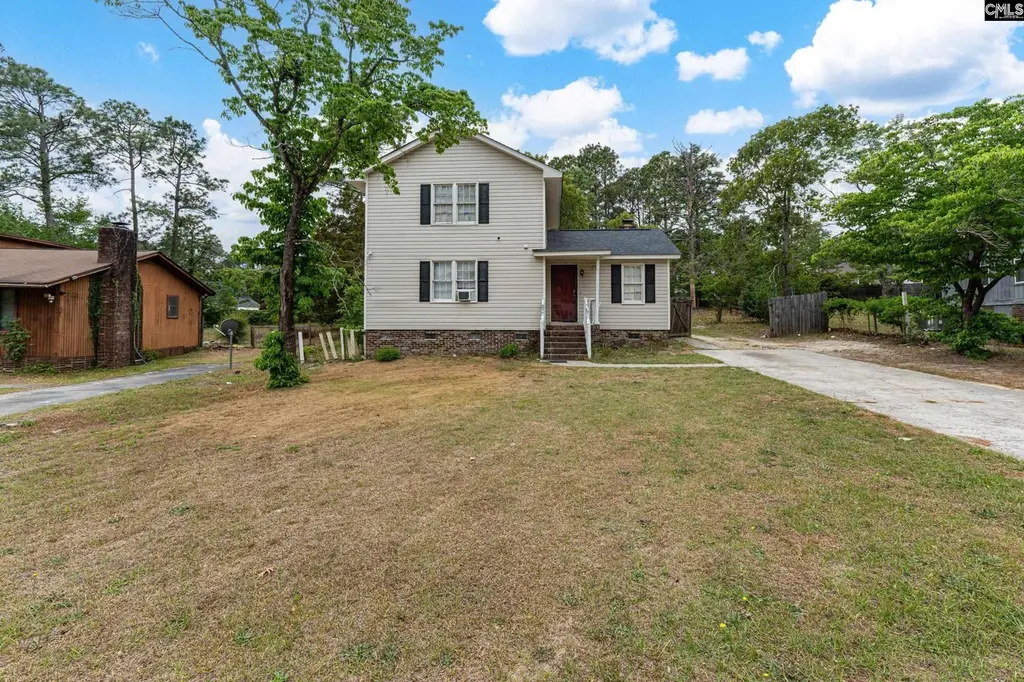
115 Ferncliffe Rd · Columbia, SC
Flood risk 1/10 · Minimal
- FEMA flood zone
- X (unshaded)
- Chance of flooding over 30 yrs
- 0.0%
- Est. flood insurance / yr
- $507 – $1,088
Fire risk 4/10 · Minor
- Est. fire insurance / yr
- $783 – $1,453
Heat risk 7/10 · Major
- Hot days now (above 107°F)
- 7 days/yr
- Hot days in 30 yrs
- 16 days/yr
Wind risk 6/10 · Moderate
- Chance of severe wind over 30 yrs
- 66.0%
Air-quality risk 3/10 · Minor
- Unhealthy air days now
- 3 days/yr
- Unhealthy air days in 30 yrs
- 3 days/yr
Risk factors via First Street. Map © Google.
Why this score? — see what drove the C+ grade
The composite is a weighted blend of 9 inputs, each scored 0–100. Each bar is that input's sub-score; the figure is the points it added to the 100-point composite (weight × sub-score).
- Cash flow +26.7/30.0
- DSCR +9.2/10.0
- ARV discount +7.5/15.0
- 1% rule +6.7/10.0
- Livability +3.9/5.0
- Schools +3.6/10.0
- Rent growth +3.2/5.0
- Condition / age +2.5/5.0
- Appreciation +0.0/10.0
$160,000
🖨 Deal sheet 📄 Offer letter ✓ Due diligence
Listing remarks
Don’t miss this opportunity to own in the highly sought-after Briarcliffe Estates! This 3-bedroom, 2-bath home features a desirable layout with the primary suite on the main level and a cozy wood-burning fireplace in the living room. Situated on a large lot, the home offers a spacious, fully fenced backyard—perfect for entertaining, pets, or outdoor enjoyment. Whether you’re looking for a primary residence or a strong investment opportunity, this property has great potential and is conveniently located near shopping, dining, and more. Sold As-Is. Disclaimer: CMLS has not reviewed and, therefore, does not endorse vendors who may appear in listings.
Key facts
- 0.3 acre lot
- 4 parking spots
- Built 1980
Property features AI
Finance
- HOA & community: Homeowners association present
Exterior
- Parking: 4 parking spaces
- Utilities: Public water; Public sewer
- Home design: 2-story home
- Construction: Crawlspace foundation
- Exterior features: Vinyl exterior; Paved road access; Approximately 0.3 acre lot
Interior
- Kitchen: Kitchen on the main level
- Bedrooms: Master bedroom on the main level; Two additional bedrooms on the second level
- Bathrooms: Two full bathrooms total, including one full main bath
- Heating & cooling: Central heating; Central air conditioning
- Interior features: One fireplace; Family room on the main level; Dining room on the main level
Neighborhood map
What this means for you Summary
Snapshot
- This is a 3-bed/2.0-bath single-family listed at $160k.
Deal economics
- At list price, monthly cash flow is $435 ($5k/yr) — positive.
- The deal already cash-flows at list — no discount required.
- Meets the 1% rule at list price ($2k rent vs $160k).
- Recommended offer: $155k (3.0% below list) — sets the bar for market timing.
- Cap rate 9.6% vs local median 5.0% in Columbia — top-decile yield for the area; either an underpriced asset or a hidden risk that comps aren't pricing in. Stress-test before assuming the spread holds.
Location & tenants
- Location reads 78/100 on livability (#18 in SC, #2,436 nationally) — a middle-class / working-renter tenant base. Strengths: amenities A+, commute A+, cost of living A+; Watch: employment D, crime F.
- Richland 02 (suburban): math 35% / reading 47% proficiency, ranked #29 of 80 in SC (top 36%) — families likely to look elsewhere, expect single-tenant / working-renter base with shorter leases.
- Zoned schools: Bookman Road Elementary (math 47% / reading 52%, grade D, #168 of 597 statewide, top 31%, 499 students, 62% FRL); Ridge View High (math 43% / reading 76%, grade C+, #110 of 196 statewide, top 58%, 1,711 students, 60% FRL) — zoned schools average 61% FRL vs 38% district-wide (23 pts higher); higher-poverty schools than district average — tighter screening recommended.
- Zoned-school proficiency averages 54% at this address vs 41% district-wide (+14 pts) — the actual schools serving this property are materially stronger than the Richland 02 average implies; a family-tenant draw the district grade alone would hide.
- Market conditions: Rents rising (+2.7%/yr); 334 active listings in the ZIP; 3 comparable units currently listed for rent nearby; rentals leasing fast (median 3d on market — plan ~1-2 weeks tenant-placement turnaround); solid renter incomes; 3,472 units permitted in Richland County in 2024 (1,096 in 5+ unit buildings).
Forward outlook
- Local home prices are declining (-3.0%/yr); year-one equity from $1k of loan paydown is wiped out by about $5k of value loss. Plan a longer hold.
- Richland County population projected at +30% by 2050 — long-run rental-demand tailwind backs the buy-and-hold thesis.
- At projected returns (-3.0% appreciation + 2.7% rent growth), your $45k cash investment doubles in ~10 years — after that, you're playing with house money.
Negotiation context
- It's been on market 43 days — a 3% lower offer ($155k) is reasonable based on typical stale-listing flexibility.
- 2 sale attempts since 4y ago; this cycle's ask has dropped $10k (6%) from the opening price — seller is motivated, your offer sets the floor, not the list.
- Current owner paid $105k; list at $160k implies a 53% gain — meaningful room to come down on a strong offer.
Risks & watch-outs
- Climate carrying-cost: major wind risk, 66% chance of damaging wind over 30y; extreme-heat days projected 7→16/yr by 2055 (HVAC capex compounding) — expect insurance premiums to compound above CPI over the hold.
Questions for the listing agent
- It's been on market 43 days. Have you received any prior offers? Is the seller open to a 3% concession, seller financing, or rate buy-down credit?
- What does the HOA fee cover, when was the last increase, and are there any pending special assessments or reserve-fund shortfalls?
- Is there a deadline driving the sale (1031 exchange, divorce, estate, relocation)? That informs how much negotiation room exists.
- Schools are D-rated, which usually means shorter tenancies and higher turnover. Who's the typical renter profile here, and what's been the actual vacancy rate?
- Crime grade is F in this area — have there been break-ins, vandalism, or insurance claims at this property in the last 3 years? What carrier currently insures it and at what premium?
- What's the average days-on-market for RENTAL listings here right now (not sales)? A rising rental-DOM trend means longer vacancies and softer asking-rent achievability than the comps imply.
- What's the recent tenant-quality profile in this submarket — average credit score on applications, eviction rate, late-payment / NSF rate, and stable-employment percentage? A property-management company in the area should have these aggregated.
- How much new for-sale + rental construction is in the pipeline within 1–3 miles? Heavy new supply typically softens prices + rents 12–24 months out; constrained supply supports both.
Investment metrics
- 1% rule
- 1.17% ✓
- Cap rate
- 9.55%
- Cash-on-cash
- 11.64%
- DSCR
- 1.52
- GRM
- 7.1
CMA / ARV
No comps found within radius.
Projected returns pro-forma
-3.0% appreciation · 2.7% rent growth · sell at horizon
- IRR
- 0.7%
- Equity multiple
- 1.03×
- Total profit
- $1,175
- Equity at exit
- $23,857
- IRR
- 10.0%
- Equity multiple
- 1.77×
- Total profit
- $34,323
- Equity at exit
- $13,834
Cash invested: $44,800 (down + closing). Projections, not guarantees.
Landlord ↔ Tenant lean methodology
- Overall (STATE)
- 90 Strongly Landlord-Friendly
- State South Carolina
- 90 Strongly Landlord-Friendly · R+6
- County
- — inherits STATE
- City
- — inherits STATE
ZIP-level market 29045
- Home prices YoY
- -17.9%
- Rents YoY
- 2.7%
- Active inventory
- 334
- Price-to-rent
- 7.1×
Monthly cashflow live
- Estimated rent
- $1,873 medium interval (Pro) →
- Mortgage (P&I)
- −$839
- Tax from tax record
- −$134 /mo · $1,609/yr
- Insurance
- −$67
- HOA
- −$5
- Vacancy / Maint / Mgmt
- −$393
- Net cashflow
- $435
Break-even live
UW: 25.0% down · 7.5% · 30yr · 1.5% tax · 5.0% vac · 8.0% maint · 8.0% mgmt
Financing live
Cash to close
- Down payment
- $40,000
- Closing costs
- $4,800
- Reserves months
- —
- Total cash needed
- —
Loan-product check · same deal, 3 products live
Conventional
25% down · 7.5% · 30yr
- Down + closing
- —
- Monthly P&I
- —
- Monthly cashflow
- —
- DSCR
- —
- Eligible?
- —
Personal DTI + credit; lowest rate.
DSCR
20% down · 8.5% · 30yr
- Down + closing
- —
- Monthly P&I
- —
- Monthly cashflow
- —
- DSCR
- —
- Eligible?
- —
No personal income docs; deal must DSCR.
Hard money
10% down · 12.0% · 12mo
- Down + closing
- —
- Monthly P&I
- —
- Monthly cashflow
- —
- DSCR
- —
- Eligible?
- —
Short-term bridge; refi at stabilization.
Rent comps 3 comps
| Address | Beds | Baths | Sqft | Rent | $/sqft | DOM | Units | Dist |
|---|---|---|---|---|---|---|---|---|
| 512 N Crossing Dr Columbia, SC | 3.0 | 2.0 | 1302 | $1,799 | $1.38 | 23d | 1 | 1.08mi |
| 352 White Gables Dr Columbia, SC | 3.0 | 2.0 | 1165 | $1,605 | $1.38 | 3d | 1 | 1.14mi |
| 112 Turnstone Way Columbia, SC | 3.0 | 2.0 | 1145 | $1,779 | $1.55 | 2d | 1 | 1.26mi |
HOA detail
- Monthly dues
- $5 · $60/yr
Listing history 23 events
-
2026-06-18days on market $160,000 Active 43 DOM
-
2026-06-17days on market $160,000 Active 42 DOM
-
2026-06-16days on market $160,000 Active 41 DOM
-
2026-06-15days on market $160,000 Active 40 DOM
-
2026-06-14days on market $160,000 Active 38 DOM
-
2026-06-13days on market $160,000 Active 37 DOM
-
2026-06-10days on market $160,000 Active 35 DOM
-
2026-06-09days on market $160,000 Active 34 DOM
-
2026-06-08days on market $160,000 Active 33 DOM
-
2026-06-07days on market $160,000 Active 32 DOM
-
2026-06-05days on market $160,000 Active 29 DOM
-
2026-06-03days on market $160,000 Active 28 DOM
-
2026-06-03pricedays on market $160,000 Active 27 DOM
-
2026-06-01days on market $170,000 Active 26 DOM
-
2026-05-31days on market $170,000 Active 25 DOM
-
2026-05-06$170,000 Active
-
2022-03-29historical
-
2022-03-27$155,000 Active
-
2008-05-08soldstatus $104,900
-
2006-01-04soldstatus $96,000
-
2002-04-11soldstatus $65,000
-
1993-08-26soldstatus $20,000
-
1989-03-03soldstatus $51,435
ⓘ Source: listings_history table (triggers on properties + properties_extension) + one-shot
backfill from property_details.listing_events for pre-trigger history.
Tax reassessment forecast SC · Resets to sale price
- Current annual tax
- $1,609 · $134/mo
- Projected year-2 tax
- $1,609 · $134/mo
- Expected delta
- $0/yr ($0/mo · -0.0%)
ⓘ Screening estimate from a state-policy table — verify with the county assessor before closing.
Climate risk First Street
- Flood 1/10 Low FEMA zone X (unshaded) · 0% chance over 30 yrs
- Wildfire 4/10 Moderate
- Heat 7/10 Severe 7 d/yr ≥107°F today · 16 d/yr by 30 yrs out
- Wind 6/10 Major 66% chance of damaging wind over 30 yrs
- Air quality 3/10 Moderate 3 unhealthy d/yr today · 3 by 30 yrs out
Nearby sold comps map
Loading sold comps map…
Walkable amenities ~0.75 mi
Loading nearby amenities…
Taxation est. · year 1
- Rental income
- $22,471
- − Mortgage interest
- −$8,962
- − Property taxes
- −$1,609
- − Insurance
- −$800
- − Repairs & maintenance
- −$1,798
- − Management
- −$1,798
- − HOA
- −$60
- − Depreciation
- −$4,655
- Taxable income
- $2,789
- Est. tax owed @ 24.0%
- −$669
- After-tax cash flow
- $4,545/yr
For passive investors: Depreciation is non-cash, so a rental often shows a tax loss while cash-flowing — sheltering income. Rental losses are passive: they offset passive income freely, and up to $25,000/yr can offset ordinary (W-2) income if you actively participate and your MAGI is under $100k (phasing out to $0 by $150k); unused losses carry forward. On sale, claimed depreciation is recaptured at up to 25%, and gains may owe capital-gains tax (a 1031 exchange can defer both). Figures are a year-1 estimate at your 24.0% rate — not tax advice; consult a CPA.
Schools (NCES district)
- District
- Richland 02
- NCES district ID
- 4503390
- Math proficiency
- 35% ▼ -15.00%
- Reading proficiency
- 47% ▼ -5.00%
- Median HH income
- $59,684
- Composite
- 36.2/100
- National rank
- #4730
- State rank
- #29 of 80 in SC
Livability — Columbia
- Score
- 78/100
- State rank
- #18
- US rank
- #2436
Category grades
Schools grade is shown separately in the Schools card above.
Census & demographics
- County
- Kershaw County · 47,655 people
- City population
- 335,994
- Metro
- Columbia, SC
- Population (ZIP)
- 31,372
- Household income
- $87,366
- Rent vs Own
- Severe rent burden
- 204.0
Population outlook (Richland County) Hauer SSP2
- Today (2025)
- 459,667 people
- By 2030
- 487,524 · +6.1%
- By 2040
- 542,035 · +17.9%
- By 2050
- 595,371 · +29.5%
- By 2075
- 732,998 · +59.5%
- By 2100
- 820,415 · +78.5%
Race, ethnicity, and origin ACS 2023
- Neighborhood character
- Diverse neighborhood (Simpson 0.62)
- Race & ethnicity
- White 53% Black 31% Hispanic / Latino 9% Two or more races 5% Asian 3%
- Hispanic origin (detail)
- Mexican 5% Puerto Rican 2%
- Common ancestry
- Serbian 1% Slovak 1% Lithuanian 1%
- Foreign-born
- 7% · Canada, South Korea
- Languages at home
- 90% English-only · Spanish 6% Other Indo-European 1% Korean 1%
Political lean MEDSL · Richland
- 2024 margin
- Solid D (+34.6) · D 66.4% · R 31.8% · Other 1.8%
- 2008→2024 swing
- +5.7pp toward D · 2008: 28.9pp · 2024: 34.6pp
- All cycles
- 2024: D+34.6 2020: D+38.3 2016: D+32.9 2012: D+33.3 2008: D+28.9
Not yet ingested
- Civics
- —
Market trends
- HPI YoY
- ▼ -45.60%
- Current HPI
- 209.2469
- Rent YoY
- ▲ 2.70%
- Metro
- Columbia, SC
- State GDP YoY
- ▲ 4.51%
- F500 in state
- 2
Industry mix (Fortune 500 HQ in SC)
| Industry | F500 HQs | Revenue |
|---|---|---|
| Packaging | 1 | $7B |
|
||
Price history
+230.5% since first listed8 events — show timeline
- 2026-05-06 Listed $170,000 Consolidated MLS
- 2022-03-29 Delisted — Consolidated MLS
- 2022-03-27 Listed $155,000 Consolidated MLS
- 2008-05-08 Sold (Public Records) $104,900 Public Records
- 2006-01-04 Sold (Public Records) $96,000 Public Records
- 2002-04-11 Sold (Public Records) $65,000 Public Records
- 1993-08-26 Sold (Public Records) $20,000 Public Records
- 1989-03-03 Sold (Public Records) $51,435 Public Records
Property tax history
-3.8%/yrLatest (2025): $1,609 · +3.5% YoY. Source: county tax records.
Cash-flow waterfall
monthlySold comps — $/sqft
last 12 mo · ≤1 miLoading sold comps…