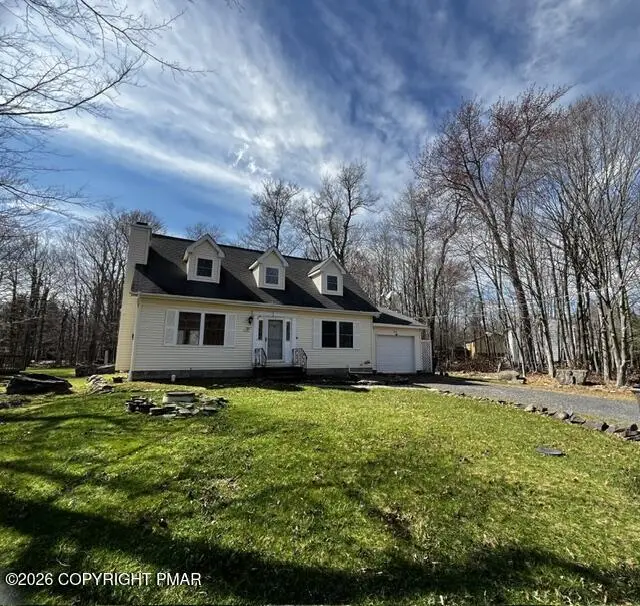
1281 Winding Way · Coolbaugh, PA
Flood risk 1/10 · Minimal
- FEMA flood zone
- X (unshaded)
- Chance of flooding over 30 yrs
- 0.0%
- Est. flood insurance / yr
- $507 – $1,088
Fire risk 3/10 · Minor
- Est. fire insurance / yr
- $511 – $949
Heat risk 1/10 · Minimal
- Hot days now (above 90°F)
- 7 days/yr
- Hot days in 30 yrs
- 15 days/yr
Wind risk 3/10 · Minor
- Chance of severe wind over 30 yrs
- 6.0%
Air-quality risk 2/10 · Minimal
- Unhealthy air days now
- 1 days/yr
- Unhealthy air days in 30 yrs
- 2 days/yr
Risk factors via First Street. Map © Google.
Why this score? — see what drove the D grade
The composite is a weighted blend of 9 inputs, each scored 0–100. Each bar is that input's sub-score; the figure is the points it added to the 100-point composite (weight × sub-score).
- Cash flow +11.1/30.0
- Appreciation +6.2/10.0
- ARV discount +5.2/15.0
- Schools +4.0/10.0
- DSCR +3.2/10.0
- 1% rule +3.1/10.0
- Rent growth +2.5/5.0
- Livability +2.5/5.0
- Condition / age +2.5/5.0
$275,450
🖨 Deal sheet 📄 Offer letter ✓ Due diligence
Listing remarks MLS
Charming 3-bedroom, 2 bath home offering a large living room with wood burning fireplace and french doors leading to the back deck. Newly updated kitchen with granite counter tops and stainless-steel appliances. Home is in an amenity filled community offering swimming pools, basketball courts, tennis courts, lakes, monthly activities and so much more not to mention this development does allow short term rentals! Close to many Pocono attractions. Seller is a PA licensed REALTOR.
Key facts
- French doors
- Updated kitchen
- Granite counter tops
Tags
Neighborhood map
What this means for you Summary
Snapshot
- This is a 2-bed/2.0-bath single-family listed at $275k.
Deal economics
- At list price, monthly cash flow is $-113 ($-1k/yr) — negative.
- To cash-flow at today's rent, offer at most $255k (7.3% below list).
- To meet the 1% rule (rent ≥ 1% of price), the offer needs to be $222k (19.3% below list).
- Recommended offer: $222k (19.3% below list) — sets the bar for 1% rule.
Location & tenants
- Location reads: area grade D — affects rentability + tenant quality, not the cash-flow math above.
- Pocono Mountain SD (rural): math 37% / reading 55% proficiency, ranked #245 of 539 in PA (top 46%) — families likely to look elsewhere, expect single-tenant / working-renter base with shorter leases.
- Market conditions: 355 active listings in the ZIP; 2 comparable units currently listed for rent nearby; 278 units permitted in Monroe County in 2024 (52 in 5+ unit buildings).
Forward outlook
- In year one you build about $8k of equity ($2k loan paydown + $6k appreciation (2.4% local appreciation)).
- Monroe County population projected at -11% by 2050 — secular population decline; favor cash flow + early exit over multi-decade hold.
- By year 5, paydown + projected appreciation supports a ~$37k cash-out refi (75% LTV) — recoverable capital for the next deal without selling this one.
Negotiation context
- It's been on market 63 days — a 6% lower offer ($259k) is reasonable based on typical stale-listing flexibility.
- 5 sale attempts since 18y ago with the ask held roughly flat each time — persistent listings suggest the price (not the market) is what's stuck; bring a comps-based counter.
- Current owner paid $145k; list at $275k implies a 90% gain — meaningful room to come down on a strong offer.
Questions for the listing agent
- What do current leases actually rent for vs. the listed asking? Can we see a recent rent roll and the last 12 months of T-12 income?
- It's been on market 63 days. Have you received any prior offers? Is the seller open to a 19% concession, seller financing, or rate buy-down credit?
- What does the HOA fee cover, when was the last increase, and are there any pending special assessments or reserve-fund shortfalls?
- Why hasn't it sold? Are there any deal-killer items the seller is aware of (foundation, flood, title, zoning, code violations)?
- Is there a deadline driving the sale (1031 exchange, divorce, estate, relocation)? That informs how much negotiation room exists.
- The area grade is low — what's the realistic commute time and amenity access for the typical tenant pool here? Any planned neighborhood developments (good or bad) we should know about?
- What's the average days-on-market for RENTAL listings here right now (not sales)? A rising rental-DOM trend means longer vacancies and softer asking-rent achievability than the comps imply.
- What's the recent tenant-quality profile in this submarket — average credit score on applications, eviction rate, late-payment / NSF rate, and stable-employment percentage? A property-management company in the area should have these aggregated.
- How much new for-sale + rental construction is in the pipeline within 1–3 miles? Heavy new supply typically softens prices + rents 12–24 months out; constrained supply supports both.
Investment metrics
- 1% rule
- 0.81% ✗
- Cap rate
- 5.80%
- Cash-on-cash
- -1.76%
- DSCR
- 0.92
- GRM
- 10.3
CMA / ARV
- ARV (median comp)
- $261,941
- List price
- $275,450
- Delta
- 5.16%
- Verdict
- FAIR
- Comps
- 20 within 1.0 mi
Show comp detail 12 sales within ~0.75 mi
| Address | Dist | Beds/Ba | Sqft | Sold | Price | $/sf | Match |
|---|---|---|---|---|---|---|---|
| 2834 Fairhaven Dr | 0.46mi | 3/2.0 (+1) | 1,416 (-6%) | 3mo | $255,000 | $180 | 60 |
| 2609 Foxledge Dr | 0.48mi | 3/1.5 (+1) | 1,572 (+4%) | 12mo | $194,500 | $124 | 54 |
| 1189 Fox Trl | 0.70mi | 2/2.0 | 1,372 (-9%) | 1mo | $190,522 | $139 | 51 |
| 2392 Winding Way | 0.62mi | 3/2.0 (+1) | 1,560 (+3%) | 12mo | $262,500 | $168 | 51 |
| 2630 Foxledge Dr | 0.54mi | 3/2.0 (+1) | 1,620 (+7%) | 9mo | $220,000 | $136 | 51 |
| 2714 Starlight Ter | 0.69mi | 3/2.0 (+1) | 1,400 (-7%) | 7mo | $290,000 | $207 | 44 |
| 2505 Waterfront Dr | 0.53mi | 3/2.5 (+1) | 1,726 (+14%) | 3mo | $535,000 | $310 | 42 |
| 1154 Jewel Ter | 0.68mi | 3/1.5 (+1) | 1,428 (-6%) | 13mo | $250,000 | $175 | 41 |
| 1452 Waterfront Dr | 0.65mi | 3/2.0 (+1) | 1,362 (-10%) | 10mo | $228,000 | $167 | 40 |
| 2744 Cleremont Dr | 0.58mi | 3/2.0 (+1) | 1,668 (+10%) | 14mo | $297,000 | $178 | 40 |
| 1066 Knollwood Dr | 0.73mi | 3/2.0 (+1) | 1,350 (-11%) | 6mo | $335,000 | $248 | 38 |
| 2871 Fairhaven Dr | 0.72mi | 3/2.0 (+1) | 1,712 (+13%) | 5mo | $236,000 | $138 | 35 |
Match score weights: distance 35% · size 25% · config 20% · recency 20%. Top-matched comps best support the ARV.
Projected returns pro-forma
2.36% appreciation · 3.0% rent growth · sell at horizon
- IRR
- 3.9%
- Equity multiple
- 1.22×
- Total profit
- $16,719
- Equity at exit
- $114,000
- IRR
- 7.5%
- Equity multiple
- 2.06×
- Total profit
- $81,516
- Equity at exit
- $168,379
Cash invested: $77,126 (down + closing). Projections, not guarantees.
Landlord ↔ Tenant lean methodology
- Overall (STATE)
- 62 Landlord-Friendly
- State Pennsylvania
- 62 Landlord-Friendly · EVEN
- County
- — inherits STATE
- City
- — inherits STATE
ZIP-level market 18466
- Home prices YoY
- 1.2%
- Active inventory
- 355
- Price-to-rent
- 10.3×
Monthly cashflow live
- Estimated rent
- $2,223 medium interval (Pro) →
- Mortgage (P&I)
- −$1,444
- Tax from tax record
- −$161 /mo · $1,936/yr
- Insurance
- −$115
- HOA
- −$149
- Vacancy / Maint / Mgmt
- −$467
- Net cashflow
- $-113
Break-even live
UW: 25.0% down · 7.5% · 30yr · 1.5% tax · 5.0% vac · 8.0% maint · 8.0% mgmt
Financing live
Cash to close
- Down payment
- $68,862
- Closing costs
- $8,264
- Reserves months
- —
- Total cash needed
- —
Loan-product check · same deal, 3 products live
Conventional
25% down · 7.5% · 30yr
- Down + closing
- —
- Monthly P&I
- —
- Monthly cashflow
- —
- DSCR
- —
- Eligible?
- —
Personal DTI + credit; lowest rate.
DSCR
20% down · 8.5% · 30yr
- Down + closing
- —
- Monthly P&I
- —
- Monthly cashflow
- —
- DSCR
- —
- Eligible?
- —
No personal income docs; deal must DSCR.
Hard money
10% down · 12.0% · 12mo
- Down + closing
- —
- Monthly P&I
- —
- Monthly cashflow
- —
- DSCR
- —
- Eligible?
- —
Short-term bridge; refi at stabilization.
Rent comps 2 comps
| Address | Beds | Baths | Sqft | Rent | $/sqft | DOM | Units | Dist |
|---|---|---|---|---|---|---|---|---|
| 9294 Bluebird Ct Tobyhanna, PA | 3.0 | 2.5 | 2107 | $2,150 | $1.02 | 13d | 1 | 1.32mi |
| 9026 Idlewild Dr Tobyhanna, PA | 3.0 | 2.0 | 1068 | $2,300 | $2.15 | 13d | 1 | 1.36mi |
HOA detail
- Monthly dues
- $149 · $1,788/yr
- Likely covers
- pool
Listing history 31 events
-
2026-06-18days on market $275,450 Active 63 DOM
-
2026-06-17days on market $275,450 Active 62 DOM
-
2026-06-16days on market $275,450 Active 61 DOM
-
2026-06-15days on market $275,450 Active 60 DOM
-
2026-06-14days on market $275,450 Active 58 DOM
-
2026-06-13days on market $275,450 Active 57 DOM
-
2026-06-10days on market $275,450 Active 55 DOM
-
2026-06-09days on market $275,450 Active 54 DOM
-
2026-06-08days on market $275,450 Active 53 DOM
-
2026-06-07days on market $275,450 Active 52 DOM
-
2026-06-02days on market $275,450 Active 47 DOM
-
2026-06-01days on market $275,450 Active 46 DOM
-
2026-05-31days on market $275,450 Active 45 DOM
-
2026-05-30days on market $275,450 Active 44 DOM
-
2026-05-11price $275,450 482-char remark
Show marketing remark (482 chars)
Charming 3-bedroom, 2 bath home offering a large living room with wood burning fireplace and french doors leading to the back deck. Newly updated kitchen with granite counter tops and stainless-steel appliances. Home is in an amenity filled community offering swimming pools, basketball courts, tennis courts, lakes, monthly activities and so much more not to mention this development does allow short term rentals! Close to many Pocono attractions. Seller is a PA licensed REALTOR.
-
2026-04-16$287,550 Active 482-char remark
Show marketing remark (482 chars)
Charming 3-bedroom, 2 bath home offering a large living room with wood burning fireplace and french doors leading to the back deck. Newly updated kitchen with granite counter tops and stainless-steel appliances. Home is in an amenity filled community offering swimming pools, basketball courts, tennis courts, lakes, monthly activities and so much more not to mention this development does allow short term rentals! Close to many Pocono attractions. Seller is a PA licensed REALTOR.
-
2025-08-07price $239,900
-
2025-07-03price $239,900
-
2025-06-03price $249,700
-
2025-05-31price $249,900
-
2025-05-31price $249,900
-
2025-05-16$279,900 Active
-
2025-04-25$279,900 Active
-
2022-03-17soldstatus $145,000
-
2022-03-14soldstatus $145,000
-
2021-09-17$145,000
-
2008-03-11$154,000
-
2005-04-04soldstatus $121,540
-
2000-08-08soldstatus $60,000
-
1994-02-17soldstatus $20,000
-
1988-12-28soldstatus $13,250
ⓘ Source: listings_history table (triggers on properties + properties_extension) + one-shot
backfill from property_details.listing_events for pre-trigger history.
Tax reassessment forecast PA · Partial reset (capped growth)
- Current annual tax
- $1,936 · $161/mo
- Projected year-2 tax
- $3,144 · $262/mo
- Expected delta
- +$1,208/yr (+$101/mo · 62.4%)
ⓘ Screening estimate from a state-policy table — verify with the county assessor before closing.
Climate risk First Street
- Flood 1/10 Low FEMA zone X (unshaded) · 0% chance over 30 yrs
- Wildfire 3/10 Moderate
- Heat 1/10 Low 7 d/yr ≥90°F today · 15 d/yr by 30 yrs out
- Wind 3/10 Moderate 6% chance of damaging wind over 30 yrs
- Air quality 2/10 Low 1 unhealthy d/yr today · 2 by 30 yrs out
Nearby sold comps map
Loading sold comps map…
Walkable amenities ~0.75 mi
Loading nearby amenities…
Taxation est. · year 1
- Rental income
- $26,678
- − Mortgage interest
- −$15,429
- − Property taxes
- −$1,936
- − Insurance
- −$1,377
- − Repairs & maintenance
- −$2,134
- − Management
- −$2,134
- − HOA
- −$1,788
- − Depreciation
- −$8,013
- Taxable loss
- −$6,134
- Est. tax savings @ 24.0%
- +$1,472
- After-tax cash flow
- $113/yr
For passive investors: Depreciation is non-cash, so a rental often shows a tax loss while cash-flowing — sheltering income. Rental losses are passive: they offset passive income freely, and up to $25,000/yr can offset ordinary (W-2) income if you actively participate and your MAGI is under $100k (phasing out to $0 by $150k); unused losses carry forward. On sale, claimed depreciation is recaptured at up to 25%, and gains may owe capital-gains tax (a 1031 exchange can defer both). Figures are a year-1 estimate at your 24.0% rate — not tax advice; consult a CPA.
Schools (NCES district)
- District
- Pocono Mountain SD
- NCES district ID
- 4219500
- Math proficiency
- 37% ▼ -5.00%
- Reading proficiency
- 55% ▲ 1.00%
- Median HH income
- $55,317
- Composite
- 39.91/100
- National rank
- #3856
- State rank
- #245 of 539 in PA
Livability — Coolbaugh
No livability data for this city. (Only ~50 U.S. cities are tracked.)
Census & demographics
- Population (ZIP)
- 17,997
Population outlook (Monroe County) Hauer SSP2
- Today (2025)
- 164,099 people
- By 2030
- 161,412 · -1.6%
- By 2040
- 154,616 · -5.8%
- By 2050
- 146,710 · -10.6%
- By 2075
- 140,830 · -14.2%
- By 2100
- 138,472 · -15.6%
Race, ethnicity, and origin ACS 2023
- Neighborhood character
- Highly diverse neighborhood (Simpson 0.72)
- Race & ethnicity
- White 38% Hispanic / Latino 27% Black 24% Two or more races 17% Asian 4%
- Hispanic origin (detail)
- Puerto Rican 12% Dominican 6%
- Common ancestry
- Romanian 2% Portuguese 1% German 1%
- Foreign-born
- 16% · Canada
- Languages at home
- 77% English-only · Spanish 17% Other Indo-European 2% Russian/Polish/Slavic 1%
Political lean MEDSL · Monroe
- 2024 margin
- Toss-up / Even · D 49.1% · R 49.9%
- 2008→2024 swing
- -17.1pp toward R · 2008: 16.3pp · 2024: -0.8pp
- All cycles
- 2024: R+0.8 2020: D+6.4 2016: D+0.3 2012: D+14.0 2008: D+16.3
Not yet ingested
- Civics
- —
Market trends
- HPI YoY
- ▲ 2.36%
- Current HPI
- 202.4134
- Rent YoY
- —
- Metro
- —
- State GDP YoY
- ▲ 1.68%
- F500 in state
- 34
Industry mix (Fortune 500 HQ in PA)
| Industry | F500 HQs | Revenue |
|---|---|---|
| Healthcare | 2 | $309B |
|
||
| Insurance | 2 | $27B |
|
||
| Telecommunications / Media | 1 | $124B |
|
||
| Industrial Distribution | 1 | $22B |
|
||
| Financial Services | 1 | $20B |
|
||
| Chemicals / Materials | 1 | $18B |
|
||
Price history
+1978.9% since first listed17 events — show timeline
- 2026-05-11 Price Changed $275,450 PMAR
- 2026-04-16 Listed $287,550 PMAR
- 2025-08-07 Price Changed $239,900 GLVRMLS
- 2025-07-03 Price Changed $239,900 PMAR
- 2025-06-03 Price Changed $249,700 PMAR
- 2025-05-31 Price Changed $249,900 GLVRMLS
- 2025-05-31 Price Changed $249,900 PMAR
- 2025-05-16 Listed $279,900 GLVRMLS
- 2025-04-25 Listed $279,900 PMAR
- 2022-03-17 Sold (Public Records) $145,000 Public Records
- 2022-03-14 Sold (MLS) $145,000 PMAR
- 2021-09-17 Listed $145,000 PMAR
- 2008-03-11 Listed $154,000 PMAR
- 2005-04-04 Sold (Public Records) $121,540 Public Records
- 2000-08-08 Sold (Public Records) $60,000 Public Records
- 1994-02-17 Sold (Public Records) $20,000 Public Records
- 1988-12-28 Sold (Public Records) $13,250 Public Records
Property tax history
-5.9%/yrLatest (2026): $1,936 · +3.2% YoY. Source: county tax records.
Cash-flow waterfall
monthlySold comps — $/sqft
last 12 mo · ≤1 miLoading sold comps…