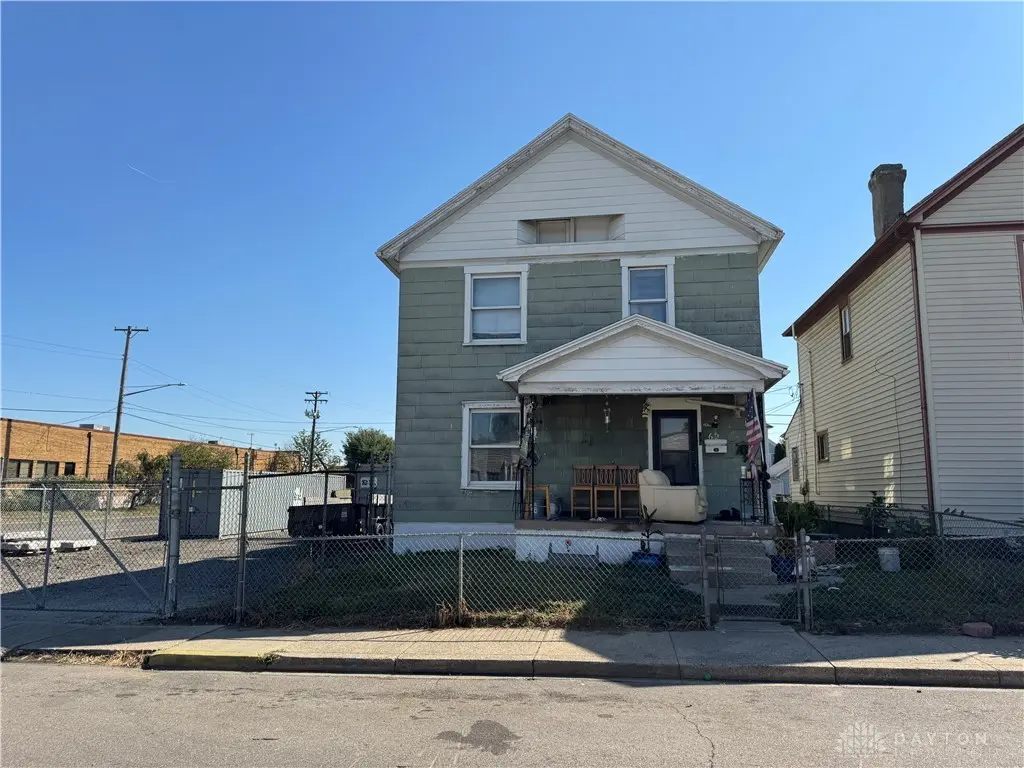
62 Brenner Ave · Dayton, OH
Flood risk 6/10 · Moderate
- FEMA flood zone
- X (unshaded)
- Chance of flooding over 30 yrs
- 0.75%
- Est. flood insurance / yr
- $473 – $860
Fire risk 1/10 · Minimal
- Est. fire insurance / yr
- $713 – $1,323
Heat risk 4/10 · Minor
- Hot days now (above 101°F)
- 7 days/yr
- Hot days in 30 yrs
- 18 days/yr
Wind risk 2/10 · Minimal
- Chance of severe wind over 30 yrs
- —
Air-quality risk 3/10 · Minor
- Unhealthy air days now
- 2 days/yr
- Unhealthy air days in 30 yrs
- 4 days/yr
Risk factors via First Street. Map © Google.
Why this score? — see what drove the B+ grade
The composite is a weighted blend of 9 inputs, each scored 0–100. Each bar is that input's sub-score; the figure is the points it added to the 100-point composite (weight × sub-score).
- Cash flow +30.0/30.0
- ARV discount +15.0/15.0
- 1% rule +10.0/10.0
- DSCR +10.0/10.0
- Rent growth +3.4/5.0
- Livability +3.2/5.0
- Condition / age +2.5/5.0
- Schools +1.3/10.0
- Appreciation +0.0/10.0
$75,000
🖨 Deal sheet 📄 Offer letter ✓ Due diligence
Listing remarks MLS
Single family home located on the corner of Brenner Ave. Currently rented. Also being offered with a commercial residential portfolio. This house can be sold separately or included in the portfolio sale that includes the vacant storage lot next door, the vacant house and commercial warehouse across the street. Call agent for more info
Key facts
- 2,945 sq ft lot
- Built 1908
- Listed 242 days
Neighborhood map
What this means for you Summary
Snapshot
- This is a 3-bed/2.0-bath single-family listed at $75k.
Deal economics
- At list price, monthly cash flow is $439 ($5k/yr) — positive.
- The deal already cash-flows at list — no discount required.
- Meets the 1% rule at list price ($1k rent vs $75k).
- Recommended offer: $66k (12.0% below list) — sets the bar for market timing.
- Cap rate 13.3% vs local median 7.4% in Dayton — top-decile yield for the area; either an underpriced asset or a hidden risk that comps aren't pricing in. Stress-test before assuming the spread holds.
Location & tenants
- Location reads 65/100 on livability (#716 in OH) — a middle-class / working-renter tenant base. Strengths: cost of living A+, housing A+, health & safety A; Watch: schools C-, amenities C-, crime F.
- Dayton City (urban): math 12% / reading 21% proficiency, ranked #641 of 656 in OH (top 98%) — low school quality limits family demand, transient renter base, plan for 1-2y turnover; 74% free/reduced lunch — lower-income household profile, screen leases tightly.
- Market conditions: Rents rising (+3.7%/yr); 77 active listings in the ZIP; 40 comparable units currently listed for rent nearby; rentals at typical pace (median 21d on market — plan ~3-4 weeks tenant-placement turnaround); lower-income renter base — watch delinquency; 907 units permitted in Montgomery County in 2024 (416 in 5+ unit buildings).
- This rent runs 36% of the median local income ($38k/yr) — at the standard rent-burdened threshold; future hikes will face affordability resistance.
Forward outlook
- Local home prices are declining (-3.0%/yr); year-one equity from $519 of loan paydown is wiped out by about $2k of value loss. Plan a longer hold.
- Montgomery County population projected at -10% by 2050 — secular population decline; favor cash flow + early exit over multi-decade hold.
- At projected returns (-3.0% appreciation + 3.7% rent growth), your $21k cash investment doubles in ~5 years — after that, you're playing with house money.
Negotiation context
- It's been on market 242 days — a 12% lower offer ($66k) is reasonable based on typical stale-listing flexibility.
- 3 sale attempts since 15y ago with the ask held roughly flat each time — persistent listings suggest the price (not the market) is what's stuck; bring a comps-based counter.
Risks & watch-outs
- Watch-outs: built in 1908 — expect roof / HVAC / electrical / plumbing capex.
- Climate carrying-cost: major flood risk — expect insurance premiums to compound above CPI over the hold.
Questions for the listing agent
- It's been on market 242 days. Have you received any prior offers? Is the seller open to a 12% concession, seller financing, or rate buy-down credit?
- Built in 1908 — when were the roof, HVAC, electrical panel, plumbing, and water heater last replaced?
- Why hasn't it sold? Are there any deal-killer items the seller is aware of (foundation, flood, title, zoning, code violations)?
- Is there a deadline driving the sale (1031 exchange, divorce, estate, relocation)? That informs how much negotiation room exists.
- Crime grade is F in this area — have there been break-ins, vandalism, or insurance claims at this property in the last 3 years? What carrier currently insures it and at what premium?
- What's the average days-on-market for RENTAL listings here right now (not sales)? A rising rental-DOM trend means longer vacancies and softer asking-rent achievability than the comps imply.
- What's the recent tenant-quality profile in this submarket — average credit score on applications, eviction rate, late-payment / NSF rate, and stable-employment percentage? A property-management company in the area should have these aggregated.
- How much new for-sale + rental construction is in the pipeline within 1–3 miles? Heavy new supply typically softens prices + rents 12–24 months out; constrained supply supports both.
Investment metrics
- 1% rule
- 1.52% ✓
- Cap rate
- 13.31%
- Cash-on-cash
- 25.08%
- DSCR
- 2.12
- GRM
- 5.5
CMA / ARV
- ARV (median comp)
- $94,468
- List price
- $75,000
- Delta
- -20.61%
- Verdict
- UNDERPRICED
- Comps
- 20 within 1.0 mi
Show comp detail 12 sales within ~0.75 mi
| Address | Dist | Beds/Ba | Sqft | Sold | Price | $/sf | Match |
|---|---|---|---|---|---|---|---|
| 44 Bell St | 0.25mi | 2/1.5 (-1) | 1,404 (0%) | 2mo | $125,000 | $89 | 79 |
| 42 S Monmouth St | 0.57mi | 3/2.0 | 1,332 (-5%) | 3mo | $109,900 | $83 | 63 |
| 1820 E 4th St | 0.43mi | 2/1.5 (-1) | 1,351 (-4%) | 7mo | $70,000 | $52 | 61 |
| 45 S Monmouth St | 0.55mi | 3/1.5 | 1,367 (-3%) | 10mo | $135,000 | $99 | 60 |
| 107 Sherman St | 0.70mi | 3/1.5 | 1,446 (+3%) | 2mo | $73,000 | $50 | 59 |
| 60 Bell St | 0.28mi | 2/1.5 (-1) | 1,225 (-13%) | 3mo | $64,500 | $53 | 56 |
| 425 Huffman Ave | 0.55mi | 3/2.0 | 1,248 (-11%) | 1mo | $80,000 | $64 | 55 |
| 109 Ringgold St | 0.46mi | 2/2.0 (-1) | 1,554 (+11%) | 10mo | $212,900 | $137 | 47 |
| 2808 E 4th St | 0.67mi | 3/1.0 | 1,574 (+12%) | 6mo | $65,000 | $41 | 40 |
| 720 Springfield St | 0.58mi | 3/1.0 | 1,200 (-14%) | 8mo | $62,000 | $52 | 38 |
| 1531 Chapel St | 0.69mi | 3/2.5 | 1,216 (-13%) | 6mo | $126,500 | $104 | 38 |
| 27 Henry St | 0.66mi | 2/1.0 (-1) | 1,262 (-10%) | 9mo | $215,000 | $170 | 36 |
Match score weights: distance 35% · size 25% · config 20% · recency 20%. Top-matched comps best support the ARV.
Projected returns pro-forma
-3.0% appreciation · 3.71% rent growth · sell at horizon
- IRR
- 19.3%
- Equity multiple
- 1.79×
- Total profit
- $16,598
- Equity at exit
- $11,183
- IRR
- 28.0%
- Equity multiple
- 3.56×
- Total profit
- $53,776
- Equity at exit
- $6,485
Cash invested: $21,000 (down + closing). Projections, not guarantees.
Landlord ↔ Tenant lean methodology
- Overall (STATE)
- 73 Landlord-Friendly
- State Ohio
- 73 Landlord-Friendly · R+6
- County
- — inherits STATE
- City
- — inherits STATE
ZIP-level market 45403
- Home prices YoY
- -3.7%
- Rents YoY
- 3.7%
- Active inventory
- 77
- Price-to-rent
- 5.5×
Monthly cashflow live
- Estimated rent
- $1,137 high interval (Pro) →
- Mortgage (P&I)
- −$393
- Tax from tax record
- −$35 /mo · $422/yr
- Insurance
- −$31
- HOA
- −$0
- Vacancy / Maint / Mgmt
- −$239
- Net cashflow
- $439
Break-even live
UW: 25.0% down · 7.5% · 30yr · 1.5% tax · 5.0% vac · 8.0% maint · 8.0% mgmt
Financing live
Cash to close
- Down payment
- $18,750
- Closing costs
- $2,250
- Reserves months
- —
- Total cash needed
- —
Loan-product check · same deal, 3 products live
Conventional
25% down · 7.5% · 30yr
- Down + closing
- —
- Monthly P&I
- —
- Monthly cashflow
- —
- DSCR
- —
- Eligible?
- —
Personal DTI + credit; lowest rate.
DSCR
20% down · 8.5% · 30yr
- Down + closing
- —
- Monthly P&I
- —
- Monthly cashflow
- —
- DSCR
- —
- Eligible?
- —
No personal income docs; deal must DSCR.
Hard money
10% down · 12.0% · 12mo
- Down + closing
- —
- Monthly P&I
- —
- Monthly cashflow
- —
- DSCR
- —
- Eligible?
- —
Short-term bridge; refi at stabilization.
Rent comps 40 comps
| Address | Beds | Baths | Sqft | Rent | $/sqft | DOM | Units | Dist |
|---|---|---|---|---|---|---|---|---|
| 29 N Garfield St Dayton, OH | 3.0 | 1.0 | 1092 | $1,000 | $0.92 | 23d | 1 | 0.19mi |
| 2200 E 5th St Dayton, OH | 2.0 | 1.0 | 1000 | $825 | $0.82 | 23d | 1 | 0.49mi |
| 15 John St Unit 15 Dayton, OH | 2.0 | 1.0 | 1200 | $800 | $0.67 | 23d | 1 | 0.49mi |
| 120 S Monmouth St Dayton, OH | 2.0 | 1.0 | 1000 | $950 | $0.95 | 43d | 1 | 0.61mi |
| 101 N Irwin St Dayton, OH | 2.0 | 1.0 | 900 | $1,100 | $1.22 | 3d | 1 | 0.65mi |
| 1517 Chapel St Unit 1521 Dayton, OH | 2.0 | 1.0 | 1239 | $1,000 | $0.81 | 3d | 1 | 0.70mi |
| 424 Bantz Ct Dayton, OH | 3.0 | 1.0 | 1192 | $1,050 | $0.88 | 3d | 1 | 0.81mi |
| 224 S Irwin St Unit 226 Dayton, OH | 2.0 | 1.0 | 992 | $900 | $0.91 | 3d | 1 | 0.84mi |
| 78 Notre Dame Ave Unit A Dayton, OH | 3.0 | 1.0 | 1015 | $1,025 | $1.01 | 43d | 1 | 0.84mi |
| 224 Deeds Ave Dayton, OH | 2.0 | 1.0 | 1124 | $950 | $0.85 | 23d | 1 | 0.85mi |
| 314 Sheridan Ave Dayton, OH | 3.0 | 1.0 | 1258 | $1,150 | $0.91 | 3d | 1 | 0.85mi |
| 155 Grove Ave Unit 155 Dayton, OH | 3.0 | 1.0 | 1150 | $950 | $0.83 | 43d | 1 | 0.86mi |
| 163 Grove Ave Unit 163 Dayton, OH | 3.0 | 1.0 | 1000 | $950 | $0.95 | 43d | 1 | 0.87mi |
| 200 Hart St Dayton, OH | 3.0 | 1.0 | 1304 | $1,250 | $0.96 | 23d | 1 | 0.90mi |
| 321 Deeds Ave Unit 319 Dayton, OH | 4.0 | 2.0 | 1794 | $1,100 | $0.61 | 43d | 1 | 0.91mi |
| 210 S Hedges St Dayton, OH | 2.0 | 1.5 | 1048 | $1,045 | $1.00 | 21d | 1 | 0.94mi |
| 201 Pleasant Ave Unit 203 Dayton, OH | 2.0 | 1.0 | 1250 | $975 | $0.78 | 23d | 1 | 0.96mi |
| 112 Webster St Dayton, OH | 2.0 | 1.0–2.0 | 802 | $2,198 | $2.74 | 2d | 63 | 0.99mi |
| 2034 Leo St Dayton, OH | 2.0 | 1.0 | 888 | $1,100 | $1.24 | 21d | 1 | 1.00mi |
| 821 Herman Ave Dayton, OH | 3.0 | 1.0 | 1456 | $1,100 | $0.76 | 21d | 1 | 1.04mi |
| 511 Parrot St Dayton, OH | 3.0 | 1.5 | 1618 | $1,100 | $0.68 | 14d | 1 | 1.05mi |
| 3707 E 3rd St Unit 3705 Dayton, OH | 3.0 | 1.0 | 1410 | $1,045 | $0.74 | 23d | 1 | 1.06mi |
| 204 Sears St Dayton, OH | 3.0 | 1.0–2.5 | 1124 | $2,793 | $2.48 | 2d | 10 | 1.06mi |
| 425 Dayton Towers Dr Dayton, OH | 2.0 | 1.0–2.0 | 852 | $1,799 | $2.11 | 2d | 30 | 1.06mi |
| 2119 Bellefontaine Ave Dayton, OH | 3.0 | 1.5 | 1500 | $1,400 | $0.93 | 2d | 1 | 1.07mi |
| 3719 E 3rd St Unit 3717 Dayton, OH | 3.0 | 1.0 | 1092 | $1,100 | $1.01 | 2d | 1 | 1.08mi |
| 115 Livingston Ave Dayton, OH | 3.0 | 1.0 | 1624 | $1,450 | $0.89 | 44d | 1 | 1.08mi |
| 3817 E 5th St Dayton, OH | 2.0 | 1.0 | 1178 | $1,295 | $1.10 | 2d | 1 | 1.21mi |
| 500 E 3rd St Dayton, OH | 1.0–2.0 | 1.0–2.0 | 935 | $1,660 | $1.78 | 3d | 16 | 1.21mi |
| 1300 Chardon Ct Dayton, OH | 2.0 | 1.0 | 970 | $1,200 | $1.24 | 2d | 1 | 1.21mi |
| 637 Creighton Ave Dayton, OH | 3.0 | 1.0 | 1144 | $1,350 | $1.18 | 14d | 1 | 1.24mi |
| 451 Hunter Ave Dayton, OH | 2.0 | 1.0 | 974 | $800 | $0.82 | 23d | 1 | 1.24mi |
| 4013 E 3rd St Dayton, OH | 2.0 | 1.5 | 1144 | $1,095 | $0.96 | 14d | 1 | 1.25mi |
| 144 N Quentin Ave Dayton, OH | 3.0 | 1.0 | 1038 | $1,600 | $1.54 | 43d | 1 | 1.26mi |
| 117 Clay St Unit 117 Dayton, OH | 2.0 | 1.5 | 1632 | $1,950 | $1.19 | 23d | 1 | 1.26mi |
| 31 Bidleman St Dayton, OH | 2.0 | 1.5 | 1568 | $1,100 | $0.70 | 43d | 1 | 1.26mi |
| 211 N Cherrywood Ave Unit 2 Dayton, OH | 2.0 | 1.0 | 950 | $795 | $0.84 | 3d | 1 | 1.30mi |
| 228 James St Dayton, OH | 3.0 | 1.0 | 1700 | $1,200 | $0.71 | 43d | 1 | 1.34mi |
| 227 James St Unit 1 Dayton, OH | 3.0 | 1.0 | 1700 | $1,200 | $0.71 | 3d | 1 | 1.37mi |
| 229 James St Unit 228 Dayton, OH | 3.0 | 1.0 | 1700 | $1,200 | $0.71 | 23d | 1 | 1.37mi |
Listing history 20 events
-
2026-06-18days on market $75,000 Active 242 DOM
-
2026-06-17days on market $75,000 Active 241 DOM
-
2026-06-16days on market $75,000 Active 240 DOM
-
2026-06-15days on market $75,000 Active 239 DOM
-
2026-06-14days on market $75,000 Active 237 DOM
-
2026-06-13days on market $75,000 Active 236 DOM
-
2026-06-10days on market $75,000 Active 234 DOM
-
2026-06-09days on market $75,000 Active 233 DOM
-
2026-06-08days on market $75,000 Active 232 DOM
-
2026-06-07days on market $75,000 Active 231 DOM
-
2026-06-05days on market $75,000 Active 228 DOM
-
2026-06-03days on market $75,000 Active 227 DOM
-
2026-06-02days on market $75,000 Active 226 DOM
-
2026-06-01days on market $75,000 Active 225 DOM
-
2026-05-31days on market $75,000 Active 224 DOM
-
2026-04-29status Active 336-char remark
Show marketing remark (336 chars)
Single family home located on the corner of Brenner Ave. Currently rented. Also being offered with a commercial residential portfolio. This house can be sold separately or included in the portfolio sale that includes the vacant storage lot next door, the vacant house and commercial warehouse across the street. Call agent for more info
-
2025-11-19historical ActiveUnderContract 336-char remark
Show marketing remark (336 chars)
Single family home located on the corner of Brenner Ave. Currently rented. Also being offered with a commercial residential portfolio. This house can be sold separately or included in the portfolio sale that includes the vacant storage lot next door, the vacant house and commercial warehouse across the street. Call agent for more info
-
2025-10-18$75,000 Active 336-char remark
Show marketing remark (336 chars)
Single family home located on the corner of Brenner Ave. Currently rented. Also being offered with a commercial residential portfolio. This house can be sold separately or included in the portfolio sale that includes the vacant storage lot next door, the vacant house and commercial warehouse across the street. Call agent for more info
-
2011-04-28historical
-
2011-03-23
ⓘ Source: listings_history table (triggers on properties + properties_extension) + one-shot
backfill from property_details.listing_events for pre-trigger history.
Tax reassessment forecast OH · Partial reset (capped growth)
- Current annual tax
- $422 · $35/mo
- Projected year-2 tax
- $796 · $66/mo
- Expected delta
- +$374/yr (+$31/mo · 88.7%)
ⓘ Screening estimate from a state-policy table — verify with the county assessor before closing.
Climate risk First Street
- Flood 6/10 Major FEMA zone X (unshaded) · 75% chance over 30 yrs
- Wildfire 1/10 Low
- Heat 4/10 Moderate 7 d/yr ≥101°F today · 18 d/yr by 30 yrs out
- Wind 2/10 Low
- Air quality 3/10 Moderate 2 unhealthy d/yr today · 4 by 30 yrs out
Nearby sold comps map
Loading sold comps map…
Walkable amenities ~0.75 mi
Loading nearby amenities…
Taxation est. · year 1
- Rental income
- $13,649
- − Mortgage interest
- −$4,201
- − Property taxes
- −$422
- − Insurance
- −$375
- − Repairs & maintenance
- −$1,092
- − Management
- −$1,092
- − Depreciation
- −$2,182
- Taxable income
- $4,286
- Est. tax owed @ 24.0%
- −$1,029
- After-tax cash flow
- $4,238/yr
For passive investors: Depreciation is non-cash, so a rental often shows a tax loss while cash-flowing — sheltering income. Rental losses are passive: they offset passive income freely, and up to $25,000/yr can offset ordinary (W-2) income if you actively participate and your MAGI is under $100k (phasing out to $0 by $150k); unused losses carry forward. On sale, claimed depreciation is recaptured at up to 25%, and gains may owe capital-gains tax (a 1031 exchange can defer both). Figures are a year-1 estimate at your 24.0% rate — not tax advice; consult a CPA.
Schools (NCES district)
- District
- Dayton City
- NCES district ID
- 3904384
- Math proficiency
- 12% ▼ -12.00%
- Reading proficiency
- 21% ▼ -11.00%
- Median HH income
- $28,688
- Composite
- 12.94/100
- National rank
- #9579
- State rank
- #641 of 656 in OH
Livability — Dayton
- Score
- 65/100
- State rank
- #716
- US rank
- #12895
Category grades
Schools grade is shown separately in the Schools card above.
Census & demographics
- Census place
- Dayton, OH
- County
- Montgomery County · 459,541 people
- City population
- 164,387
- Metro
- Dayton-Kettering, OH
- Population (ZIP)
- 13,608
- Household income
- $38,323
- Rent vs Own
- Severe rent burden
- 1071.0
Population outlook (Montgomery County) Hauer SSP2
- Today (2025)
- 523,241 people
- By 2030
- 514,948 · -1.6%
- By 2040
- 493,378 · -5.7%
- By 2050
- 469,639 · -10.2%
- By 2075
- 418,360 · -20.0%
- By 2100
- 353,315 · -32.5%
Race, ethnicity, and origin ACS 2023
- Neighborhood character
- Predominantly White (66%)
- Race & ethnicity
- White 66% Hispanic / Latino 15% Black 14% Two or more races 8% Native American 1%
- Hispanic origin (detail)
- Mexican 7%
- Common ancestry
- Lithuanian 2% Slovak 1% Italian 1%
- Foreign-born
- 9% · Canada
- Languages at home
- 84% English-only · Spanish 13% Other Asian/Pacific 1%
Political lean MEDSL · Montgomery
- 2024 margin
- Toss-up / Even · D 49.8% · R 49.3%
- 2008→2024 swing
- -5.8pp toward R · 2008: 6.2pp · 2024: 0.5pp
- All cycles
- 2024: D+0.5 2020: D+2.2 2016: R+1.2 2012: D+3.1 2008: D+6.2
Not yet ingested
- Civics
- —
Market trends
- HPI YoY
- ▼ -17.40%
- Current HPI
- 447.4034
- Rent YoY
- ▲ 3.71%
- Metro
- Dayton-Kettering, OH
- State GDP YoY
- ▲ 1.98%
- F500 in state
- 48
Industry mix (Fortune 500 HQ in OH)
| Industry | F500 HQs | Revenue |
|---|---|---|
| Insurance | 3 | $145B |
|
||
| Industrial Machinery | 3 | $49B |
|
||
| Financial Services | 3 | $24B |
|
||
| Consumer Goods | 2 | $93B |
|
||
| Aerospace / Defense | 2 | $47B |
|
||
| Utilities | 2 | $33B |
|
||
Price history
5 events — show timeline
- 2026-04-29 Relisted — Dayton MLS
- 2025-11-19 Contingent — Dayton MLS
- 2025-10-18 Listed $75,000 Dayton MLS
- 2011-04-28 Listing Removed — Dayton MLS
- 2011-03-23 Listed — Dayton MLS
Property tax history
-4.1%/yrLatest (2025): $422 · -0.2% YoY. Source: county tax records.
Cash-flow waterfall
monthlySold comps — $/sqft
last 12 mo · ≤1 miLoading sold comps…