 Multi-family
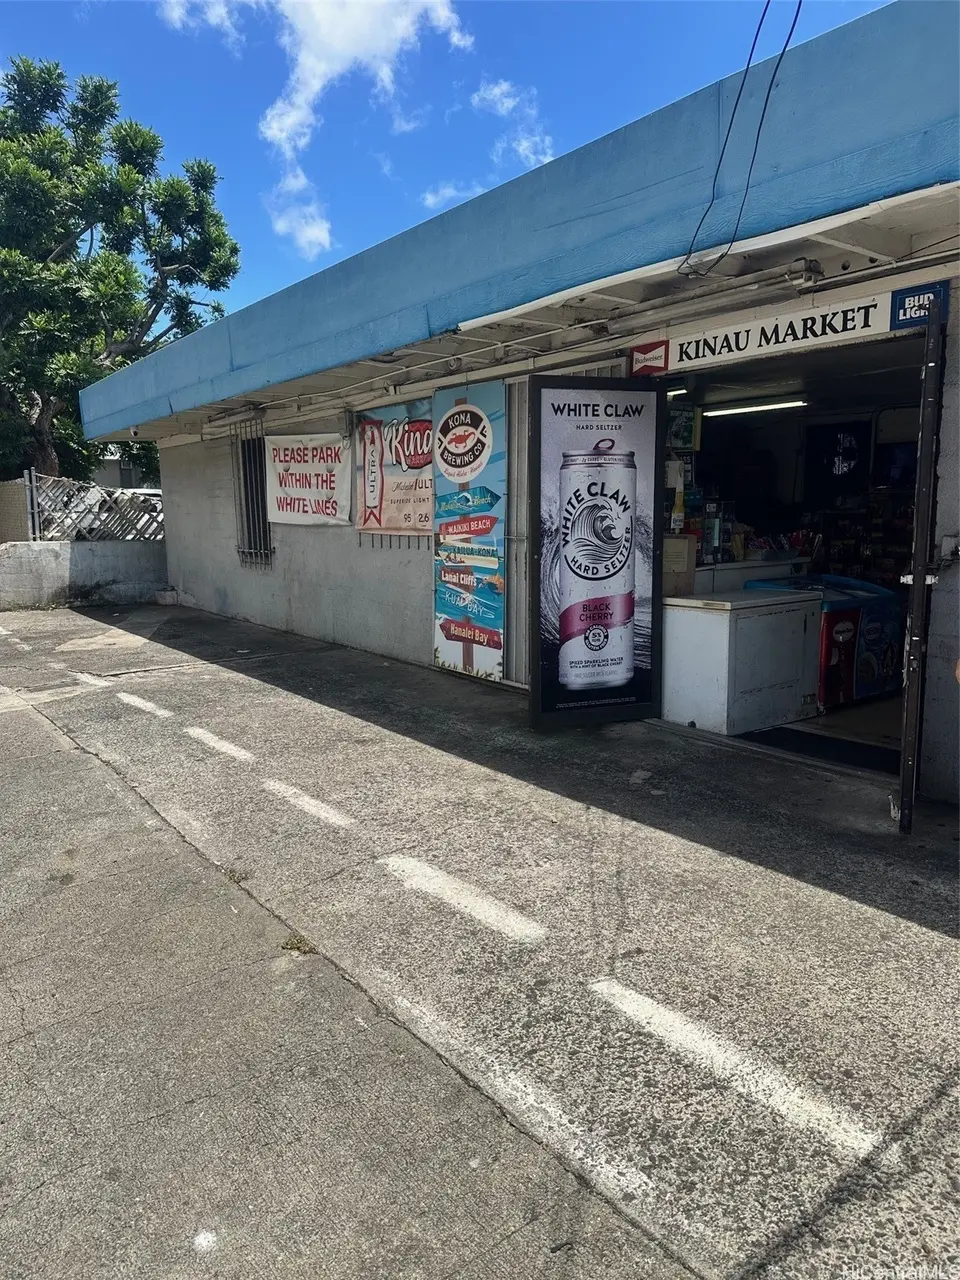
729 Kinau St · Urban Honolulu, HI
Flood risk 1/10 · Minimal
- FEMA flood zone
- X (unshaded)
- Chance of flooding over 30 yrs
- 0.0%
- Est. flood insurance / yr
- $473 – $860
Fire risk No data
- Est. fire insurance / yr
- —
Heat risk No data
- Hot days now (above threshold)
- —
- Hot days in 30 yrs
- —
Wind risk No data
- Chance of severe wind over 30 yrs
- —
Air-quality risk 1/10 · Minimal
- Unhealthy air days now
- —
- Unhealthy air days in 30 yrs
- —
Risk factors via First Street. Map © Google.
Why this score? — see what drove the B- grade
The composite is a weighted blend of 9 inputs, each scored 0–100. Each bar is that input's sub-score; the figure is the points it added to the 100-point composite (weight × sub-score).
- Cash flow +30.0/30.0
- 1% rule +10.0/10.0
- DSCR +10.0/10.0
- Appreciation +4.6/10.0
- Schools +3.7/10.0
- Rent growth +2.7/5.0
- Livability +2.5/5.0
- Condition / age +2.5/5.0
- ARV discount +0.0/15.0
$2,375,000
🖨 Deal sheet 📄 Offer letter ✓ Due diligence
Multi-family units
County records classify this as Multi-Family (2-4 Unit). Listing-text estimate: 1 unit. estimate disagrees with records
Listing remarks MLS
Rare Investment Opportunity! A 24-Room Apartment Building+ Liquor Store. Here’s your chance to own a high-demand, income-generating property in a high traffic count area in the heart of Central Oahu. This two-story apartment complex features 24 rentable Studio /rooms, designed for maximum occupancy and ideal for use as a boarding house or workforce housing. Each of the two floor includes shared cooking areas and two bathrooms, keeping operating costs low and rental flexibility high. What truly sets this property apart is the standalone liquor retail store located at the front of the lot—a built-in revenue stream with high visibility and foot traffic. Steps away from bus stops, making transportation easy for tenants and customers. Close proximity to hospitals and medical offices, schools, and major shopping centers. High-traffic area with strong rental demand and commercial visibility. Whether you're an investor looking to maximize cash flow or a business owner seeking mixed-use potential, this unique property delivers.
Key facts
- Strong rental demand
- Two bathrooms
- 24 room apartment
Tags
Neighborhood map
What this means for you Summary
Snapshot
- This is a 10-bed/2.0-bath multifamily listed at $2.38M.
Deal economics
- At list price, monthly cash flow is $49k ($584k/yr) — positive.
- The deal already cash-flows at list — no discount required.
- Meets the 1% rule at list price ($81k rent vs $2.38M).
- Recommended offer: $2.30M (3.0% below list) — sets the bar for market timing.
- Cap rate 30.9% vs local median 1.5% in Urban Honolulu — top-decile yield for the area; either an underpriced asset or a hidden risk that comps aren't pricing in. Stress-test before assuming the spread holds.
Location & tenants
- Location reads: area grade B — affects rentability + tenant quality, not the cash-flow math above.
- Hawaii Department Of Education (suburban): math 32% / reading 50% proficiency, ranked #1 of 1 in HI (top 100%) — families likely to look elsewhere, expect single-tenant / working-renter base with shorter leases.
- Market conditions: Rents flat; 198 active listings in the ZIP; solid renter incomes; 1,638 units permitted in Honolulu County in 2024 (793 in 5+ unit buildings).
- At $81,041/mo this rent would consume 1061% of the median local household income ($92k/yr) (locally 1338% of renters already pay >50% of income on rent) — very limited rent-growth headroom before tenants either downsize or default.
Forward outlook
- Local home prices are declining (-0.7%/yr); year-one equity from $16k of loan paydown is wiped out by about $17k of value loss. Plan a longer hold.
- Honolulu County population projected at +17% by 2050 — long-run rental-demand tailwind backs the buy-and-hold thesis.
- At projected returns (-0.7% appreciation + 0.6% rent growth), your $665k cash investment doubles in ~2 years — after that, you're playing with house money.
Negotiation context
- It's been on market 47 days — a 3% lower offer ($2.30M) is reasonable based on typical stale-listing flexibility.
- 11 sale attempts since 22y ago with the ask held roughly flat each time — persistent listings suggest the price (not the market) is what's stuck; bring a comps-based counter.
- Current owner paid $800k; list at $2.38M implies a 197% gain — meaningful room to come down on a strong offer.
Risks & watch-outs
- Watch-outs: built in 1948 — expect roof / HVAC / electrical / plumbing capex.
Questions for the listing agent
- It's been on market 47 days. Have you received any prior offers? Is the seller open to a 3% concession, seller financing, or rate buy-down credit?
- Built in 1948 — when were the roof, HVAC, electrical panel, plumbing, and water heater last replaced?
- Is there a deadline driving the sale (1031 exchange, divorce, estate, relocation)? That informs how much negotiation room exists.
- What's the average days-on-market for RENTAL listings here right now (not sales)? A rising rental-DOM trend means longer vacancies and softer asking-rent achievability than the comps imply.
- What's the recent tenant-quality profile in this submarket — average credit score on applications, eviction rate, late-payment / NSF rate, and stable-employment percentage? A property-management company in the area should have these aggregated.
- How much new apartment / multifamily construction is in the pipeline within 1–3 miles? Heavy new supply (>2% of stock underway) typically softens rents 12–24 months out; light construction supports rent growth.
Investment metrics
- 1% rule
- 3.41% ✓
- Cap rate
- 30.86%
- Cash-on-cash
- 87.76%
- DSCR
- 4.90
- GRM
- 2.4
CMA / ARV
- ARV (median comp)
- $2,014,269
- List price
- $2,375,000
- Delta
- 17.91%
- Verdict
- OVERPRICED
- Comps
- 8 within 1.0 mi
Projected returns pro-forma
-0.73% appreciation · 0.63% rent growth · sell at horizon
- IRR
- 87.1%
- Equity multiple
- 5.15×
- Total profit
- $2,759,569
- Equity at exit
- $604,392
- IRR
- 88.4%
- Equity multiple
- 9.84×
- Total profit
- $5,878,976
- Equity at exit
- $661,553
Cash invested: $665,000 (down + closing). Projections, not guarantees.
Landlord ↔ Tenant lean methodology
- Overall (STATE)
- 37 Tenant-Leaning
- State Hawaii
- 37 Tenant-Leaning · D+13
- County
- — inherits STATE
- City
- — inherits STATE
ZIP-level market 96813
- Home prices YoY
- -0.3%
- Rents YoY
- 0.6%
- Active inventory
- 198
- Price-to-rent
- 58.6×
Monthly cashflow live
- Estimated rent
- $81,041 high interval (Pro) →
- Mortgage (P&I)
- −$12,455
- Tax from tax record
- −$1,947 /mo · $23,359/yr
- Insurance
- −$990
- HOA
- −$0
- Vacancy / Maint / Mgmt
- −$17,019
- Net cashflow
- $48,631
Break-even live
24-unit breakdown (identical units grouped — click to expand)
| Units | Beds | Baths | Est. rent |
|---|---|---|---|
| 24× units | 0 | 1 | $81,048 |
| #1 | 0 | 1 | $3,377 |
| #2 | 0 | 1 | $3,377 |
| #3 | 0 | 1 | $3,377 |
| #4 | 0 | 1 | $3,377 |
| #5 | 0 | 1 | $3,377 |
| #6 | 0 | 1 | $3,377 |
| #7 | 0 | 1 | $3,377 |
| #8 | 0 | 1 | $3,377 |
| #9 | 0 | 1 | $3,377 |
| #10 | 0 | 1 | $3,377 |
| #11 | 0 | 1 | $3,377 |
| #12 | 0 | 1 | $3,377 |
| #13 | 0 | 1 | $3,377 |
| #14 | 0 | 1 | $3,377 |
| #15 | 0 | 1 | $3,377 |
| #16 | 0 | 1 | $3,377 |
| #17 | 0 | 1 | $3,377 |
| #18 | 0 | 1 | $3,377 |
| #19 | 0 | 1 | $3,377 |
| #20 | 0 | 1 | $3,377 |
| #21 | 0 | 1 | $3,377 |
| #22 | 0 | 1 | $3,377 |
| #23 | 0 | 1 | $3,377 |
| #24 | 0 | 1 | $3,377 |
| Total (24 units) | $81,041 | ||
UW: 25.0% down · 7.5% · 30yr · 1.5% tax · 5.0% vac · 8.0% maint · 8.0% mgmt
Financing live
Cash to close
- Down payment
- $593,750
- Closing costs
- $71,250
- Reserves months
- —
- Total cash needed
- —
Loan-product check · same deal, 3 products live
Conventional
25% down · 7.5% · 30yr
- Down + closing
- —
- Monthly P&I
- —
- Monthly cashflow
- —
- DSCR
- —
- Eligible?
- —
Personal DTI + credit; lowest rate.
DSCR
20% down · 8.5% · 30yr
- Down + closing
- —
- Monthly P&I
- —
- Monthly cashflow
- —
- DSCR
- —
- Eligible?
- —
No personal income docs; deal must DSCR.
Hard money
10% down · 12.0% · 12mo
- Down + closing
- —
- Monthly P&I
- —
- Monthly cashflow
- —
- DSCR
- —
- Eligible?
- —
Short-term bridge; refi at stabilization.
Listing history 41 events
-
2026-06-18days on market $2,375,000 Active 47 DOM
-
2026-06-17days on market $2,375,000 Active 46 DOM
-
2026-06-16days on market $2,375,000 Active 45 DOM
-
2026-06-15days on market $2,375,000 Active 44 DOM
-
2026-06-13days on market $2,375,000 Active 42 DOM
-
2026-06-13days on market $2,375,000 Active 41 DOM
-
2026-06-10days on market $2,375,000 Active 39 DOM
-
2026-06-09days on market $2,375,000 Active 38 DOM
-
2026-06-08days on market $2,375,000 Active 37 DOM
-
2026-06-07days on market $2,375,000 Active 36 DOM
-
2026-06-05days on market $2,375,000 Active 33 DOM
-
2026-06-03days on market $2,375,000 Active 32 DOM
-
2026-06-02days on market $2,375,000 Active 31 DOM
-
2026-06-01days on market $2,375,000 Active 30 DOM
-
2026-05-31days on market $2,375,000 Active 29 DOM
-
2026-05-01$2,375,000 Active 1047-char remark
Show marketing remark (1047 chars)
Rare Investment Opportunity! A 24-Room Apartment Building+ Liquor Store. Here’s your chance to own a high-demand, income-generating property in a high traffic count area in the heart of Central Oahu. This two-story apartment complex features 24 rentable Studio /rooms, designed for maximum occupancy and ideal for use as a boarding house or workforce housing. Each of the two floor includes shared cooking areas and two bathrooms, keeping operating costs low and rental flexibility high. What truly sets this property apart is the standalone liquor retail store located at the front of the lot—a built-in revenue stream with high visibility and foot traffic. Steps away from bus stops, making transportation easy for tenants and customers. Close proximity to hospitals and medical offices, schools, and major shopping centers. High-traffic area with strong rental demand and commercial visibility. Whether you're an investor looking to maximize cash flow or a business owner seeking mixed-use potential, this unique property delivers.
-
2026-04-04historical
-
2025-11-15status Active
-
2025-10-08status Pending
-
2025-06-12$2,400,000 Active
-
2022-08-10historical
-
2022-07-13$2,199,500 Active
-
2022-07-05historical
-
2022-05-31$2,195,000 Active
-
2022-05-16historical
-
2022-03-08$2,195,000 Active
-
2020-12-26historical
-
2020-06-26$2,195,000 Active
-
2020-05-02historical
-
2019-12-02$2,195,000 Active
-
2019-11-16historical
-
2019-11-04$2,199,000 Active
-
2016-10-12historical
-
2016-06-01$1,999,000 Active
-
2005-06-28soldstatus $800,000
-
2004-06-29historical
-
2004-04-28$1,000,000
-
2001-04-09soldstatus $405,000
-
2000-10-26soldstatus $430,000
-
1987-10-01soldstatus $380,000
-
1980-03-01soldstatus $58,400
ⓘ Source: listings_history table (triggers on properties + properties_extension) + one-shot
backfill from property_details.listing_events for pre-trigger history.
Tax reassessment forecast HI · Partial reset (capped growth)
- Current annual tax
- $23,359 · $1,947/mo
- Projected year-2 tax
- $23,359 · $1,947/mo
- Expected delta
- $0/yr ($0/mo · 0.0%)
ⓘ Screening estimate from a state-policy table — verify with the county assessor before closing.
Climate risk First Street
- Flood 1/10 Low FEMA zone X (unshaded) · 0% chance over 30 yrs
- Air quality 1/10 Low
Nearby sold comps map
Loading sold comps map…
Walkable amenities ~0.75 mi
Loading nearby amenities…
Taxation est. · year 1
- Rental income
- $972,492
- − Mortgage interest
- −$133,037
- − Property taxes
- −$23,359
- − Insurance
- −$11,875
- − Repairs & maintenance
- −$77,799
- − Management
- −$77,799
- − Depreciation
- −$69,091
- Taxable income
- $579,531
- Est. tax owed @ 24.0%
- −$139,088
- After-tax cash flow
- $444,490/yr
For passive investors: Depreciation is non-cash, so a rental often shows a tax loss while cash-flowing — sheltering income. Rental losses are passive: they offset passive income freely, and up to $25,000/yr can offset ordinary (W-2) income if you actively participate and your MAGI is under $100k (phasing out to $0 by $150k); unused losses carry forward. On sale, claimed depreciation is recaptured at up to 25%, and gains may owe capital-gains tax (a 1031 exchange can defer both). Figures are a year-1 estimate at your 24.0% rate — not tax advice; consult a CPA.
Schools (NCES district)
- District
- Hawaii Department Of Education
- NCES district ID
- 1500030
- Math proficiency
- 32% ▼ -10.00%
- Reading proficiency
- 50% ▼ -3.00%
- Median HH income
- $69,005
- Composite
- 37.07/100
- National rank
- #4504
- State rank
- #1 of 1 in HI
Livability — Urban Honolulu
No livability data for this city. (Only ~50 U.S. cities are tracked.)
Census & demographics
- Census place
- Urban Honolulu, HI
- County
- Honolulu County · 963,448 people
- City population
- 309,956
- Metro
- Urban Honolulu, HI
- Population (ZIP)
- 26,766
- Household income
- $91,690
- Rent vs Own
- Severe rent burden
- 1338.0
Population outlook (Honolulu County) Hauer SSP2
- Today (2025)
- 1,072,641 people
- By 2030
- 1,110,460 · +3.5%
- By 2040
- 1,181,593 · +10.2%
- By 2050
- 1,257,584 · +17.2%
- By 2075
- 1,501,120 · +39.9%
- By 2100
- 1,764,430 · +64.5%
Race, ethnicity, and origin ACS 2023
- Neighborhood character
- Highly diverse neighborhood (Simpson 0.74)
- Race & ethnicity
- Asian 48% Two or more races 21% White 15% Pacific Islander 9% Hispanic / Latino 7% Black 3%
- Hispanic origin (detail)
- Mexican 3% Puerto Rican 3%
- Common ancestry
- Russian 2% Romanian 1% Lithuanian 1%
- Foreign-born
- 23% · South Korea, China, Vietnam
- Languages at home
- 72% English-only · Other Asian/Pacific 10% Chinese 7% Korean 5%
Political lean MEDSL · Honolulu
- 2024 margin
- Strong D (+21.6) · D 59.9% · R 38.3% · Other 1.8%
- 2008→2024 swing
- -19.4pp toward R · 2008: 41.1pp · 2024: 21.6pp
- All cycles
- 2024: D+21.6 2020: D+26.9 2016: D+29.9 2012: D+39.1 2008: D+41.1
Not yet ingested
- Civics
- —
Market trends
- HPI YoY
- ▼ -0.73%
- Current HPI
- 231.8414
- Rent YoY
- ▲ 0.63%
- Metro
- Urban Honolulu, HI
- State GDP YoY
- —
- F500 in state
- 0
Price history
+3966.8% since first listed26 events — show timeline
- 2026-05-01 Listed $2,375,000 HiCentral MLS
- 2026-04-04 Listing Removed — HiCentral MLS
- 2025-11-15 Relisted — HiCentral MLS
- 2025-10-08 Pending — HiCentral MLS
- 2025-06-12 Listed $2,400,000 HiCentral MLS
- 2022-08-10 Listing Removed — HiCentral MLS
- 2022-07-13 Listed $2,199,500 HiCentral MLS
- 2022-07-05 Listing Removed — HiCentral MLS
- 2022-05-31 Listed $2,195,000 HiCentral MLS
- 2022-05-16 Listing Removed — HiCentral MLS
- 2022-03-08 Listed $2,195,000 HiCentral MLS
- 2020-12-26 Listing Removed — HiCentral MLS
- 2020-06-26 Listed $2,195,000 HiCentral MLS
- 2020-05-02 Listing Removed — HiCentral MLS
- 2019-12-02 Listed $2,195,000 HiCentral MLS
- 2019-11-16 Listing Removed — HiCentral MLS
- 2019-11-04 Listed $2,199,000 HiCentral MLS
- 2016-10-12 Listing Removed — HiCentral MLS
- 2016-06-01 Listed $1,999,000 HiCentral MLS
- 2005-06-28 Sold (Public Records) $800,000 Public Records
- 2004-06-29 Listing Removed — HiCentral MLS
- 2004-04-28 Listed $1,000,000 HiCentral MLS
- 2001-04-09 Sold (Public Records) $405,000 Public Records
- 2000-10-26 Sold (Public Records) $430,000 Public Records
- 1987-10-01 Sold (Public Records) $380,000 Public Records
- 1980-03-01 Sold (Public Records) $58,400 Public Records
Property tax history
+1.9%/yrLatest (2022): $23,359 · -0.6% YoY. Source: county tax records.
Cash-flow waterfall
monthlySold comps — $/sqft
last 12 mo · ≤1 miLoading sold comps…