4545 Hollywood Dr · Port Arthur, TX
Flood risk 8/10 · Major
- FEMA flood zone
- X (shaded)
- Chance of flooding over 30 yrs
- 0.6%
- Est. flood insurance / yr
- $507 – $1,088
Fire risk 1/10 · Minimal
- Est. fire insurance / yr
- $1,222 – $2,270
Heat risk 9/10 · Severe
- Hot days now (above 110°F)
- 7 days/yr
- Hot days in 30 yrs
- 24 days/yr
Wind risk 9/10 · Severe
- Chance of severe wind over 30 yrs
- 99.0%
Air-quality risk 2/10 · Minimal
- Unhealthy air days now
- 1 days/yr
- Unhealthy air days in 30 yrs
- 1 days/yr
Risk factors via First Street. Map © Google.
Why this score? — see what drove the B- grade
The composite is a weighted blend of 9 inputs, each scored 0–100. Each bar is that input's sub-score; the figure is the points it added to the 100-point composite (weight × sub-score).
- Cash flow +30.0/30.0
- 1% rule +10.0/10.0
- DSCR +10.0/10.0
- ARV discount +7.5/15.0
- Rent growth +5.0/5.0
- Livability +3.1/5.0
- Condition / age +2.5/5.0
- Schools +1.5/10.0
- Appreciation +0.0/10.0
$83,000
🖨 Deal sheet (PDF) 📄 Offer letter ✓ Due diligence
Listing remarks
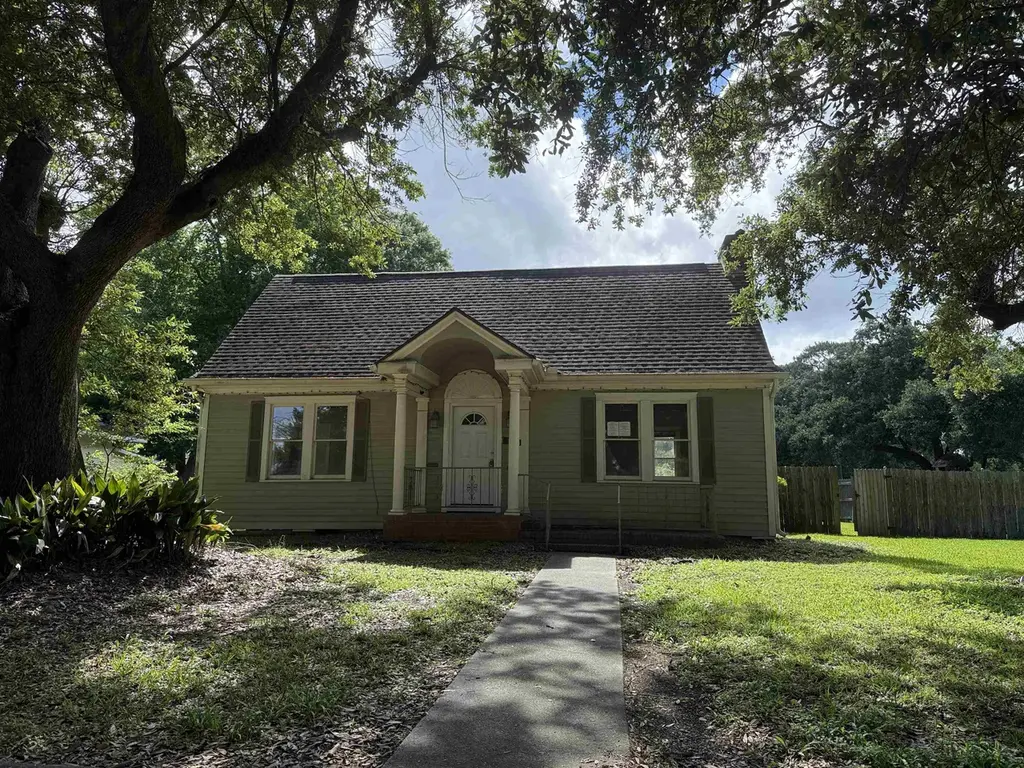
Step back in time and discover the charm of this character-filled home located at 4545 Hollywood in Port Arthur, Texas. Built in 1939 per county records, this three-bedroom, one-and-a-half-bath home showcases original hardwood floors, vintage glass doorknobs, and unique architectural details that are difficult to find in today's homes. Situated on a spacious 0.27-acre corner lot with approximate dimensions of 79' x 150', the property offers plenty of outdoor space for gardening, entertaining, or future improvements. Rich in history and personality, this home presents an excellent opportunity for buyers looking to restore and preserve a piece of the past. Property is being sold as-is, and th
Key facts
- Spacious corner lot
- 0.27 acre lot
- Listed 9 days
Tags
Property features AI
Exterior
- Utilities: Public water; Public sewer
- Home design: Single-family residence
- Construction: Residential property
- Exterior features: Corner lot
Interior
- Bathrooms: 1 full bathroom; 1 half bathroom
- Interior features: Corner lot location
Neighborhood map
What this means for you Summary
Snapshot
- This is a 3-bed/1.5-bath single-family listed at $83k.
Deal economics
- At list price, monthly cash flow is $293 ($4k/yr) — positive.
- The deal already cash-flows at list — no discount required.
- Meets the 1% rule at list price ($1k rent vs $83k).
- Cap rate 11.5% vs local median 5.0% in Port Arthur — top-decile yield for the area; either an underpriced asset or a hidden risk that comps aren't pricing in. Stress-test before assuming the spread holds.
Location & tenants
- Location reads 61/100 on livability (#1,014 in TX) — a middle-class / working-renter tenant base. Strengths: cost of living A+, housing A+; Watch: schools D-, crime F, amenities F.
- Port Arthur ISD (urban): math 15% / reading 22% proficiency, ranked #796 of 826 in TX (top 96%) — low school quality limits family demand, transient renter base, plan for 1-2y turnover; 80% free/reduced lunch — lower-income household profile, screen leases tightly.
- Market conditions: Rents rising fast (+14.4%/yr); 115 active listings in the ZIP; 7 comparable units currently listed for rent nearby; rentals at typical pace (median 25d on market — plan ~3-4 weeks tenant-placement turnaround); 43% of comp listings sitting > 30 days — soft ceiling on asking rent; lower-income renter base — watch delinquency; 343 units permitted in Jefferson County in 2024 (0 in 5+ unit buildings).
- This rent runs 41% of the median local income ($43k/yr) — at the standard rent-burdened threshold; future hikes will face affordability resistance.
Forward outlook
- Local home prices are declining (-3.0%/yr); year-one equity from $574 of loan paydown is wiped out by about $2k of value loss. Plan a longer hold.
- At projected returns (-3.0% appreciation + 8.0% rent growth), your $23k cash investment doubles in ~6 years — after that, you're playing with house money.
Negotiation context
- Only 9 days on market — expect competitive offers; lowballing is unlikely to land.
- 4 sale attempts since 9y ago with the ask held roughly flat each time — persistent listings suggest the price (not the market) is what's stuck; bring a comps-based counter.
Risks & watch-outs
- Watch-outs: property tax is 4.7% of price; flood insurance adds $66/mo; built in 1939 — expect roof / HVAC / electrical / plumbing capex.
- Climate carrying-cost: severe flood risk; severe wind risk, 99% chance of damaging wind over 30y; extreme-heat days projected 7→24/yr by 2055 (HVAC capex compounding) — expect insurance premiums to compound above CPI over the hold.
Questions for the listing agent
- Built in 1939 — when were the roof, HVAC, electrical panel, plumbing, and water heater last replaced?
- Property tax is high relative to price — has the assessment been appealed recently, and will the sale trigger a re-assessment?
- What's the actual annual flood-insurance premium (NFIP or private), and is the property in a SFHA with mandatory coverage?
- Is there a deadline driving the sale (1031 exchange, divorce, estate, relocation)? That informs how much negotiation room exists.
- Schools are D-rated, which usually means shorter tenancies and higher turnover. Who's the typical renter profile here, and what's been the actual vacancy rate?
- Crime grade is F in this area — have there been break-ins, vandalism, or insurance claims at this property in the last 3 years? What carrier currently insures it and at what premium?
- What's the average days-on-market for RENTAL listings here right now (not sales)? A rising rental-DOM trend means longer vacancies and softer asking-rent achievability than the comps imply.
- What's the recent tenant-quality profile in this submarket — average credit score on applications, eviction rate, late-payment / NSF rate, and stable-employment percentage? A property-management company in the area should have these aggregated.
- How much new for-sale + rental construction is in the pipeline within 1–3 miles? Heavy new supply typically softens prices + rents 12–24 months out; constrained supply supports both.
Investment metrics
- 1% rule
- 1.76% ✓
- Cap rate
- 11.50%
- Cash-on-cash
- 18.58%
- DSCR
- 1.83
- GRM
- 4.7
CMA / ARV
- ARV (on-the-fly)
- $180,648
- Comps found
- 7
Show comp detail 7 sales within ~0.75 mi
| Address | Dist | Beds/Ba | Sqft | Sold | Price | $/sf | Match |
|---|---|---|---|---|---|---|---|
| 5116 Woodlawn Dr | 0.50mi | 3/2.0 | 1,566 (+1%) | 0mo | $199,900 | $128 | 72 |
| 3537 Drexel Ave | 0.24mi | 3/2.0 | 1,590 (+3%) | 14mo | $104,900 | $66 | 70 |
| 3721 Avalon Ave | 0.64mi | 4/2.0 (+1) | 1,481 (-4%) | 3mo | $155,000 | $105 | 54 |
| 4612 Redbird St | 0.53mi | 3/2.0 | 1,647 (+7%) | 12mo | $193,500 | $117 | 52 |
| 3741 Avalon Ave | 0.65mi | 3/2.0 | 1,586 (+3%) | 14mo | $198,000 | $125 | 52 |
| 4614 Briarwood Ln | 0.62mi | 3/2.0 | 1,716 (+11%) | 15mo | $230,000 | $134 | 38 |
| 3829 Touraine Ave | 0.44mi | 4/2.5 (+1) | 1,752 (+14%) | 22mo | $185,000 | $106 | 30 |
Match score weights: distance 35% · size 25% · config 20% · recency 20%. Top-matched comps best support the ARV.
Projected returns pro-forma
-3.0% appreciation · 8.0% rent growth · sell at horizon
- IRR
- 13.1%
- Equity multiple
- 1.57×
- Total profit
- $13,143
- Equity at exit
- $12,376
- IRR
- 26.5%
- Equity multiple
- 4.07×
- Total profit
- $71,380
- Equity at exit
- $7,176
Cash invested: $23,240 (down + closing). Projections, not guarantees.
Landlord ↔ Tenant lean methodology
- Overall (STATE)
- 87 Strongly Landlord-Friendly
- State Texas
- 87 Strongly Landlord-Friendly · R+5
- County
- — inherits STATE
- City
- — inherits STATE
ZIP-level market 77642
- Rents YoY
- 14.4%
- Active inventory
- 115
- Price-to-rent
- 4.7×
Monthly cashflow live
- Estimated rent
- $1,458 high interval (Pro) →
- Mortgage (P&I)
- −$435
- Tax from tax record
- −$322 /mo · $3,864/yr
- Insurance
- −$35
- Flood insurance flood zone
- −$66 /mo · $798/yr
- HOA
- −$0
- Vacancy / Maint / Mgmt
- −$306
- Net cashflow
- $293
Break-even live
Sensitivity live
| Price | -10% $569 | -5% $317 | +0% $293 | +5% $270 | +10% $246 |
|---|---|---|---|---|---|
| Rent | -10% $178 | -5% $236 | +0% $293 | +5% $351 | +10% $409 |
| Rate | -1.0pp $335 | -0.5pp $315 | base $293 | +0.5pp $272 | +1.0pp $250 |
UW: 25.0% down · 7.5% · 30yr · 1.5% tax · 5.0% vac · 8.0% maint · 8.0% mgmt
Financing live
Cash to close
- Down payment
- $20,750
- Closing costs
- $2,490
- Reserves months
- —
- Total cash needed
- —
Loan-product check · same deal, 3 products live
Conventional
25% down · 7.5% · 30yr
- Down + closing
- —
- Monthly P&I
- —
- Monthly cashflow
- —
- DSCR
- —
- Eligible?
- —
Personal DTI + credit; lowest rate.
DSCR
20% down · 8.5% · 30yr
- Down + closing
- —
- Monthly P&I
- —
- Monthly cashflow
- —
- DSCR
- —
- Eligible?
- —
No personal income docs; deal must DSCR.
Hard money
10% down · 12.0% · 12mo
- Down + closing
- —
- Monthly P&I
- —
- Monthly cashflow
- —
- DSCR
- —
- Eligible?
- —
Short-term bridge; refi at stabilization.
Rent comps 7 comps
| Address | Beds | Baths | Sqft | Rent | $/sqft | DOM | Units | Dist |
|---|---|---|---|---|---|---|---|---|
| 5235 33rd St Unit 1 Groves, TX | 2.0 | 1.0 | 1400 | $1,400 | $1.00 | 15d | 1 | 0.61mi |
| 3141 Boyd Ave Groves, TX | 2.0 | 2.0 | 1200 | $1,375 | $1.15 | 45d | 1 | 0.89mi |
| 3738 7th Ave Port Arthur, TX | 4.0 | 2.0 | 1704 | $1,795 | $1.05 | 45d | 1 | 0.95mi |
| 5989 32nd St Groves, TX | 2.0 | 1.0 | 1074 | $1,400 | $1.30 | 15d | 1 | 1.14mi |
| 6110 Willis St Groves, TX | 2.0 | 1.0 | 1100 | $1,200 | $1.09 | 45d | 1 | 1.34mi |
| 5048 Kent Ave Groves, TX | 3.0 | 1.5 | 1351 | $1,650 | $1.22 | 15d | 1 | 1.36mi |
| 2510 Avenue A Port Arthur, TX | 2.0 | 2.0 | 1270 | $1,500 | $1.18 | 24d | 1 | 1.42mi |
Listing history 8 events
-
2026-06-18days on market $83,000 Active 9 DOM
-
2026-06-17days on market $83,000 Active 8 DOM
-
2026-06-16days on market $83,000 Active 7 DOM
-
2026-06-15days on market $83,000 Active 6 DOM
-
2026-06-14days on market $83,000 Active 4 DOM
-
2026-06-13days on market $83,000 Active 3 DOM
-
2026-06-10remarks 699-char remark
-
2026-06-10$83,000 Active 1 DOM
ⓘ Source: listings_history table (triggers on properties + properties_extension) + one-shot
backfill from property_details.listing_events for pre-trigger history.
Tax reassessment forecast TX · Resets to sale price
- Current annual tax
- $3,864 · $322/mo
- Projected year-2 tax
- $3,864 · $322/mo
- Expected delta
- $0/yr ($0/mo · -0.0%)
ⓘ Screening estimate from a state-policy table — verify with the county assessor before closing.
Climate risk First Street
- Flood 8/10 Severe FEMA zone X (shaded) · 60% chance over 30 yrs
- Wildfire 1/10 Low
- Heat 9/10 Extreme 7 d/yr ≥110°F today · 24 d/yr by 30 yrs out
- Wind 9/10 Extreme 99% chance of damaging wind over 30 yrs
- Air quality 2/10 Low 1 unhealthy d/yr today · 1 by 30 yrs out
Nearby sold comps map
Loading sold comps map…
Walkable amenities ~0.75 mi
Loading nearby amenities…
Taxation est. · year 1
- Rental income
- $17,495
- − Mortgage interest
- −$4,649
- − Property taxes
- −$3,864
- − Insurance
- −$1,212
- − Repairs & maintenance
- −$1,400
- − Management
- −$1,400
- − Depreciation
- −$2,415
- Taxable income
- $2,556
- Est. tax owed @ 24.0%
- −$613
- After-tax cash flow
- $2,908/yr
For passive investors: Depreciation is non-cash, so a rental often shows a tax loss while cash-flowing — sheltering income. Rental losses are passive: they offset passive income freely, and up to $25,000/yr can offset ordinary (W-2) income if you actively participate and your MAGI is under $100k (phasing out to $0 by $150k); unused losses carry forward. On sale, claimed depreciation is recaptured at up to 25%, and gains may owe capital-gains tax (a 1031 exchange can defer both). Figures are a year-1 estimate at your 24.0% rate — not tax advice; consult a CPA.
Schools (NCES district)
- District
- Port Arthur ISD
- NCES district ID
- 4835400
- Math proficiency
- 15% ▼ -22.00%
- Reading proficiency
- 22% ▼ -10.00%
- Median HH income
- $31,795
- Composite
- 14.9/100
- National rank
- #9373
- State rank
- #796 of 826 in TX
Livability — Port Arthur
- Score
- 61/100
- State rank
- #1014
- US rank
- #18061
Category grades
Schools grade is shown separately in the Schools card above.
Census & demographics
- Census place
- Port Arthur, TX
- County
- Jefferson County · 203,592 people
- City population
- 38,358
- Metro
- Beaumont-Port Arthur, TX
- Population (ZIP)
- 38,358
- Household income
- $42,950
- Rent vs Own
- Severe rent burden
- 1775.0
Population outlook (Jefferson County) Hauer SSP2
- Today (2025)
- 259,015 people
- By 2030
- 260,685 · +0.6%
- By 2040
- 263,309 · +1.7%
- By 2050
- 265,237 · +2.4%
- By 2075
- 270,193 · +4.3%
- By 2100
- 255,628 · -1.3%
Race, ethnicity, and origin ACS 2023
- Neighborhood character
- Diverse neighborhood (Simpson 0.66)
- Race & ethnicity
- Hispanic / Latino 42% Black 37% Two or more races 18% White 12% Asian 7% Native American 1%
- Hispanic origin (detail)
- Mexican 35% Cuban 1%
- Common ancestry
- Lithuanian 2% European 1%
- Foreign-born
- 25% · Canada, Vietnam
- Languages at home
- 56% English-only · Spanish 37% Vietnamese 4% Other Indo-European 1%
Political lean MEDSL · Jefferson
- 2024 margin
- Lean R (+8.9) · D 45.1% · R 54.0%
- 2008→2024 swing
- -11.1pp toward R · 2008: 2.2pp · 2024: -8.9pp
- All cycles
- 2024: R+8.9 2020: R+1.6 2016: R+0.5 2012: D+1.6 2008: D+2.2
Not yet ingested
- Civics
- —
Market trends
- HPI YoY
- ▼ -86.58%
- Current HPI
- 152.1615
- Rent YoY
- ▲ 14.42%
- Metro
- Beaumont-Port Arthur, TX
- State GDP YoY
- ▲ 3.95%
- F500 in state
- 110
Industry mix (Fortune 500 HQ in TX)
| Industry | F500 HQs | Revenue |
|---|---|---|
| Energy | 16 | $1,198B |
|
||
| Technology | 5 | $198B |
|
||
| Engineering / Construction | 4 | $72B |
|
||
| Energy Services | 3 | $60B |
|
||
| Utilities | 3 | $41B |
|
||
| Healthcare | 2 | $330B |
|
||
Price history
-1.8% since first listed15 events — show timeline
- 2026-06-09 Listed $83,000 BBOR
- 2025-11-09 Pending — HARMLS
- 2025-11-03 Pending — HARMLS
- 2025-11-03 Listing Removed — HARMLS
- 2025-10-30 Price Changed $95,900 BBOR
- 2025-10-30 Price Changed $95,900 HARMLS
- 2025-09-24 Relisted — HARMLS
- 2025-07-11 Listing Removed — HARMLS
- 2025-06-30 Price Changed $125,000 BBOR
- 2025-06-30 Price Changed $125,000 HARMLS
- 2025-06-23 Listed $129,500 HARMLS
- 2025-05-28 Price Changed $129,500 BBOR
- 2017-09-18 Sold (Public Records) — Public Records
- 2017-08-31 Sold (MLS) — BBOR
- 2017-07-31 Listed $84,500 BBOR
Property tax history
+6.9%/yrLatest (2025): $3,864 · -1.7% YoY. Source: county tax records.
Cash-flow waterfall
monthlySold comps — $/sqft
last 12 mo · ≤1 miLoading sold comps…