48 Lane 2 · Warwick, RI
Flood risk 1/10 · Minimal
- FEMA flood zone
- X (unshaded)
- Chance of flooding over 30 yrs
- 0.0%
- Est. flood insurance / yr
- $473 – $860
Fire risk 1/10 · Minimal
- Est. fire insurance / yr
- $835 – $1,551
Heat risk 5/10 · Moderate
- Hot days now (above 96°F)
- 7 days/yr
- Hot days in 30 yrs
- 15 days/yr
Wind risk 6/10 · Moderate
- Chance of severe wind over 30 yrs
- 74.0%
Air-quality risk 2/10 · Minimal
- Unhealthy air days now
- 2 days/yr
- Unhealthy air days in 30 yrs
- 2 days/yr
Risk factors via First Street. Map © Google.
Why this score? — see what drove the B- grade
The composite is a weighted blend of 9 inputs, each scored 0–100. Each bar is that input's sub-score; the figure is the points it added to the 100-point composite (weight × sub-score).
- Cash flow +30.0/30.0
- 1% rule +10.0/10.0
- DSCR +10.0/10.0
- ARV discount +7.5/15.0
- Livability +3.9/5.0
- Rent growth +2.5/5.0
- Condition / age +2.5/5.0
- Schools +2.2/10.0
- Appreciation +0.0/10.0
$123,000
🖨 Deal sheet 📄 Offer letter ✓ Due diligence
Listing remarks
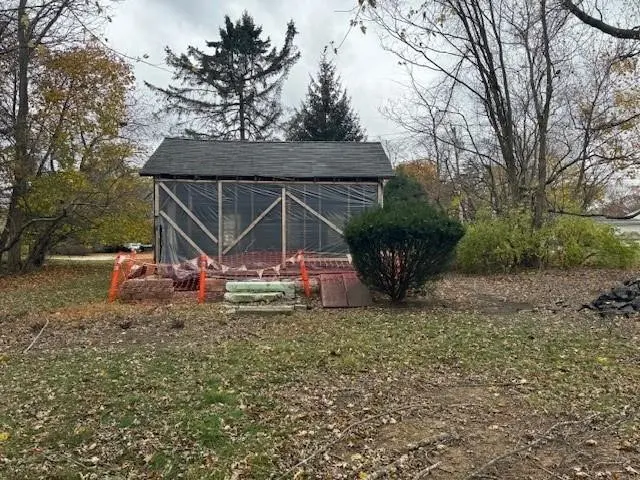
Investors and Contractors- looking for your next project? This property needs a complete renovation and offers an incredible opportunity, located in the charming Gaspee Point Community, steps from private beach access. The location of this property is fantastic. It's at the end of the street and has a great lot. It is minutes away from Pawtuxet Village with its amazing shops and restaurants. A true diamond in the rough. This property is being sold as-is/as seen and will not qualify for financing.
Key facts
- Great lot
- Complete renovation
- Private beach access
Tags
Property features AI
Finance
- Other: Assessed value listed (financial details excluded per instructions)
- HOA & community: Has land lease
Exterior
- Parking: No garage; Parking for 2 vehicles
- Utilities: Public water; Sewer connected
- Home design: Single-story house
- Construction: Stone foundation; Above-grade finished area approximately 621
- Exterior features: Wooded lot; Beach access, water access, and within walking distance to the water
Interior
- Kitchen: No hot water (appliance/equipment note)
- Bedrooms: Total of 4 rooms (bedrooms count not specified)
- Bathrooms: 1 full bathroom
- Heating & cooling: Electric heating
- Interior features: Crawl space basement (unfinished); Fixer condition
Neighborhood map
What this means for you Summary
Snapshot
- This is a 1-bed/1.0-bath single-family listed at $123k.
Deal economics
- At list price, monthly cash flow is $576 ($7k/yr) — positive.
- The deal already cash-flows at list — no discount required.
- Meets the 1% rule at list price ($2k rent vs $123k).
- Recommended offer: $121k (1.5% below list) — sets the bar for market timing.
- Cap rate 11.9% vs local median 3.7% in Warwick — top-decile yield for the area; either an underpriced asset or a hidden risk that comps aren't pricing in. Stress-test before assuming the spread holds.
Location & tenants
- Location reads 78/100 on livability (#6 in RI, #2,425 nationally) — a middle-class / working-renter tenant base. Strengths: crime A+, commute A+, housing A+; Watch: schools D+, amenities F.
- Warwick (urban): math 15% / reading 32% proficiency, ranked #25 of 39 in RI (top 64%) — low school quality limits family demand, transient renter base, plan for 1-2y turnover.
- Market conditions: 67 active listings in the ZIP; 4 comparable units currently listed for rent nearby; rentals at typical pace (median 24d on market — plan ~3-4 weeks tenant-placement turnaround); 471 units permitted in Kent County in 2024 (240 in 5+ unit buildings).
Forward outlook
- Local home prices are declining (-3.0%/yr); year-one equity from $850 of loan paydown is wiped out by about $4k of value loss. Plan a longer hold.
- Kent County population projected at -14% by 2050 — secular population decline; favor cash flow + early exit over multi-decade hold.
- At projected returns (-3.0% appreciation + 3.0% rent growth), your $34k cash investment doubles in ~7 years — after that, you're playing with house money.
Negotiation context
- It's been on market 30 days — a 2% lower offer ($121k) is reasonable based on typical stale-listing flexibility.
- 6 sale attempts since 5y ago with the ask held roughly flat each time — persistent listings suggest the price (not the market) is what's stuck; bring a comps-based counter.
- Current owner paid $50k; list at $123k implies a 146% gain — meaningful room to come down on a strong offer.
Risks & watch-outs
- Watch-outs: built in 1935 — expect roof / HVAC / electrical / plumbing capex.
- Climate carrying-cost: major wind risk, 74% chance of damaging wind over 30y; extreme-heat days projected 7→15/yr by 2055 (HVAC capex compounding) — expect insurance premiums to compound above CPI over the hold.
Questions for the listing agent
- Built in 1935 — when were the roof, HVAC, electrical panel, plumbing, and water heater last replaced?
- Is there a deadline driving the sale (1031 exchange, divorce, estate, relocation)? That informs how much negotiation room exists.
- Schools are D-rated, which usually means shorter tenancies and higher turnover. Who's the typical renter profile here, and what's been the actual vacancy rate?
- What's the average days-on-market for RENTAL listings here right now (not sales)? A rising rental-DOM trend means longer vacancies and softer asking-rent achievability than the comps imply.
- What's the recent tenant-quality profile in this submarket — average credit score on applications, eviction rate, late-payment / NSF rate, and stable-employment percentage? A property-management company in the area should have these aggregated.
- How much new for-sale + rental construction is in the pipeline within 1–3 miles? Heavy new supply typically softens prices + rents 12–24 months out; constrained supply supports both.
Investment metrics
- 1% rule
- 1.51% ✓
- Cap rate
- 11.91%
- Cash-on-cash
- 20.08%
- DSCR
- 1.89
- GRM
- 5.5
CMA / ARV
- ARV (median comp)
- $308,991
- List price
- $123,000
- Delta
- -57.93%
- Verdict
- UNDERPRICED
- Comps
- 8 within 1.0 mi
Show comp detail 3 sales within ~0.75 mi
| Address | Dist | Beds/Ba | Sqft | Sold | Price | $/sf | Match |
|---|---|---|---|---|---|---|---|
| 217 Namquid Dr | 0.26mi | 1/1.0 | 608 (-2%) | 16mo | $384,000 | $632 | 71 |
| 50 Lane 1 St | 0.09mi | 2/1.5 (+1) | 680 (+10%) | 10mo | $265,000 | $390 | 65 |
| 451 Namquid Dr | 0.27mi | 2/1.0 (+1) | 560 (-10%) | 15mo | $247,000 | $441 | 54 |
Match score weights: distance 35% · size 25% · config 20% · recency 20%. Top-matched comps best support the ARV.
Projected returns pro-forma
-3.0% appreciation · 3.0% rent growth · sell at horizon
- IRR
- 12.3%
- Equity multiple
- 1.49×
- Total profit
- $16,819
- Equity at exit
- $18,340
- IRR
- 21.2%
- Equity multiple
- 2.80×
- Total profit
- $62,108
- Equity at exit
- $10,635
Cash invested: $34,440 (down + closing). Projections, not guarantees.
Landlord ↔ Tenant lean methodology
- Overall (STATE)
- 31 Tenant-Leaning
- State Rhode Island
- 31 Tenant-Leaning · D+8
- County
- — inherits STATE
- City
- — inherits STATE
ZIP-level market 02888
- Active inventory
- 67
- Price-to-rent
- 5.5×
Monthly cashflow live
- Estimated rent
- $1,853 medium interval (Pro) →
- Mortgage (P&I)
- −$645
- Tax from tax record
- −$191 /mo · $2,296/yr
- Insurance
- −$51
- HOA
- −$0
- Vacancy / Maint / Mgmt
- −$389
- Net cashflow
- $576
Break-even live
UW: 25.0% down · 7.5% · 30yr · 1.5% tax · 5.0% vac · 8.0% maint · 8.0% mgmt
Financing live
Cash to close
- Down payment
- $30,750
- Closing costs
- $3,690
- Reserves months
- —
- Total cash needed
- —
Loan-product check · same deal, 3 products live
Conventional
25% down · 7.5% · 30yr
- Down + closing
- —
- Monthly P&I
- —
- Monthly cashflow
- —
- DSCR
- —
- Eligible?
- —
Personal DTI + credit; lowest rate.
DSCR
20% down · 8.5% · 30yr
- Down + closing
- —
- Monthly P&I
- —
- Monthly cashflow
- —
- DSCR
- —
- Eligible?
- —
No personal income docs; deal must DSCR.
Hard money
10% down · 12.0% · 12mo
- Down + closing
- —
- Monthly P&I
- —
- Monthly cashflow
- —
- DSCR
- —
- Eligible?
- —
Short-term bridge; refi at stabilization.
Rent comps 4 comps
| Address | Beds | Baths | Sqft | Rent | $/sqft | DOM | Units | Dist |
|---|---|---|---|---|---|---|---|---|
| 400 Narragansett Pkwy Warwick, RI | 2.0 | 1.0–1.5 | 776 | $2,348 | $3.03 | 23d | 2 | 0.69mi |
| 43 Eton Ave Warwick, RI | 1.0 | 1.0 | 500 | $1,575 | $3.15 | 4d | 1 | 1.17mi |
| 126 Washington St Unit 3 Warwick, RI | 1.0 | 1.0 | 408 | $1,500 | $3.68 | 17d | 1 | 1.26mi |
| 0 W Shore Rd Warwick, RI | 1.0 | 1.0 | 650 | $1,550 | $2.38 | 43d | 1 | 1.49mi |
Listing history 26 events
-
2026-06-18days on market $123,000 Active 30 DOM
-
2026-06-17days on market $123,000 Active 29 DOM
-
2026-06-16days on market $123,000 Active 28 DOM
-
2026-06-15days on market $123,000 Active 27 DOM
-
2026-06-13days on market $123,000 Active 25 DOM
-
2026-06-09days on market $123,000 Active 21 DOM
-
2026-06-08days on market $123,000 Active 20 DOM
-
2026-06-07days on market $123,000 Active 19 DOM
-
2026-06-03days on market $123,000 Active 15 DOM
-
2026-06-02days on market $123,000 Active 14 DOM
-
2026-06-01days on market $123,000 Active 13 DOM
-
2026-05-31days on market $123,000 Active 12 DOM
-
2026-05-19$123,000 Active 501-char remark
-
2026-05-11historical
-
2026-04-03$130,000 Active
-
2026-04-02historical
-
2026-03-13$130,000 Active
-
2026-03-13historical
-
2026-01-15price $140,000
-
2025-11-15$145,000 Active
-
2021-12-29soldstatus $50,000 Closed
-
2021-07-28status Pending
-
2021-07-07historical Active Under Contract
-
2021-07-06status Active
-
2021-07-06historical
-
2021-07-06$50,000 Active
ⓘ Source: listings_history table (triggers on properties + properties_extension) + one-shot
backfill from property_details.listing_events for pre-trigger history.
Tax reassessment forecast RI · Partial reset (capped growth)
- Current annual tax
- $2,296 · $191/mo
- Projected year-2 tax
- $2,296 · $191/mo
- Expected delta
- $0/yr ($0/mo · 0.0%)
ⓘ Screening estimate from a state-policy table — verify with the county assessor before closing.
Climate risk First Street
- Flood 1/10 Low FEMA zone X (unshaded) · 0% chance over 30 yrs
- Wildfire 1/10 Low
- Heat 5/10 Major 7 d/yr ≥96°F today · 15 d/yr by 30 yrs out
- Wind 6/10 Major 74% chance of damaging wind over 30 yrs
- Air quality 2/10 Low 2 unhealthy d/yr today · 2 by 30 yrs out
Nearby sold comps map
Loading sold comps map…
Walkable amenities ~0.75 mi
Loading nearby amenities…
Taxation est. · year 1
- Rental income
- $22,235
- − Mortgage interest
- −$6,890
- − Property taxes
- −$2,296
- − Insurance
- −$615
- − Repairs & maintenance
- −$1,779
- − Management
- −$1,779
- − Depreciation
- −$3,578
- Taxable income
- $5,298
- Est. tax owed @ 24.0%
- −$1,272
- After-tax cash flow
- $5,643/yr
For passive investors: Depreciation is non-cash, so a rental often shows a tax loss while cash-flowing — sheltering income. Rental losses are passive: they offset passive income freely, and up to $25,000/yr can offset ordinary (W-2) income if you actively participate and your MAGI is under $100k (phasing out to $0 by $150k); unused losses carry forward. On sale, claimed depreciation is recaptured at up to 25%, and gains may owe capital-gains tax (a 1031 exchange can defer both). Figures are a year-1 estimate at your 24.0% rate — not tax advice; consult a CPA.
Schools (NCES district)
- District
- Warwick
- NCES district ID
- 4401110
- Math proficiency
- 15% ▼ -11.00%
- Reading proficiency
- 32% ▼ -7.00%
- Median HH income
- $63,420
- Composite
- 22.03/100
- National rank
- #8203
- State rank
- #25 of 39 in RI
Livability — Warwick
- Score
- 78/100
- State rank
- #6
- US rank
- #2425
Category grades
Schools grade is shown separately in the Schools card above.
Census & demographics
- Census place
- Warwick, RI
- City population
- 108,434
- Population (ZIP)
- 18,951
Population outlook (Kent County) Hauer SSP2
- Today (2025)
- 160,994 people
- By 2030
- 157,428 · -2.2%
- By 2040
- 148,389 · -7.8%
- By 2050
- 137,995 · -14.3%
- By 2075
- 118,536 · -26.4%
- By 2100
- 102,266 · -36.5%
Race, ethnicity, and origin ACS 2023
- Neighborhood character
- Predominantly White (81%)
- Race & ethnicity
- White 81% Two or more races 7% Black 6% Hispanic / Latino 6% Asian 1%
- Hispanic origin (detail)
- Puerto Rican 2% Dominican 2%
- Common ancestry
- Russian 10% Lithuanian 6% Romanian 3%
- Foreign-born
- 7% · Canada
- Languages at home
- 91% English-only · Spanish 3% Other Indo-European 2% French/Haitian/Cajun 2%
Political lean MEDSL · Kent
- 2024 margin
- Toss-up / Even · D 49.9% · R 48.1% · Other 2.0%
- 2008→2024 swing
- -15.6pp toward R · 2008: 17.5pp · 2024: 1.9pp
- All cycles
- 2024: D+1.9 2020: D+7.6 2016: R+0.7 2012: D+18.4 2008: D+17.5
Not yet ingested
- Civics
- —
Market trends
- HPI YoY
- ▼ -570.87%
- Current HPI
- 371.5696
- Rent YoY
- —
- Metro
- —
- State GDP YoY
- ▲ 2.25%
- F500 in state
- 10
Industry mix (Fortune 500 HQ in RI)
| Industry | F500 HQs | Revenue |
|---|---|---|
| Healthcare | 1 | $373B |
|
||
| Food Distribution | 1 | $31B |
|
||
| Aerospace / Defense | 1 | $14B |
|
||
| Financial Services | 1 | $8B |
|
||
| Consumer Goods | 1 | $4B |
|
||
Price history
+146.0% since first listed14 events — show timeline
- 2026-05-19 Listed $123,000 RIS
- 2026-05-11 Listing Removed — RIS
- 2026-04-03 Listed $130,000 RIS
- 2026-04-02 Listing Removed — RIS
- 2026-03-13 Listing Removed — RIS
- 2026-03-13 Listed $130,000 RIS
- 2026-01-15 Price Changed $140,000 RIS
- 2025-11-15 Listed $145,000 RIS
- 2021-12-29 Sold (MLS) $50,000 RIS
- 2021-07-28 Pending — RIS
- 2021-07-07 Contingent — RIS
- 2021-07-06 Relisted — RIS
- 2021-07-06 Listing Removed — RIS
- 2021-07-06 Listed $50,000 RIS
Property tax history
+7.7%/yrLatest (2025): $2,296 · +80.5% YoY. Source: county tax records.
Cash-flow waterfall
monthlySold comps — $/sqft
last 12 mo · ≤1 miLoading sold comps…