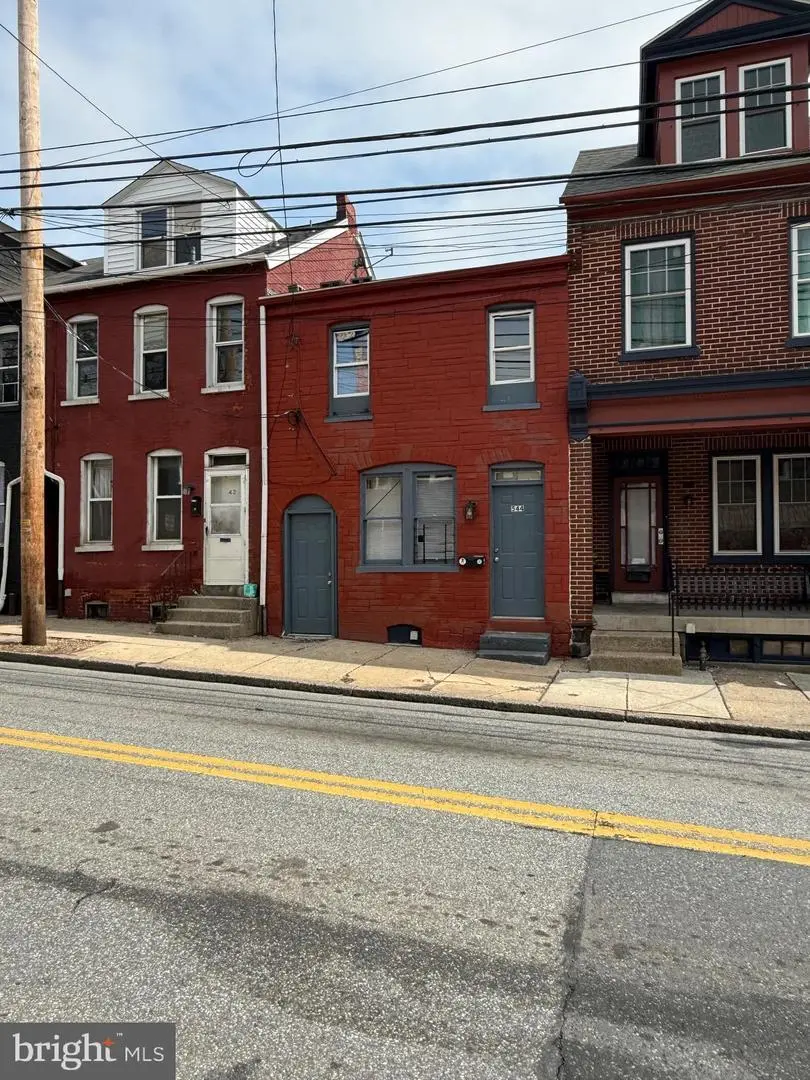
544 Manor St · Lancaster, PA
Flood risk 1/10 · Minimal
- FEMA flood zone
- X (unshaded)
- Chance of flooding over 30 yrs
- 0.0%
- Est. flood insurance / yr
- $473 – $860
Fire risk 1/10 · Minimal
- Est. fire insurance / yr
- $511 – $949
Heat risk 6/10 · Moderate
- Hot days now (above 101°F)
- 7 days/yr
- Hot days in 30 yrs
- 15 days/yr
Wind risk 4/10 · Minor
- Chance of severe wind over 30 yrs
- 16.0%
Air-quality risk 4/10 · Minor
- Unhealthy air days now
- 4 days/yr
- Unhealthy air days in 30 yrs
- 7 days/yr
Risk factors via First Street. Map © Google.
Why this score? — see what drove the C grade
The composite is a weighted blend of 9 inputs, each scored 0–100. Each bar is that input's sub-score; the figure is the points it added to the 100-point composite (weight × sub-score).
- Cash flow +21.9/30.0
- ARV discount +13.0/15.0
- DSCR +7.0/10.0
- 1% rule +5.3/10.0
- Livability +4.2/5.0
- Rent growth +2.6/5.0
- Condition / age +2.5/5.0
- Schools +1.6/10.0
- Appreciation +0.0/10.0
$150,000
🖨 Deal sheet (PDF) 📄 Offer letter ✓ Due diligence
Listing remarks MLS
Great investment opportunity located in SOWE neighborhood. Tenant occupied, current rent is below market value and lease is month to month. (Projected Market Rent $1,200). Ready for investor to add to rental portfolio. Two-bedroom, brick home with fenced in backyard, original hardwood floors and laundry hookup.
Key facts
- Built 1925
- Listed 70 days
Neighborhood map
What this means for you Summary
Snapshot
- This is a 2-bed/1.0-bath townhouse listed at $150k.
Deal economics
- At list price, monthly cash flow is $237 ($3k/yr) — positive.
- The deal already cash-flows at list — no discount required.
- Meets the 1% rule at list price ($2k rent vs $150k).
- Recommended offer: $141k (6.0% below list) — sets the bar for market timing.
- Cap rate 8.2% vs local median 4.0% in Lancaster — top-decile yield for the area; either an underpriced asset or a hidden risk that comps aren't pricing in. Stress-test before assuming the spread holds.
Location & tenants
- Location reads 85/100 on livability (#71 in PA, #498 nationally) — a professional / high-income tenant draw. Strengths: amenities A+, commute A+, cost of living A+; Watch: crime C-, employment C-.
- Lancaster SD (urban): math 12% / reading 25% proficiency, ranked #500 of 539 in PA (top 93%) — low school quality limits family demand, transient renter base, plan for 1-2y turnover; 72% free/reduced lunch — lower-income household profile, screen leases tightly.
- Zoned schools: Lafayette El Sch (math 12% / reading 22%, grade F, #1,307 of 1,518 statewide, top 86%, 427 students, 100% FRL); Wheatland Ms (math 4% / reading 26%, grade F, #471 of 512 statewide, top 93%, 445 students, 93% FRL); Mccaskey Campus (math 50% / reading 34%, grade F, #230 of 437 statewide, top 53%, 2,620 students, 88% FRL) — zoned schools average 94% FRL vs 72% district-wide (21 pts higher); higher-poverty schools than district average — tighter screening recommended.
- Market conditions: Rents flat; 296 active listings in the ZIP; 40 comparable units currently listed for rent nearby; rentals at typical pace (median 23d on market — plan ~3-4 weeks tenant-placement turnaround); solid renter incomes; 1,093 units permitted in Lancaster County in 2024 (201 in 5+ unit buildings).
Forward outlook
- Local home prices are declining (-3.0%/yr); year-one equity from $1k of loan paydown is wiped out by about $4k of value loss. Plan a longer hold.
- Lancaster County population projected at +5% by 2050 — modest demand growth; plan on rents tracking national, not racing it.
Negotiation context
- It's been on market 70 days — a 6% lower offer ($141k) is reasonable based on typical stale-listing flexibility.
- 5 sale attempts since 17y ago; this cycle's ask has dropped $15k (9%) from the opening price — seller is motivated, your offer sets the floor, not the list.
- Current owner paid $50k; list at $150k implies a 200% gain — meaningful room to come down on a strong offer.
Risks & watch-outs
- Watch-outs: built in 1925 — expect roof / HVAC / electrical / plumbing capex.
- Climate carrying-cost: extreme-heat days projected 7→15/yr by 2055 (HVAC capex compounding) — expect insurance premiums to compound above CPI over the hold.
Questions for the listing agent
- It's been on market 70 days. Have you received any prior offers? Is the seller open to a 6% concession, seller financing, or rate buy-down credit?
- Built in 1925 — when were the roof, HVAC, electrical panel, plumbing, and water heater last replaced?
- Why hasn't it sold? Are there any deal-killer items the seller is aware of (foundation, flood, title, zoning, code violations)?
- Is there a deadline driving the sale (1031 exchange, divorce, estate, relocation)? That informs how much negotiation room exists.
- What's the average days-on-market for RENTAL listings here right now (not sales)? A rising rental-DOM trend means longer vacancies and softer asking-rent achievability than the comps imply.
- What's the recent tenant-quality profile in this submarket — average credit score on applications, eviction rate, late-payment / NSF rate, and stable-employment percentage? A property-management company in the area should have these aggregated.
- How much new for-sale + rental construction is in the pipeline within 1–3 miles? Heavy new supply typically softens prices + rents 12–24 months out; constrained supply supports both.
Investment metrics
- 1% rule
- 1.03% ✓
- Cap rate
- 8.19%
- Cash-on-cash
- 6.77%
- DSCR
- 1.30
- GRM
- 8.1
CMA / ARV
- ARV (median comp)
- $171,097
- List price
- $150,000
- Delta
- -12.33%
- Verdict
- UNDERPRICED
- Comps
- 20 within 1.0 mi
Show comp detail 12 sales within ~0.75 mi
| Address | Dist | Beds/Ba | Sqft | Sold | Price | $/sf | Match |
|---|---|---|---|---|---|---|---|
| 517 Manor St | 0.04mi | 2/1.0 | 902 (+8%) | 1mo | $170,000 | $188 | 83 |
| 432 W Marion St | 0.30mi | 2/1.0 | 876 (+5%) | 1mo | $262,000 | $299 | 76 |
| 408 Prospect St | 0.54mi | 2/1.0 | 840 (+1%) | 1mo | $210,000 | $250 | 72 |
| 732-1/2 Marietta Ave | 0.35mi | 2/1.0 | 924 (+11%) | 1mo | $177,000 | $192 | 64 |
| 506 Beaver St | 0.63mi | 3/1.0 (+1) | 850 (+2%) | 0mo | $167,000 | $196 | 62 |
| 732 Marietta Ave | 0.35mi | 2/1.0 | 715 (-14%) | 1mo | $157,000 | $220 | 60 |
| 720 5th St | 0.42mi | 3/1.0 (+1) | 916 (+10%) | 3mo | $219,900 | $240 | 56 |
| 826 Saint Joseph St | 0.41mi | 3/1.0 (+1) | 936 (+13%) | 2mo | $187,096 | $200 | 53 |
| 834 Wabank St | 0.58mi | 2/1.0 | 936 (+13%) | 1mo | $165,000 | $176 | 51 |
| 917 Columbia Ave #412 | 0.64mi | 2/2.0 | 908 (+9%) | 1mo | $187,900 | $207 | 50 |
| 917 Columbia Ave #223 | 0.64mi | 2/2.0 | 945 (+14%) | 2mo | $211,000 | $223 | 42 |
| 440-1/2 N Water St | 0.75mi | 2/1.5 | 721 (-13%) | 3mo | $225,000 | $312 | 39 |
Match score weights: distance 35% · size 25% · config 20% · recency 20%. Top-matched comps best support the ARV.
Projected returns pro-forma
-3.0% appreciation · 0.47% rent growth · sell at horizon
- IRR
- -8.7%
- Equity multiple
- 0.69×
- Total profit
- $-13,081
- Equity at exit
- $22,365
- IRR
- -2.8%
- Equity multiple
- 0.83×
- Total profit
- $-7,009
- Equity at exit
- $12,969
Cash invested: $42,000 (down + closing). Projections, not guarantees.
Landlord ↔ Tenant lean methodology
- Overall (STATE)
- 62 Landlord-Friendly
- State Pennsylvania
- 62 Landlord-Friendly · EVEN
- County
- — inherits STATE
- City
- — inherits STATE
ZIP-level market 17603
- Rents YoY
- 0.5%
- Active inventory
- 296
- Price-to-rent
- 8.1×
Monthly cashflow live
- Estimated rent
- $1,550 high interval (Pro) →
- Mortgage (P&I)
- −$787
- Tax from tax record
- −$138 /mo · $1,661/yr
- Insurance
- −$62
- HOA
- −$0
- Vacancy / Maint / Mgmt
- −$325
- Net cashflow
- $237
Break-even live
Sensitivity live
| Price | -10% $322 | -5% $279 | +0% $237 | +5% $194 | +10% $152 |
|---|---|---|---|---|---|
| Rent | -10% $114 | -5% $176 | +0% $237 | +5% $298 | +10% $359 |
| Rate | -1.0pp $312 | -0.5pp $275 | base $237 | +0.5pp $198 | +1.0pp $158 |
UW: 25.0% down · 7.5% · 30yr · 1.5% tax · 5.0% vac · 8.0% maint · 8.0% mgmt
Financing live
Cash to close
- Down payment
- $37,500
- Closing costs
- $4,500
- Reserves months
- —
- Total cash needed
- —
Loan-product check · same deal, 3 products live
Conventional
25% down · 7.5% · 30yr
- Down + closing
- —
- Monthly P&I
- —
- Monthly cashflow
- —
- DSCR
- —
- Eligible?
- —
Personal DTI + credit; lowest rate.
DSCR
20% down · 8.5% · 30yr
- Down + closing
- —
- Monthly P&I
- —
- Monthly cashflow
- —
- DSCR
- —
- Eligible?
- —
No personal income docs; deal must DSCR.
Hard money
10% down · 12.0% · 12mo
- Down + closing
- —
- Monthly P&I
- —
- Monthly cashflow
- —
- DSCR
- —
- Eligible?
- —
Short-term bridge; refi at stabilization.
Rent comps 40 comps
| Address | Beds | Baths | Sqft | Rent | $/sqft | DOM | Units | Dist |
|---|---|---|---|---|---|---|---|---|
| 37 E Filbert St Lancaster, PA | 3.0 | 1.0 | 1002 | $1,750 | $1.75 | 45d | 1 | 0.10mi |
| 475 Saint Joseph St Lancaster, PA | 1.0 | 1.0 | 750 | $1,000 | $1.33 | 15d | 1 | 0.19mi |
| 437 W Grant St Unit 302 Lancaster, PA | 1.0 | 1.0 | 650 | $1,775 | $2.73 | 25d | 1 | 0.22mi |
| 437 W Grant St Lancaster, PA | 1.0 | 1.0 | 713 | $1,795 | $2.52 | 25d | 1 | 0.22mi |
| 324 New Dorwart St Lancaster, PA | 3.0 | 1.0 | 1020 | $1,495 | $1.47 | 15d | 1 | 0.29mi |
| 431 Fremont St Unit 4 Lancaster, PA | 1.0 | 1.0 | 641 | $1,095 | $1.71 | 45d | 1 | 0.30mi |
| 678 1/2 Columbia Ave Apt 2 Lancaster, PA | 3.0 | 1.0 | 1100 | $1,495 | $1.36 | 15d | 1 | 0.31mi |
| 35 N Mulberry St Unit 1st floor Lancaster, PA | 1.0 | 1.0 | 700 | $1,085 | $1.55 | 45d | 1 | 0.34mi |
| 422 Hillside Ave Lancaster, PA | 2.0 | 1.0 | 960 | $1,245 | $1.30 | 45d | 1 | 0.43mi |
| 118 N Prince St Lancaster, PA | 1.0–3.0 | 1.0–3.0 | 1274 | $3,199 | $2.51 | 15d | 48 | 0.48mi |
| 34 Conestoga St Unit 1 Lancaster, PA | 2.0 | 1.0 | 671 | $995 | $1.48 | 22d | 1 | 0.49mi |
| 433 W Walnut St Apt 2 Lancaster, PA | 2.0 | 1.0 | 900 | $1,840 | $2.04 | 25d | 1 | 0.49mi |
| 404 Beaver St Lancaster, PA | 3.0 | 1.0 | 1025 | $1,425 | $1.39 | 25d | 1 | 0.55mi |
| 323 N Mulberry St Unit 4 Lancaster, PA | 1.0 | 1.0 | 600 | $1,500 | $2.50 | 15d | 1 | 0.59mi |
| 227 N Prince St Lancaster, PA | 1.0 | 1.0 | 483 | $1,575 | $3.26 | 15d | 4 | 0.59mi |
| 445 W Lemon St Unit 4 Lancaster, PA | 1.0 | 1.5 | 540 | $1,445 | $2.68 | 25d | 1 | 0.60mi |
| 344 N Mulberry St Unit 2 Lancaster, PA | 1.0 | 1.0 | 722 | $1,065 | $1.48 | 25d | 1 | 0.61mi |
| 202 N Queen St Lancaster, PA | 2.0 | 1.0–2.0 | 697 | $2,718 | $3.90 | 15d | 12 | 0.62mi |
| 519 1/2 S Prince St Lancaster, PA | 2.0 | 1.0 | 848 | $1,550 | $1.83 | 15d | 1 | 0.64mi |
| 38 E Walnut St Lancaster, PA | 1.0 | 1.0 | 587 | $1,495 | $2.55 | 25d | 1 | 0.74mi |
| 1127 Wabank St Lancaster, PA | 1.0–2.0 | 1.0 | 760 | $1,650 | $2.17 | 25d | 1 | 0.76mi |
| 347 N Queen St Lancaster, PA | 1.0 | 1.0 | 687 | $2,025 | $2.95 | 15d | 10 | 0.77mi |
| 225 E King St Unit 1 Lancaster, PA | 2.0 | 1.0 | 957 | $1,950 | $2.04 | 15d | 1 | 0.81mi |
| 225 E King St Unit 2 Lancaster, PA | 2.0 | 2.5 | 1075 | $2,600 | $2.42 | 45d | 1 | 0.81mi |
| 72 Howard Ave Lancaster, PA | 2.0 | 1.0 | 572 | $1,495 | $2.61 | 22d | 1 | 0.85mi |
| 114 E Lemon St Lancaster, PA | 1.0 | 1.0 | 627 | $1,347 | $2.15 | 15d | 2 | 0.86mi |
| 480 Euclid Ave Lancaster, PA | 1.0–2.0 | 1.0–1.5 | 830 | $1,695 | $2.04 | 45d | 1 | 0.86mi |
| 506 N Queen St Unit 2 Lancaster, PA | 1.0 | 1.0 | 556 | $1,500 | $2.70 | 15d | 1 | 0.86mi |
| 61 Howard Ave Apt 1 Lancaster, PA | 2.0 | 1.0 | 650 | $1,045 | $1.61 | 45d | 1 | 0.89mi |
| 145 Chester St Fl REAR Lancaster, PA | 1.0 | 1.0 | 800 | $1,125 | $1.41 | 15d | 1 | 0.89mi |
| 446 N Duke St Unit 1R Lancaster, PA | 1.0 | 1.0 | 580 | $1,095 | $1.89 | 45d | 1 | 0.91mi |
| 850 Highland Ave Lancaster, PA | 2.0 | 1.0 | 1000 | $1,300 | $1.30 | 22d | 1 | 0.99mi |
| 816 N Prince St Lancaster, PA | 1.0–2.0 | 1.0–2.0 | 794 | $2,195 | $2.76 | 15d | 7 | 1.04mi |
| 442 E King St Lancaster, PA | 1.0 | 1.0 | 600 | $925 | $1.54 | 25d | 1 | 1.06mi |
| 1415 Spencer Ave Lancaster, PA | 1.0–3.0 | 1.0–2.0 | 1181 | $2,610 | $2.21 | 15d | 1 | 1.08mi |
| 709 N Duke St Lancaster, PA | 1.0 | 1.0 | 588 | $1,550 | $2.64 | 22d | 1 | 1.11mi |
| 721 N Duke St Unit 1 Lancaster, PA | 1.0 | 1.0 | 850 | $1,295 | $1.52 | 15d | 1 | 1.13mi |
| 1633A Judie Ln Lancaster, PA | 1.0–2.0 | 1.0–2.0 | 848 | $1,698 | $2.00 | 15d | 13 | 1.19mi |
| 135 E Ross St Unit 2nd Floor Lancaster, PA | 2.0 | 1.0 | 1000 | $1,575 | $1.57 | 15d | 1 | 1.26mi |
| 605 Lehigh Ave Lancaster, PA | 2.0 | 1.0 | 784 | $1,395 | $1.78 | 45d | 1 | 1.33mi |
Listing history 29 events
-
2026-06-21days on market $150,000 Active 70 DOM
-
2026-06-18days on market $150,000 Active 67 DOM
-
2026-06-17days on market $150,000 Active 66 DOM
-
2026-06-16days on market $150,000 Active 65 DOM
-
2026-06-15days on market $150,000 Active 64 DOM
-
2026-06-14days on market $150,000 Active 62 DOM
-
2026-06-13days on market $150,000 Active 61 DOM
-
2026-06-10days on market $150,000 Active 59 DOM
-
2026-06-09days on market $150,000 Active 58 DOM
-
2026-06-08days on market $150,000 Active 57 DOM
-
2026-06-07days on market $150,000 Active 56 DOM
-
2026-06-03days on market $150,000 Active 52 DOM
-
2026-06-02days on market $150,000 Active 51 DOM
-
2026-06-01days on market $150,000 Active 50 DOM
-
2026-05-31days on market $150,000 Active 49 DOM
-
2026-05-30days on market $150,000 Active 48 DOM
-
2026-05-12price $150,000 312-char remark
Show marketing remark (312 chars)
Great investment opportunity located in SOWE neighborhood. Tenant occupied, current rent is below market value and lease is month to month. (Projected Market Rent $1,200). Ready for investor to add to rental portfolio. Two-bedroom, brick home with fenced in backyard, original hardwood floors and laundry hookup.
-
2026-04-13$165,000 Active 312-char remark
Show marketing remark (312 chars)
Great investment opportunity located in SOWE neighborhood. Tenant occupied, current rent is below market value and lease is month to month. (Projected Market Rent $1,200). Ready for investor to add to rental portfolio. Two-bedroom, brick home with fenced in backyard, original hardwood floors and laundry hookup.
-
2026-04-12historical $165,000 312-char remark
Show marketing remark (312 chars)
Great investment opportunity located in SOWE neighborhood. Tenant occupied, current rent is below market value and lease is month to month. (Projected Market Rent $1,200). Ready for investor to add to rental portfolio. Two-bedroom, brick home with fenced in backyard, original hardwood floors and laundry hookup.
-
2017-02-13soldstatus $50,000
-
2016-12-22historical
-
2016-12-22historical
-
2016-12-01$225,000
-
2016-12-01$57,000
-
2010-03-11historical
-
2009-09-18$34,900
-
2009-09-18historical
-
2009-04-02$34,900
-
1980-05-27soldstatus $6,500
ⓘ Source: listings_history table (triggers on properties + properties_extension) + one-shot
backfill from property_details.listing_events for pre-trigger history.
Tax reassessment forecast PA · Partial reset (capped growth)
- Current annual tax
- $1,661 · $138/mo
- Projected year-2 tax
- $2,016 · $168/mo
- Expected delta
- +$354/yr (+$30/mo · 21.3%)
ⓘ Screening estimate from a state-policy table — verify with the county assessor before closing.
Climate risk First Street
- Flood 1/10 Low FEMA zone X (unshaded) · 0% chance over 30 yrs
- Wildfire 1/10 Low
- Heat 6/10 Major 7 d/yr ≥101°F today · 15 d/yr by 30 yrs out
- Wind 4/10 Moderate 16% chance of damaging wind over 30 yrs
- Air quality 4/10 Moderate 4 unhealthy d/yr today · 7 by 30 yrs out
Nearby sold comps map
Loading sold comps map…
Walkable amenities ~0.75 mi
Loading nearby amenities…
Taxation est. · year 1
- Rental income
- $18,597
- − Mortgage interest
- −$8,402
- − Property taxes
- −$1,661
- − Insurance
- −$750
- − Repairs & maintenance
- −$1,488
- − Management
- −$1,488
- − Depreciation
- −$4,364
- Taxable income
- $445
- Est. tax owed @ 24.0%
- −$107
- After-tax cash flow
- $2,735/yr
For passive investors: Depreciation is non-cash, so a rental often shows a tax loss while cash-flowing — sheltering income. Rental losses are passive: they offset passive income freely, and up to $25,000/yr can offset ordinary (W-2) income if you actively participate and your MAGI is under $100k (phasing out to $0 by $150k); unused losses carry forward. On sale, claimed depreciation is recaptured at up to 25%, and gains may owe capital-gains tax (a 1031 exchange can defer both). Figures are a year-1 estimate at your 24.0% rate — not tax advice; consult a CPA.
Schools (NCES district)
- District
- Lancaster SD
- NCES district ID
- 4213140
- Math proficiency
- 12% ▼ -10.00%
- Reading proficiency
- 25% ▼ -13.00%
- Median HH income
- $38,500
- Composite
- 15.52/100
- National rank
- #9301
- State rank
- #500 of 539 in PA
Livability — Lancaster
- Score
- 85/100
- State rank
- #71
- US rank
- #498
Category grades
Schools grade is shown separately in the Schools card above.
Census & demographics
- Census place
- Lancaster, PA
- County
- Lancaster County · 390,309 people
- City population
- 176,170
- Metro
- Lancaster, PA
- Population (ZIP)
- 67,571
- Household income
- $77,084
- Rent vs Own
- Severe rent burden
- 2557.0
Population outlook (Lancaster County) Hauer SSP2
- Today (2025)
- 561,011 people
- By 2030
- 570,969 · +1.8%
- By 2040
- 585,929 · +4.4%
- By 2050
- 591,056 · +5.4%
- By 2075
- 594,747 · +6.0%
- By 2100
- 558,850 · -0.4%
Race, ethnicity, and origin ACS 2023
- Neighborhood character
- Diverse neighborhood (Simpson 0.59)
- Race & ethnicity
- White 58% Hispanic / Latino 27% Two or more races 12% Black 7% Asian 4%
- Hispanic origin (detail)
- Mexican 1% Puerto Rican 19% Cuban 1% Dominican 2%
- Common ancestry
- Romanian 2% Slovak 2% Lithuanian 1%
- Foreign-born
- 9% · Canada, China, India
- Languages at home
- 77% English-only · Spanish 17% Other Indo-European 1% Chinese 1%
Political lean MEDSL · Lancaster
- 2024 margin
- R (+15.9) · D 41.5% · R 57.5%
- 2008→2024 swing
- -4.1pp toward R · 2008: -11.8pp · 2024: -15.9pp
- All cycles
- 2024: R+15.9 2020: R+15.8 2016: R+19.7 2012: R+19.2 2008: R+11.8
Not yet ingested
- Civics
- —
Market trends
- HPI YoY
- ▼ -508.78%
- Current HPI
- 289.3324
- Rent YoY
- ▲ 0.47%
- Metro
- Lancaster, PA
- State GDP YoY
- ▲ 1.68%
- F500 in state
- 34
Industry mix (Fortune 500 HQ in PA)
| Industry | F500 HQs | Revenue |
|---|---|---|
| Healthcare | 2 | $309B |
|
||
| Insurance | 2 | $27B |
|
||
| Telecommunications / Media | 1 | $124B |
|
||
| Industrial Distribution | 1 | $22B |
|
||
| Financial Services | 1 | $20B |
|
||
| Chemicals / Materials | 1 | $18B |
|
||
Price history
+2207.7% since first listed13 events — show timeline
- 2026-05-12 Price Changed $150,000 BRIGHT MLS
- 2026-04-13 Listed $165,000 BRIGHT MLS
- 2026-04-12 Coming Soon $165,000 BRIGHT MLS
- 2017-02-13 Sold (MLS) $50,000 BRIGHT MLS
- 2016-12-22 Listing Removed — BRIGHT MLS
- 2016-12-22 Listing Removed — BRIGHT MLS
- 2016-12-01 Listed $57,000 BRIGHT MLS
- 2016-12-01 Listed $225,000 BRIGHT MLS
- 2010-03-11 Listing Removed — BRIGHT MLS
- 2009-09-18 Listing Removed — BRIGHT MLS
- 2009-09-18 Listed $34,900 BRIGHT MLS
- 2009-04-02 Listed $34,900 BRIGHT MLS
- 1980-05-27 Sold (Public Records) $6,500 Public Records
Property tax history
-1.1%/yrLatest (2026): $1,661 · +3.3% YoY. Source: county tax records.
Cash-flow waterfall
monthlySold comps — $/sqft
last 12 mo · ≤1 miLoading sold comps…